Ethereum's Inverse Head and Shoulders Pattern Suggests $14K Target Amidst Current Challenges
Ethereum's market activity shows a potential shift with analysts focusing on a key neckline that hints at a long-term breakout towards $14,000.


Ethereum is currently priced around $3,300 with a 24-hour trading volume of $34.26 billion. The cryptocurrency has experienced a 3% decline in the last day and a 14% drop over the week.
Despite these setbacks, analysts are monitoring crucial technical indicators suggesting a possible long-term trend reversal.
Inverse Head and Shoulders Pattern Indicates Key Level Ahead
Trader Tardigrade illustrated an Inverse Head and Shoulders configuration in Ethereum’s monthly chart, highlighting a neckline range of approximately $4,000 to $4,400. A breakthrough past this level could pave the way for a rally towards $14,000. Tardigrade commented, “The Right Shoulder is under construction.”
*Translation: “El hombro derecho está en construcción.”
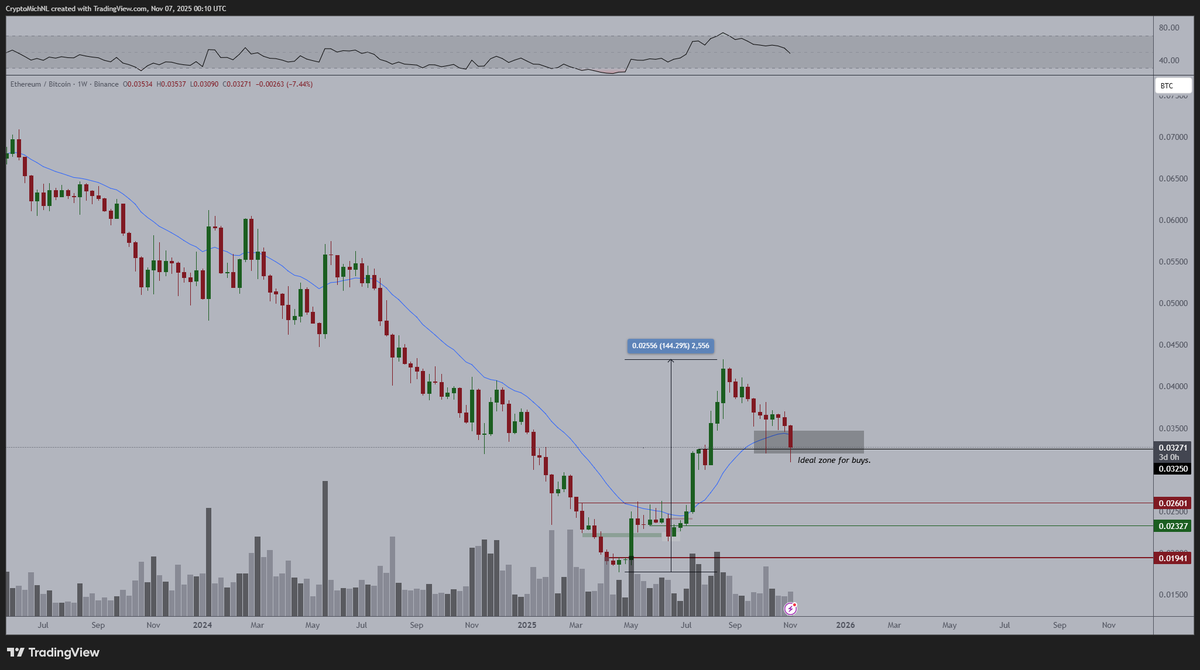
Moreover, a 38.2% Fibonacci retracement level marked by Michaël van de Poppe around $3,050 could act as support, and if Ethereum holds this, a bullish trend could unfold.
Short-Term Data Indicates Ongoing Selling Pressure
CryptoQuant analyst PelinayPA pointed out that the Taker Buy-Sell Ratio on Binance is below 1.0, suggesting stronger selling activity in recent sessions. Subsequently, Bitcoinsensus noted a rebound for Ethereum after dipping below $3,300, defining $5,000 as a compelling target area.
For further insights, check the following articles:
- Ethereum Traders Just Flipped Bullish, But History Says This Is a Major Red Flag
- NewYorkCoin Skyrockets on Social Feeds as Zohran Mamdani’s Win Triggers a Political Crypto Frenzy
- Ethereum Sellers Dominate, But $5K Year-End Target Holds Firm
Conclusion
While the market activity currently appears challenging for Ethereum, the technical formations are being closely observed, which may indicate a significant shift should key resistance levels be breached.
