Analyzing Ripple's Price Dynamics: Is XRP Set for a Further Increase Following a 12% Daily Rise?
Ripple's XRP is showing signs of recovery after a period of price compression. This analysis explores potential resistance levels and future market movements.


Ripple’s XRP token is working to recover after experiencing recent lows amid weeks of compression within a descending wedge formation. The market is currently encountering several resistance levels, where a breakout might indicate a short-term structural reversal.
Technical Analysis
Daily Chart
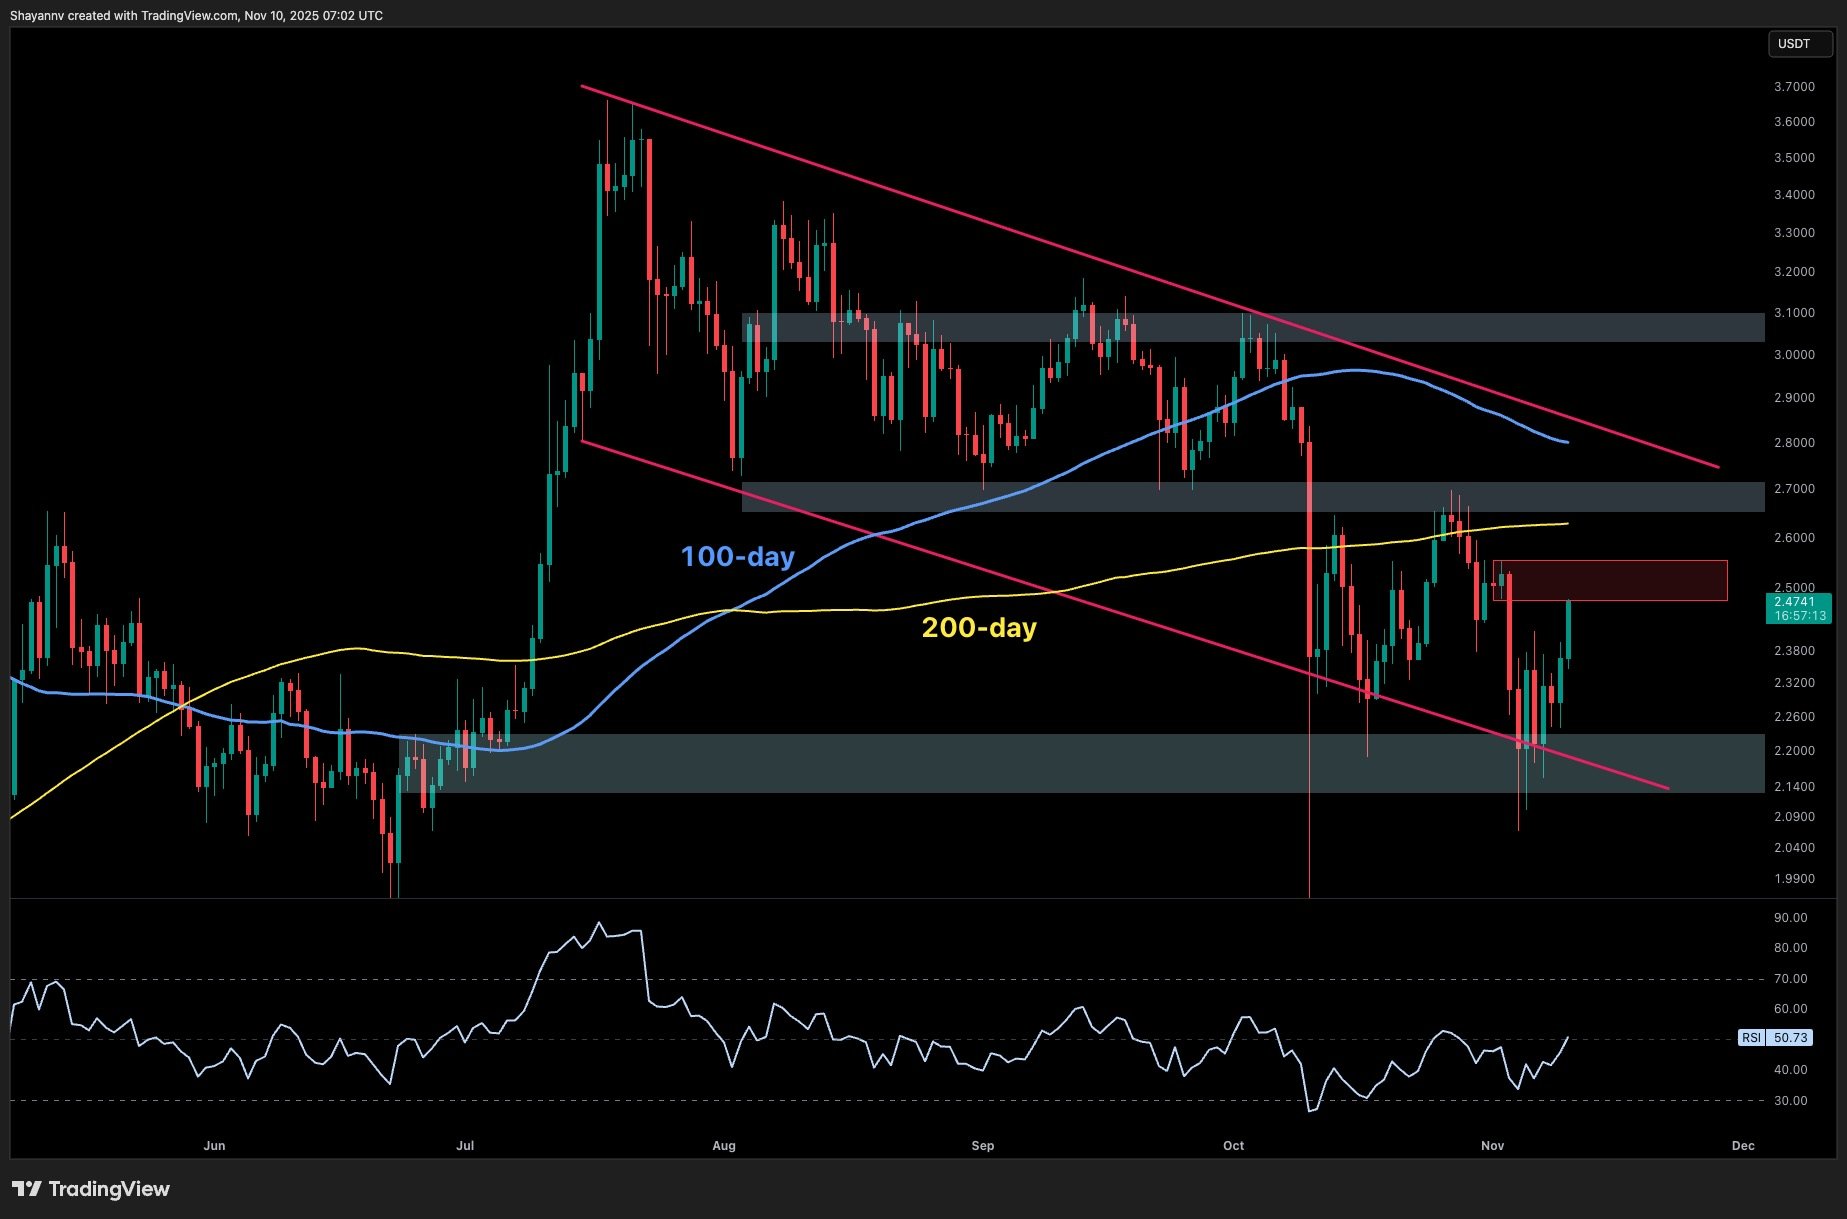
On the daily chart, XRP is still performing within a broad descending wedge structure, often indicative of a bullish reversal when backed by increasing volume. After bouncing off the $2.1–$2.2 support zone, XRP has made a move towards $2.5, coinciding with a crucial resistance area and close to the 200-day moving average. The 100-day moving average also presents a nearby resistance around $2.7, creating a significant confluence of resistance levels.
A daily closing price above $2.6 could signal potential confirmation of a breakout, favoring buyers and setting the stage for a move towards the $2.8–$3.1 supply range. Conversely, failing to surpass this level may result in rejection, keeping XRP trapped in its mid-term descending trend and potentially retesting the $2.3–$2.2 support level.
The RSI showing a break above the midpoint suggests that momentum is recovering, yet continued strength relies on confirming signals from price movements and volume expansion through the resistance levels.
Daily Chart
4-Hour Chart
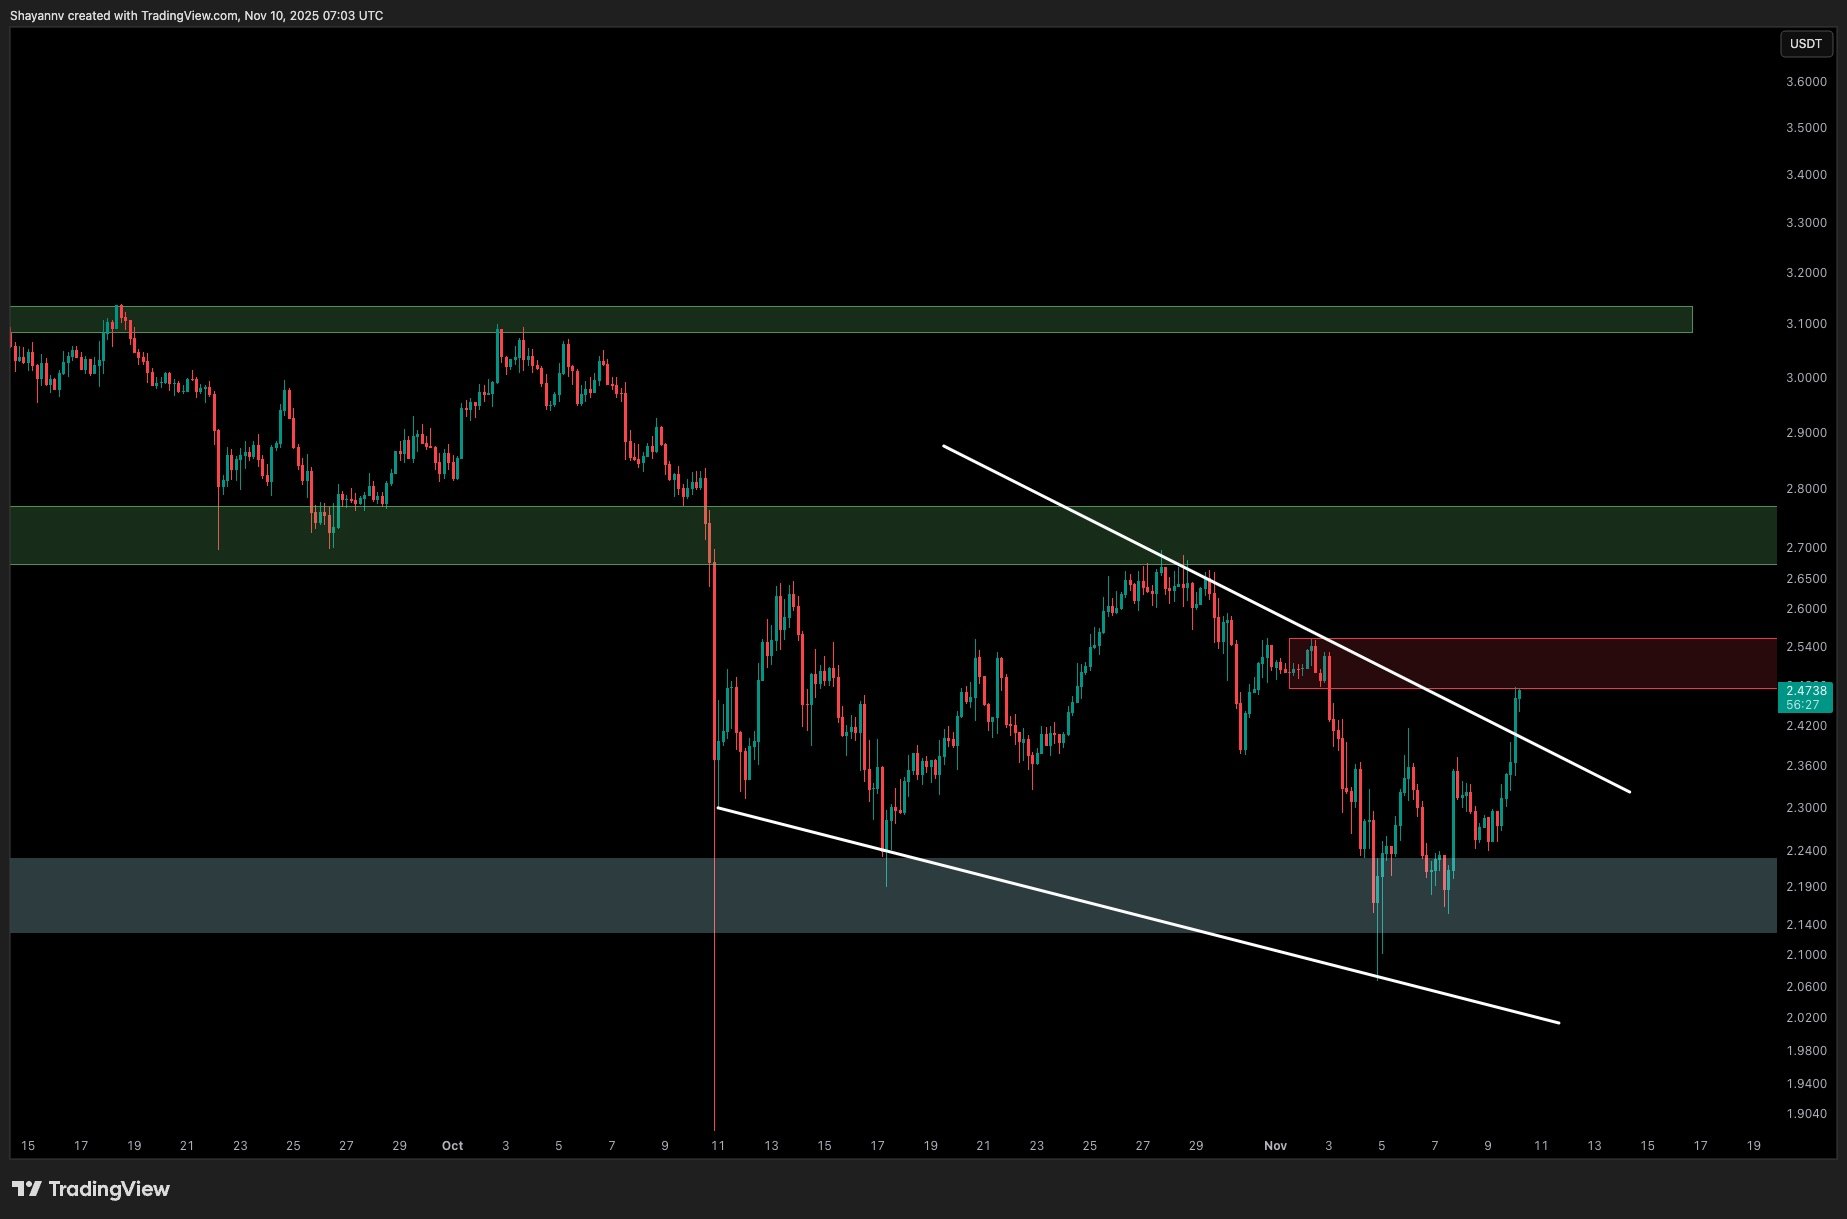
The 4-hour chart indicates the effectiveness of liquidity release from the lower side of the structure. XRP has established a clear bullish divergence on the RSI following a dip below $2.2, indicating the end of selling pressure. The subsequent breakout attempt is aiming for the $2.55-$2.6 resistance area, coinciding with the previous lower high. Should the price successfully convert this area into support, a retest of $2.8 becomes increasingly probable.
In contrast, a rejection at this resistance would confirm it as a temporary seller’s base, driving a potential price drop back toward the $2.3 mid-range level before any further upward movement.
This formation reflects a classic breakout-retest pattern occurring after a prolonged compression phase, but confirmation is reliant on XRP’s behavior around the $2.5 pivot.
 4-Hour Chart
SPECIAL OFFER: Exclusive secret partnership bonuses for CryptoPotato readers: Use this link to register and unlock $1,500 in exclusive BingX Exchange rewards (limited time offer).
Disclaimer: The information provided on CryptoPotato reflects the views of the authors quoted and is not indicative of the opinions of CryptoPotato regarding whether to buy, sell, or hold any cryptocurrencies. Conduct thorough research before making any investment decisions.
