Bitcoin's Bullish Double Bottom Might Target $110K, Yet CME Gap Raises Caution
Analysts notice Bitcoin could rally towards $110,000, although there are dynamics suggesting a short-term pullback due to gaps in the market.


Bitcoin has showcased a notable double bottom pattern recently, capturing bullish interest and aiming for a target of $110,000. Nonetheless, the accumulation of stablecoins and possible CME gaps are signals for caution.
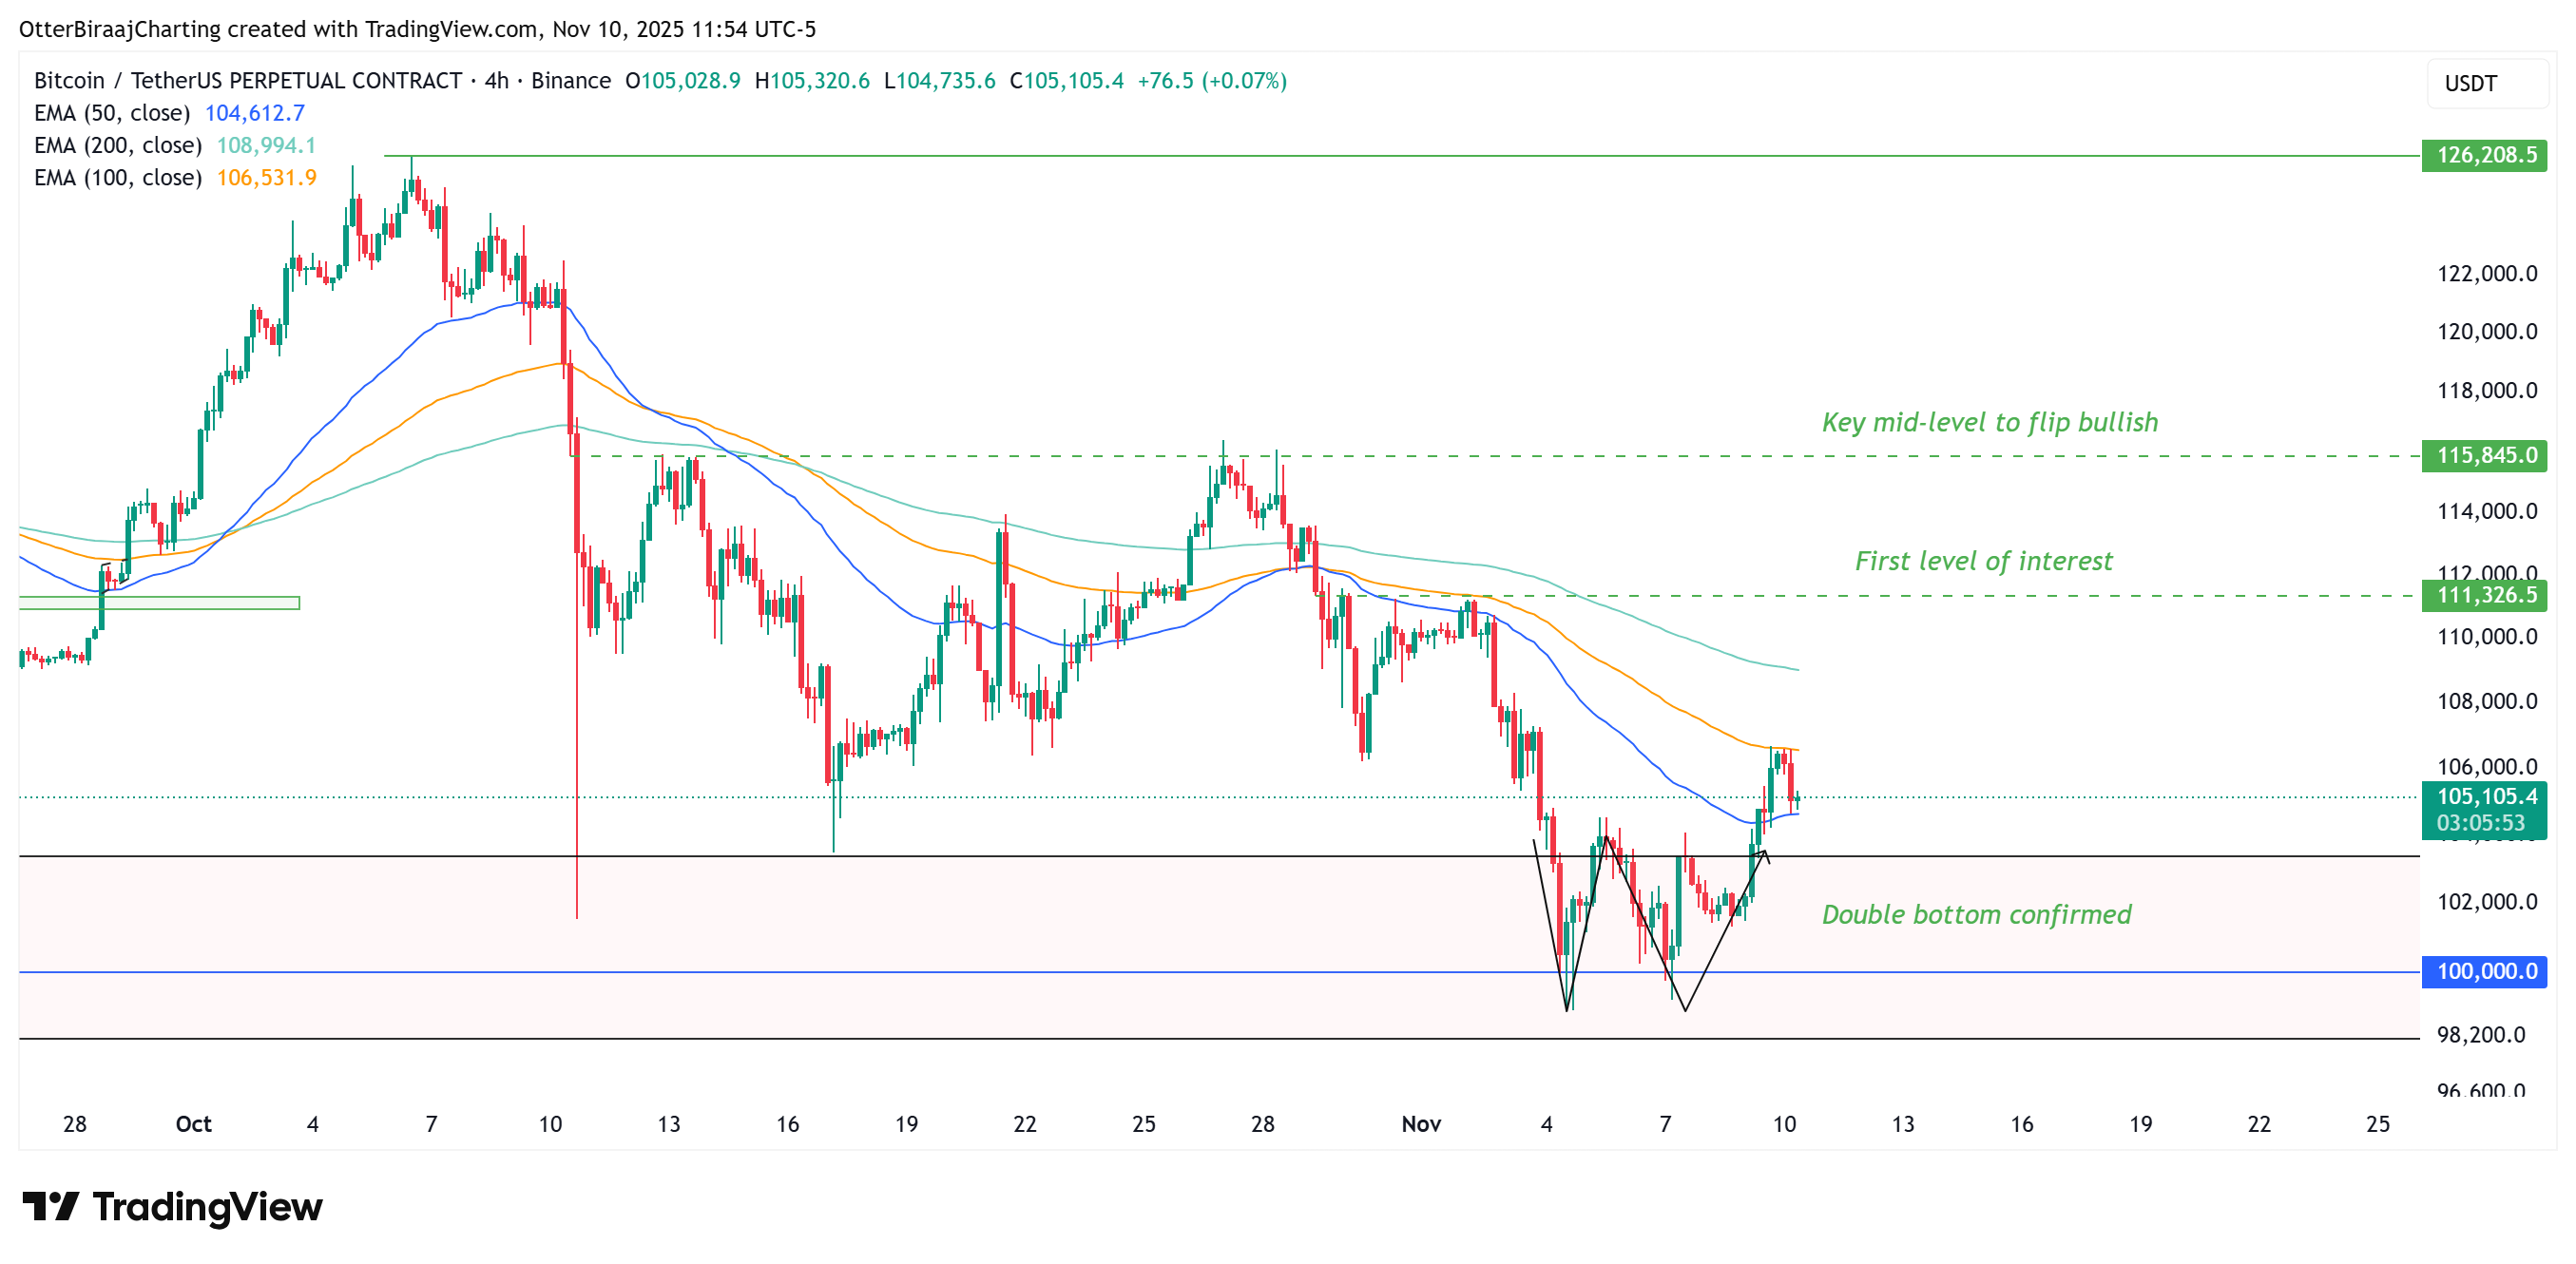 Bitcoin four-hour chart. Source: Cointelegraph/TradingView
Key Takeaways:
- The double bottom formation could propel Bitcoin closer to the $110,000 mark.
- A CME gap around $104,000 suggests the possibility of a short-term downturn.
- The build-up of stablecoins indicates potential volatility in the near term.
Bitcoin (BTC) achieved a bullish weekly close above its 50-week moving average after completing a classic double bottom pattern over the weekend. This setup aligned with the daily order block between $98,100 and $102,000, where Bitcoin consistently tested the $100,000 threshold before rebounding.
Following the positive structural break seen in the four-hour chart, Bitcoin now faces resistance around $111,300, with potential tests if momentum persists. However, on-chain metrics warn that this upward move may not occur without obstacles.
Glassnode indicates that Bitcoin bounced back from the 75th percentile cost basis close to $100,000, with the next crucial resistance point at the 85th percentile cost basis near $108,500. Historically, this level has posed challenges during recovery phases.
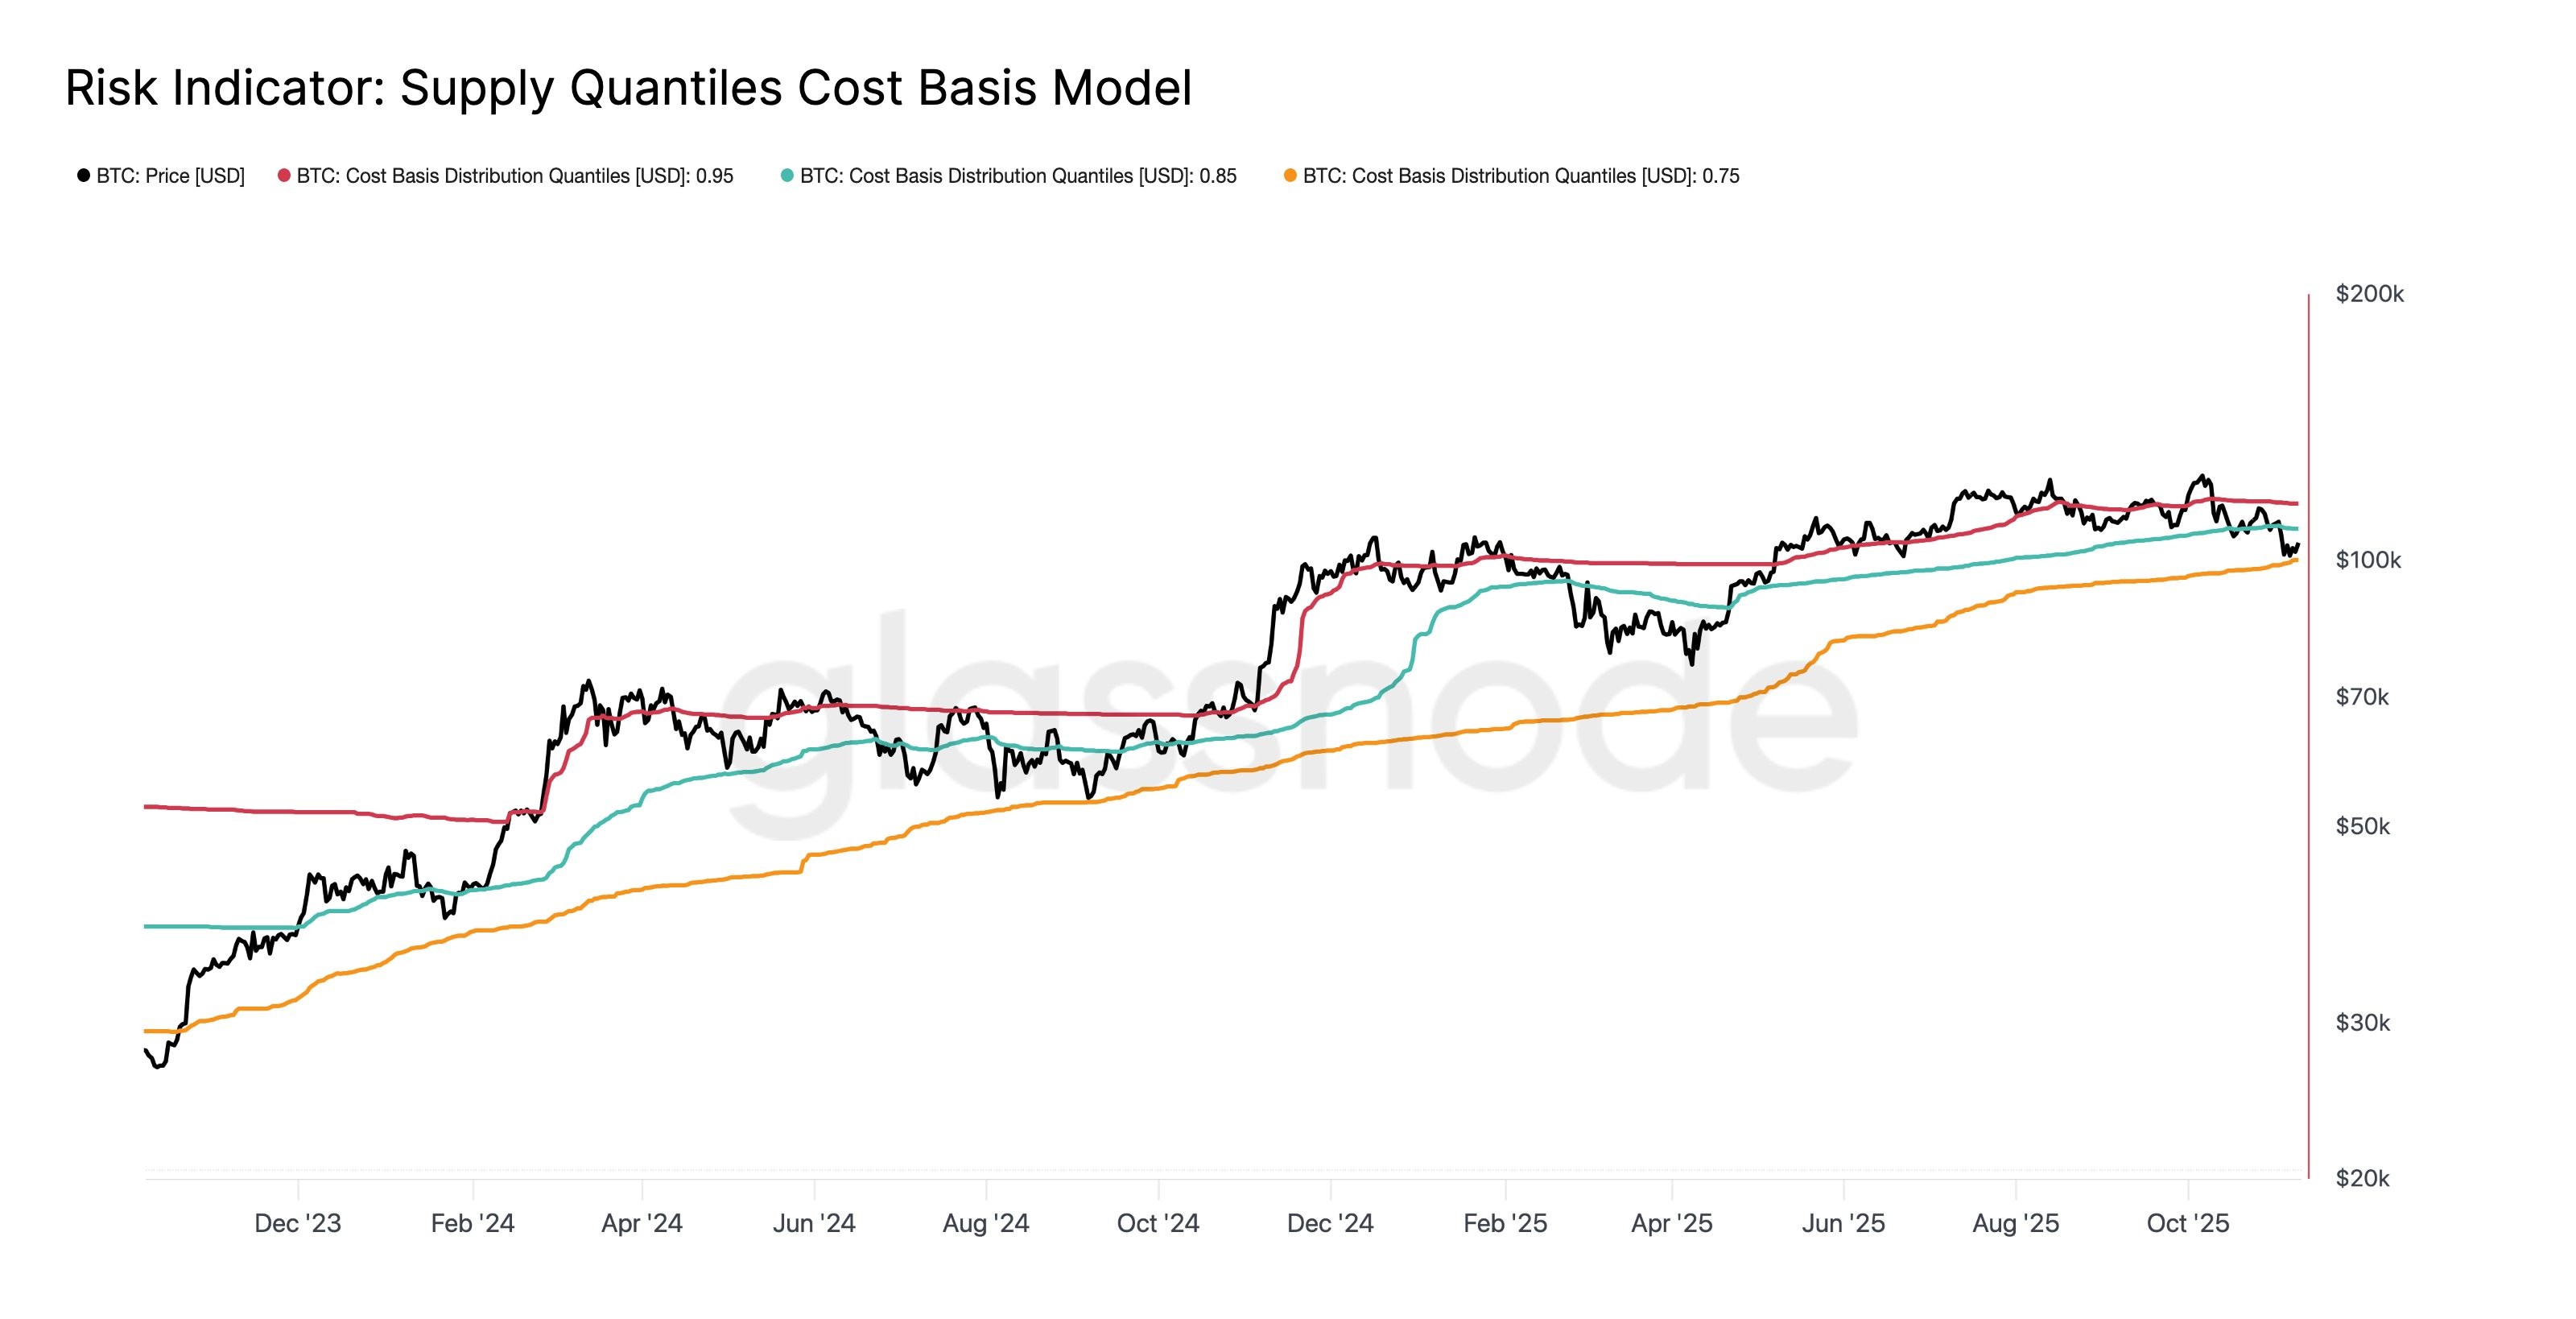 Bitcoin cost basis distribution levels. Source: Glassnode
Additionally, Cointelegraph has pointed out the risk of liquidity spikes above $115,000, coinciding with daily resistance and the depletion of long-side liquidity around $100,000.
A CME gap within the $103,100 to $104,000 range presents another significant short-term concern. CME gaps manifest when there’s a discrepancy between Friday’s close and Monday’s open price on the Chicago Mercantile Exchange, and these often get “filled” as traders return to these points, hinting at a brief retracement before resuming upward motion.
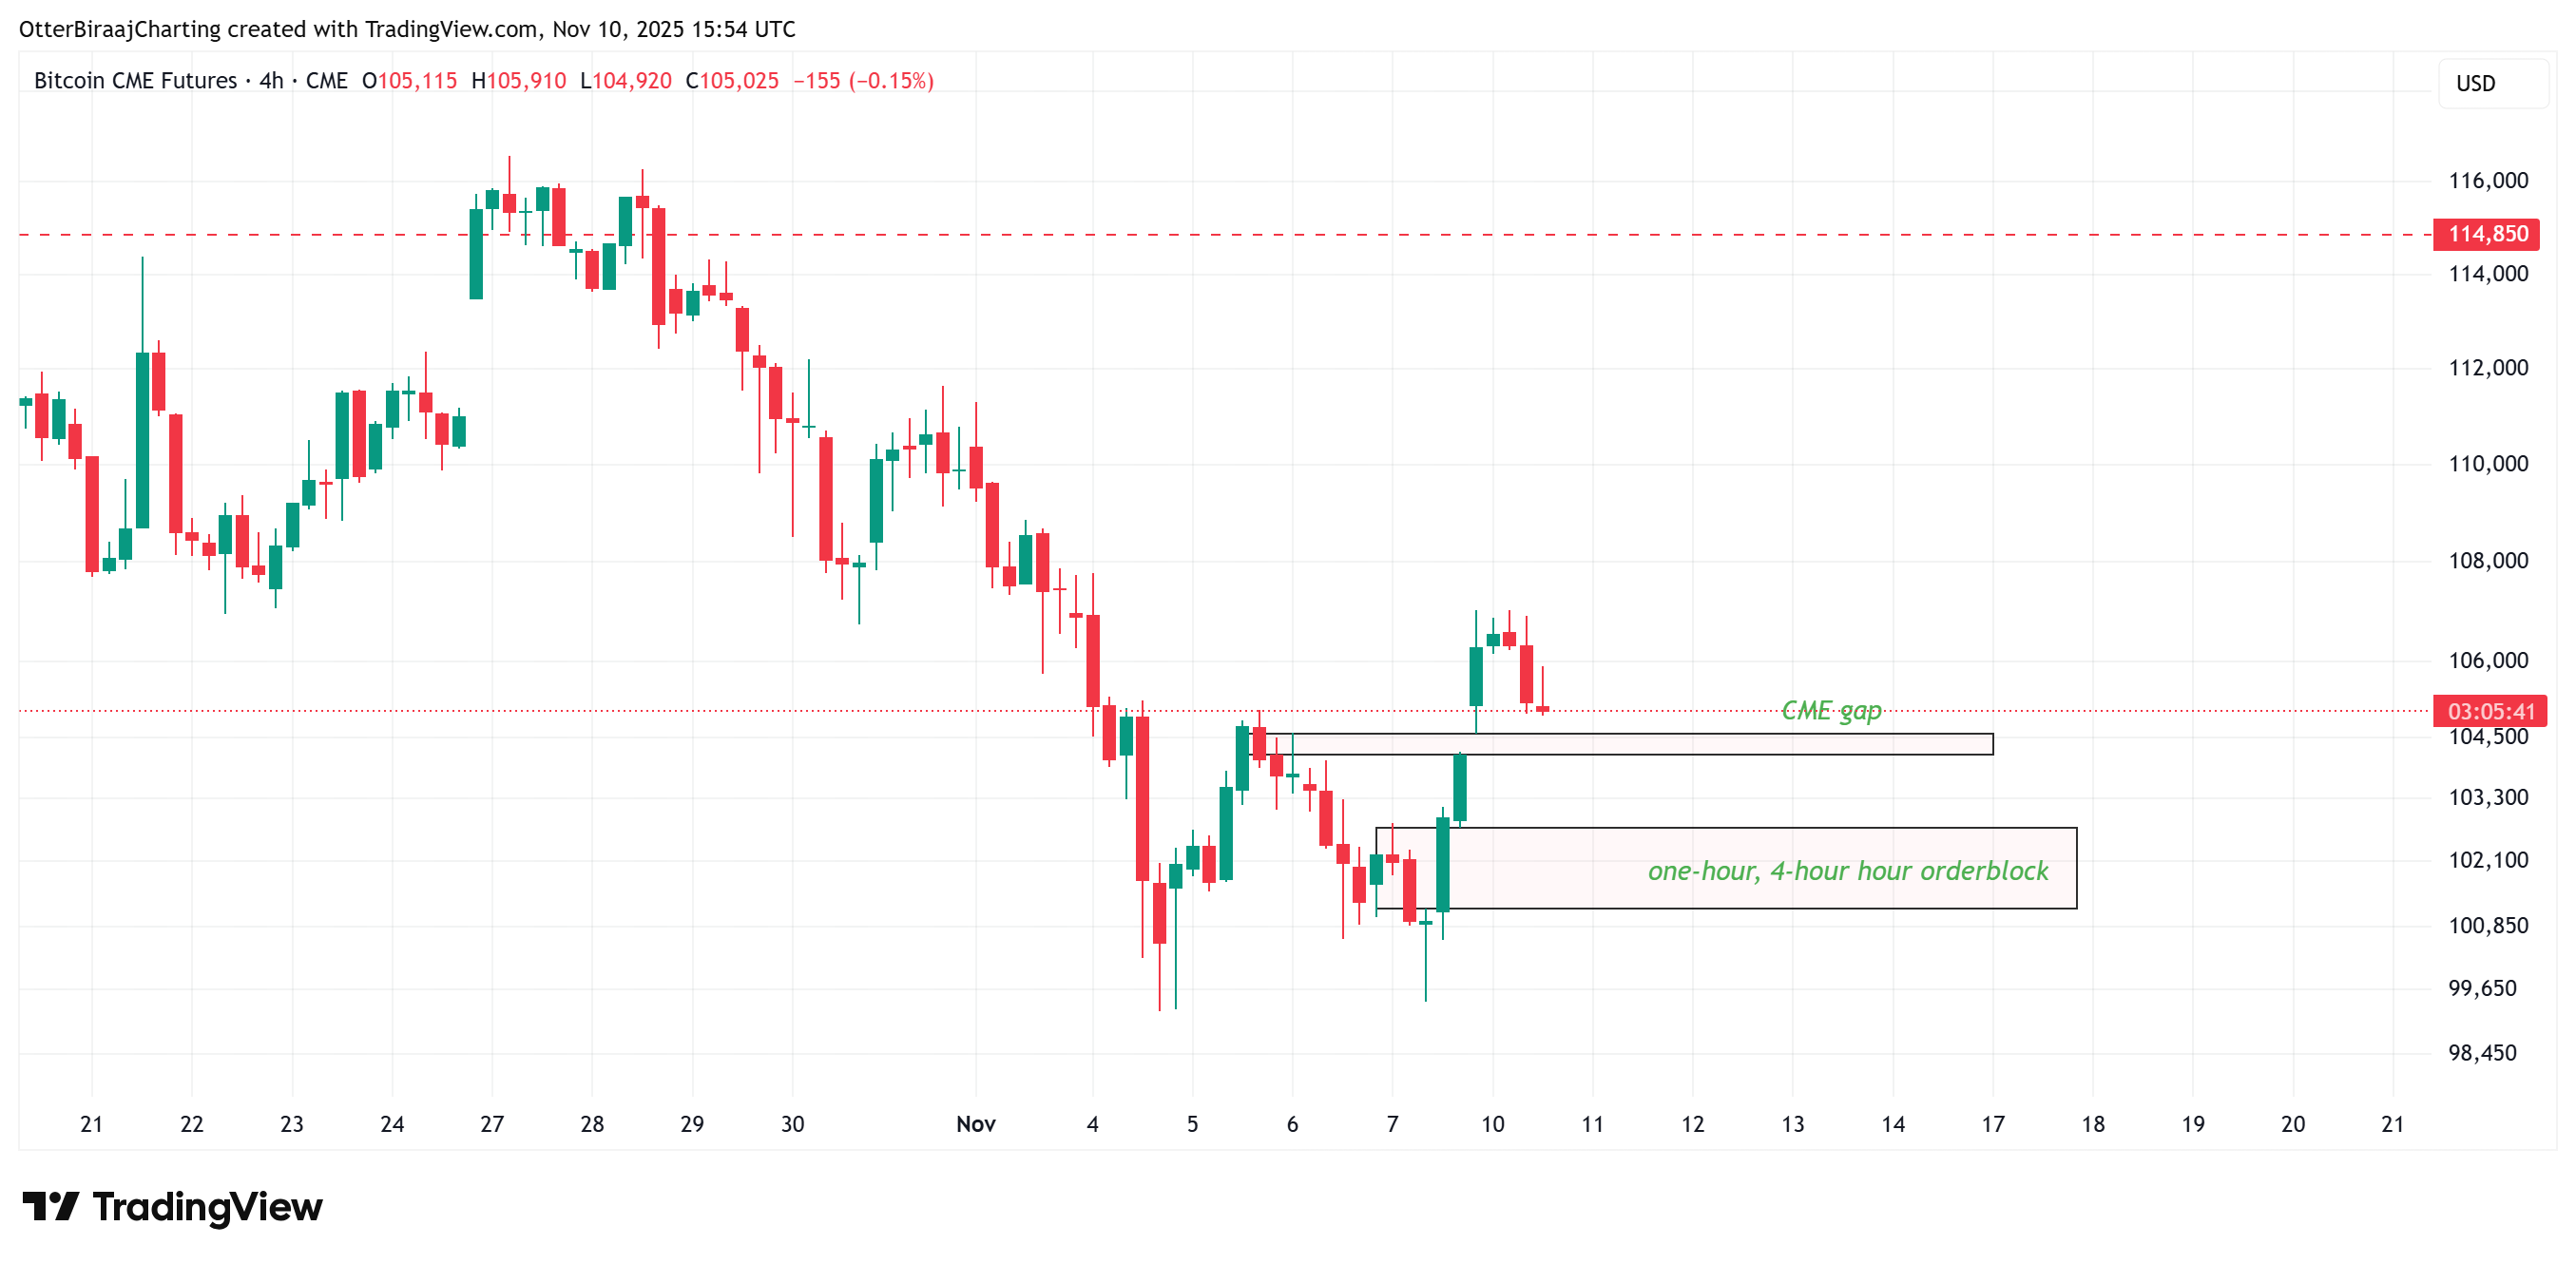 Bitcoin CME gap analysis. Source: Cointelegraph/TradingView
As liquidity dwindles, Bitcoin could possibly revisit the $101,000–$102,500 range, retesting earlier order blocks before making a definitive move upward.
CryptoQuant data has shown that the Stablecoin Supply Ratio (SSR) has plummeted to 13.1 from over 18 earlier this year, marking one of the year’s lowest points. This reduction indicates a rise in stablecoin reserves concerning Bitcoin’s market cap, hinting at liquidity accumulation waiting for a market catalyst.
Over the past month, the SSR slipped from 15 to 13 while BTC lingered around $105,000, suggesting buyers are biding their time until they receive confirmation for investment. Conversely, a 40% increase in short-term holder (STH) deposits to Binance has been observed, indicating increased selling pressure.
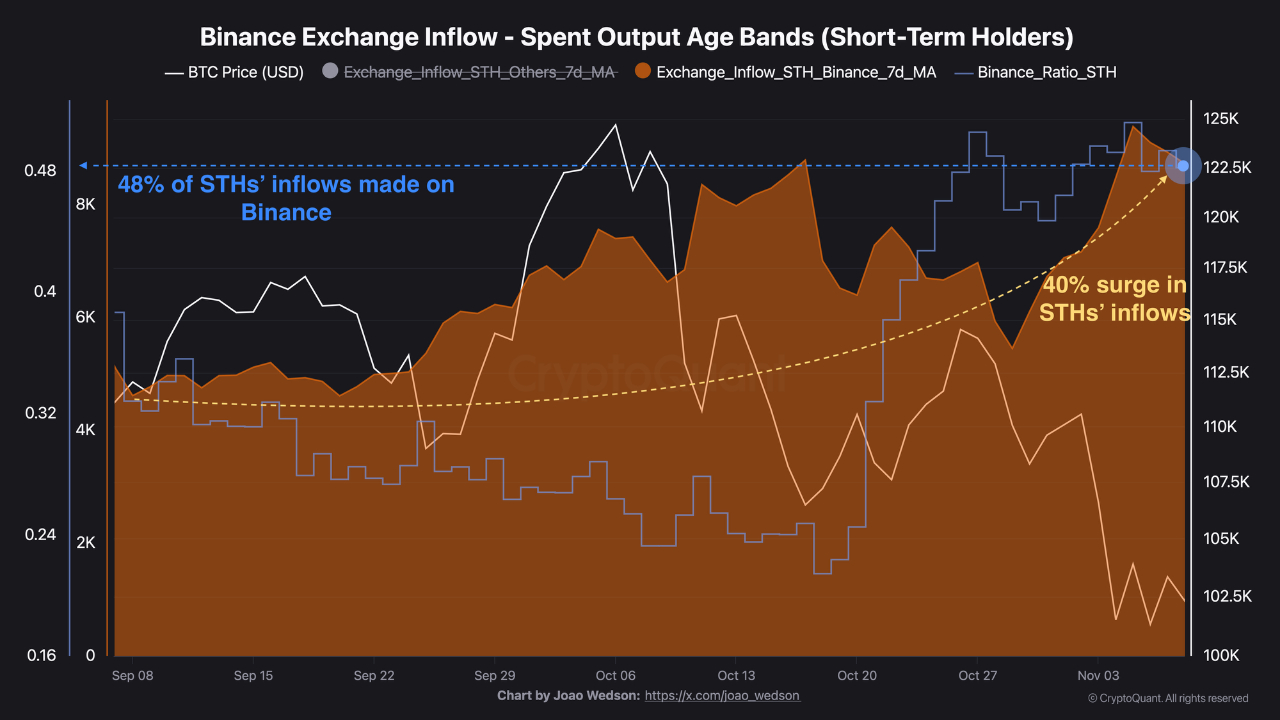 Bitcoin exchange inflow STH spent output age bands. Source: CryptoQuant
This report does not provide investment insights or suggestions. All investment actions involve risks and should be accompanied by individual research.
