Can Bitcoin Recover Following a Major 25% Drop from All-Time High?
Analyzing Bitcoin's recent price movement and potential recovery signals after a significant pullback.


Can Bitcoin Recover Following a Major 25% Drop from All-Time High?
Bitcoin is attempting to find stability around the $95,000 mark after a steep decline from its peak of $110,000. Despite the overarching bearish trend, indications of temporary support are emerging. A thorough breakdown of the market conditions, including analyses of daily charts, 4-hour timeframes, and important on-chain metrics, could shed light on potential future developments.
Technical Analysis
The Daily Chart
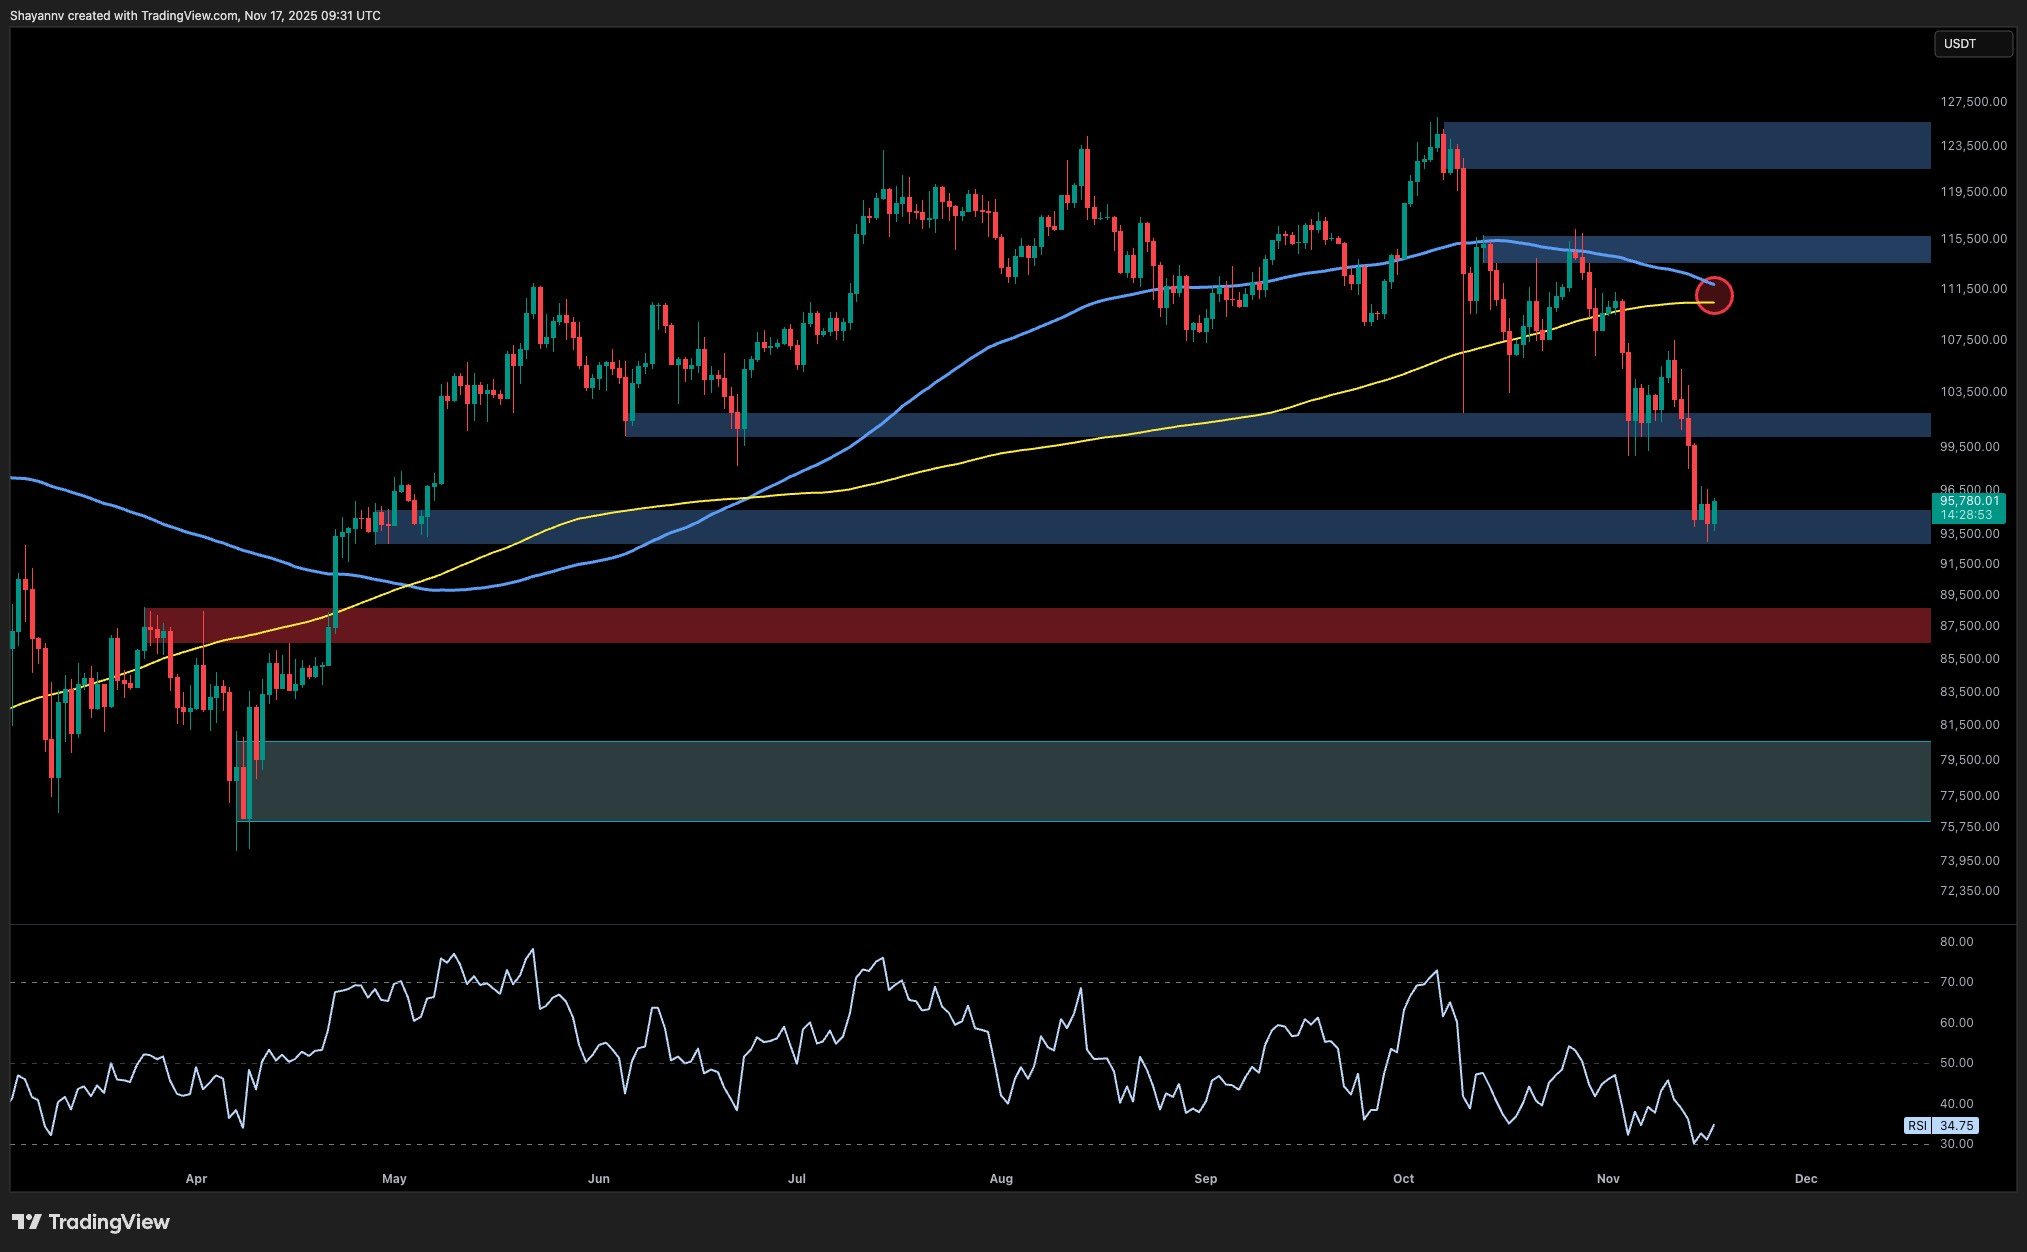
The daily analysis indicates a persistent bearish structure, highlighted by a bearish crossover between the 100-day and 200-day moving averages, with a death cross already established between the 50-day and 200-day averages.
These indicators have triggered a rapid descent into the $93,000 to $95,000 support zone, which acts as a short-term buying opportunity as bulls try to mount a response. The RSI is nearing oversold territory, currently just under 35, indicating a potential exhaustion in selling activity. However, the trend remains distinctly downward, characterized by lower highs.
To regain momentum, buyers must reclaim the $100K to $105K zone, converting it into support. Until such a shift occurs, price movements are likely to be constrained.
 Daily Chart
The 4-Hour Chart
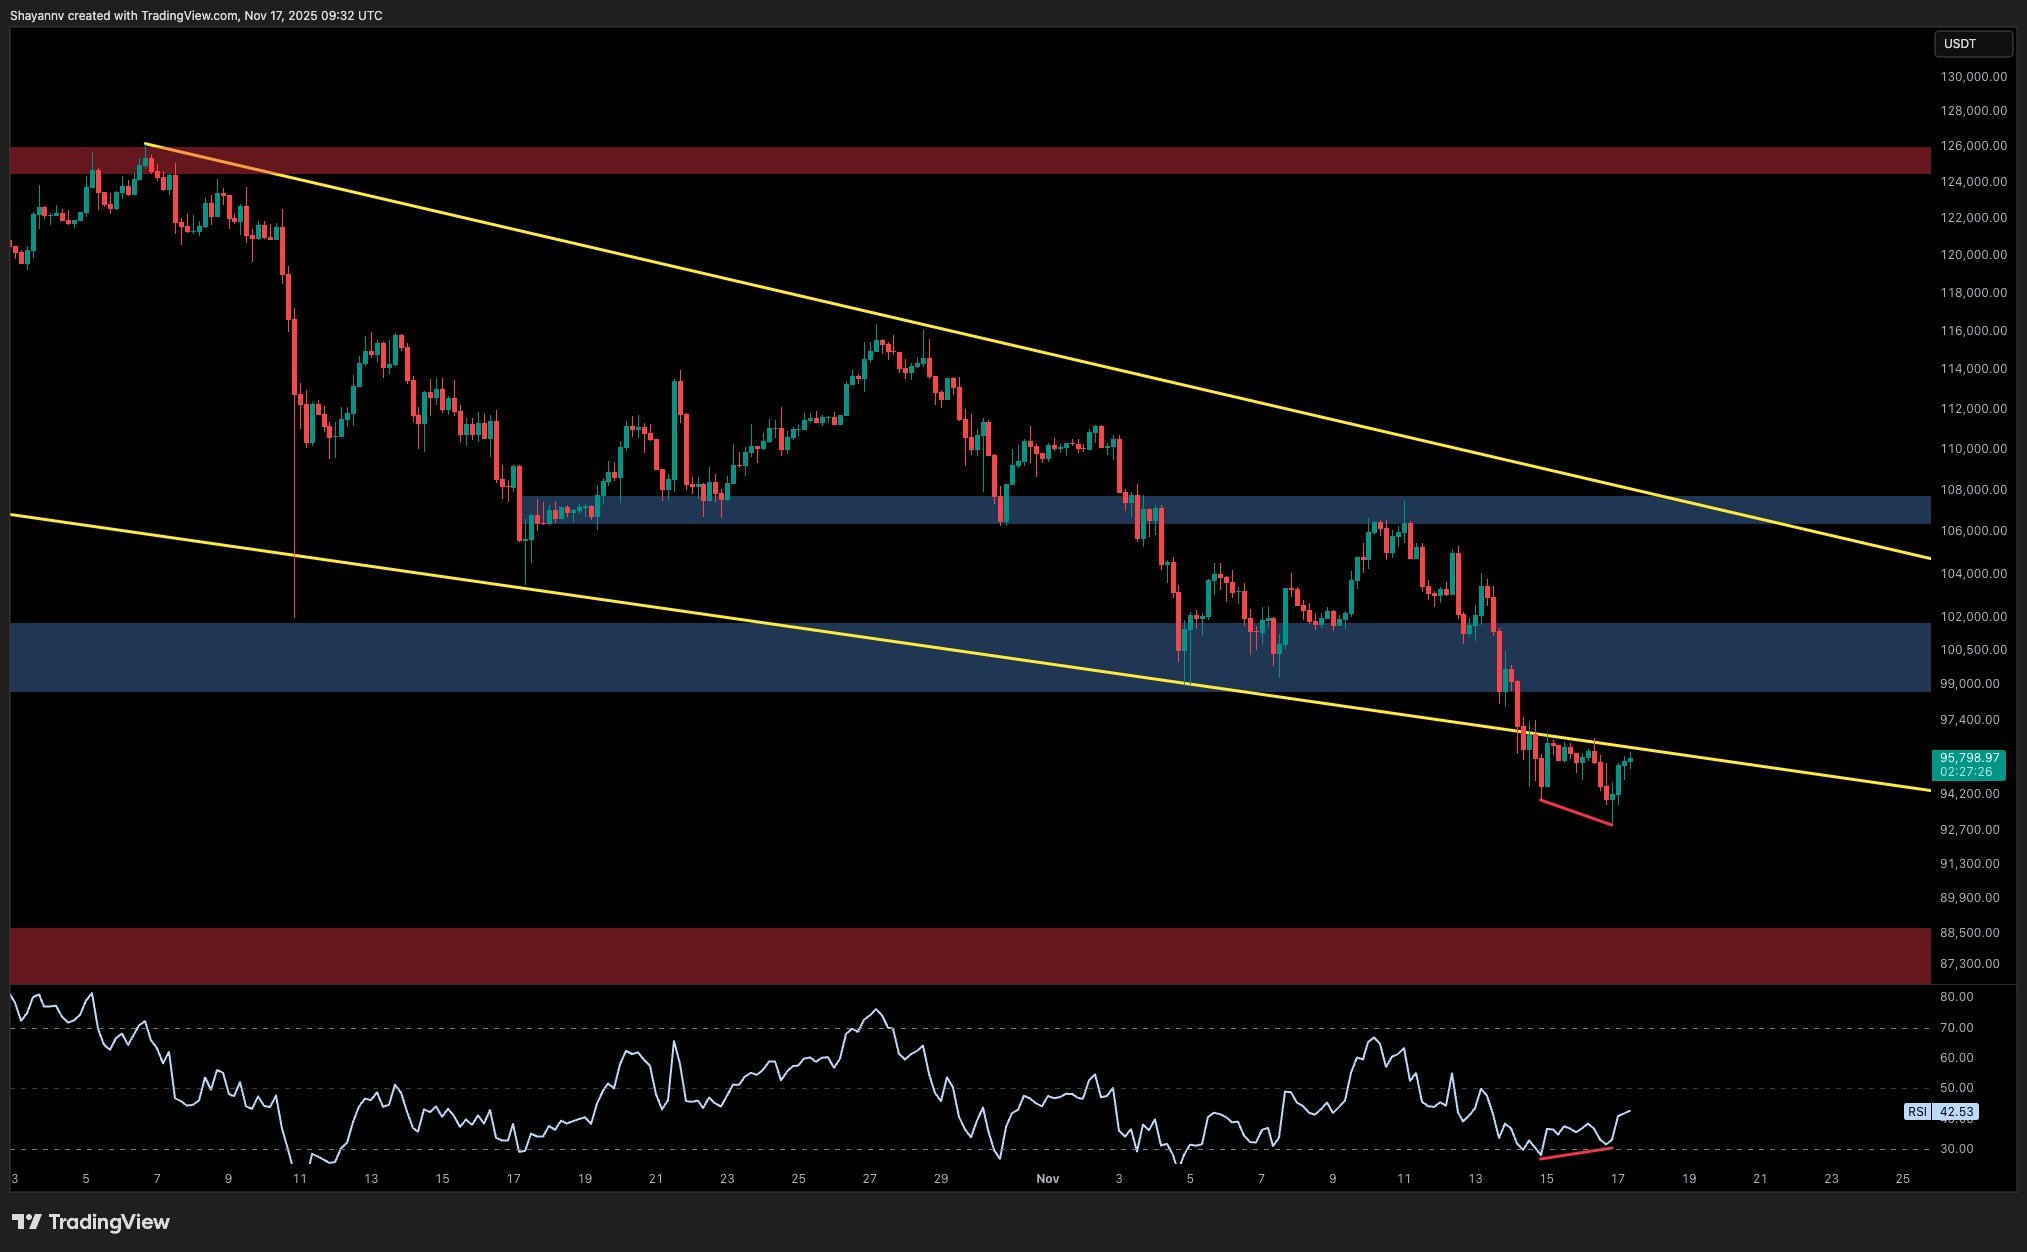
The 4-hour snapshot reveals a breakout and potential consolidation beneath a falling wedge pattern formed during the downtrend. The asset is currently testing the lower trendline around $96K, supported by a bullish divergence on the RSI, which might facilitate a price increase back into the wedge.
If buyers regain control at this level, a short-term surge towards $99K to $100K is possible before encountering heightened selling pressure. Yet, failing to uphold the $95K mark could lead to further declines to $90K or even $88K, a crucial support zone previously untouched this year.
 4-Hour Chart
On-Chain Analysis
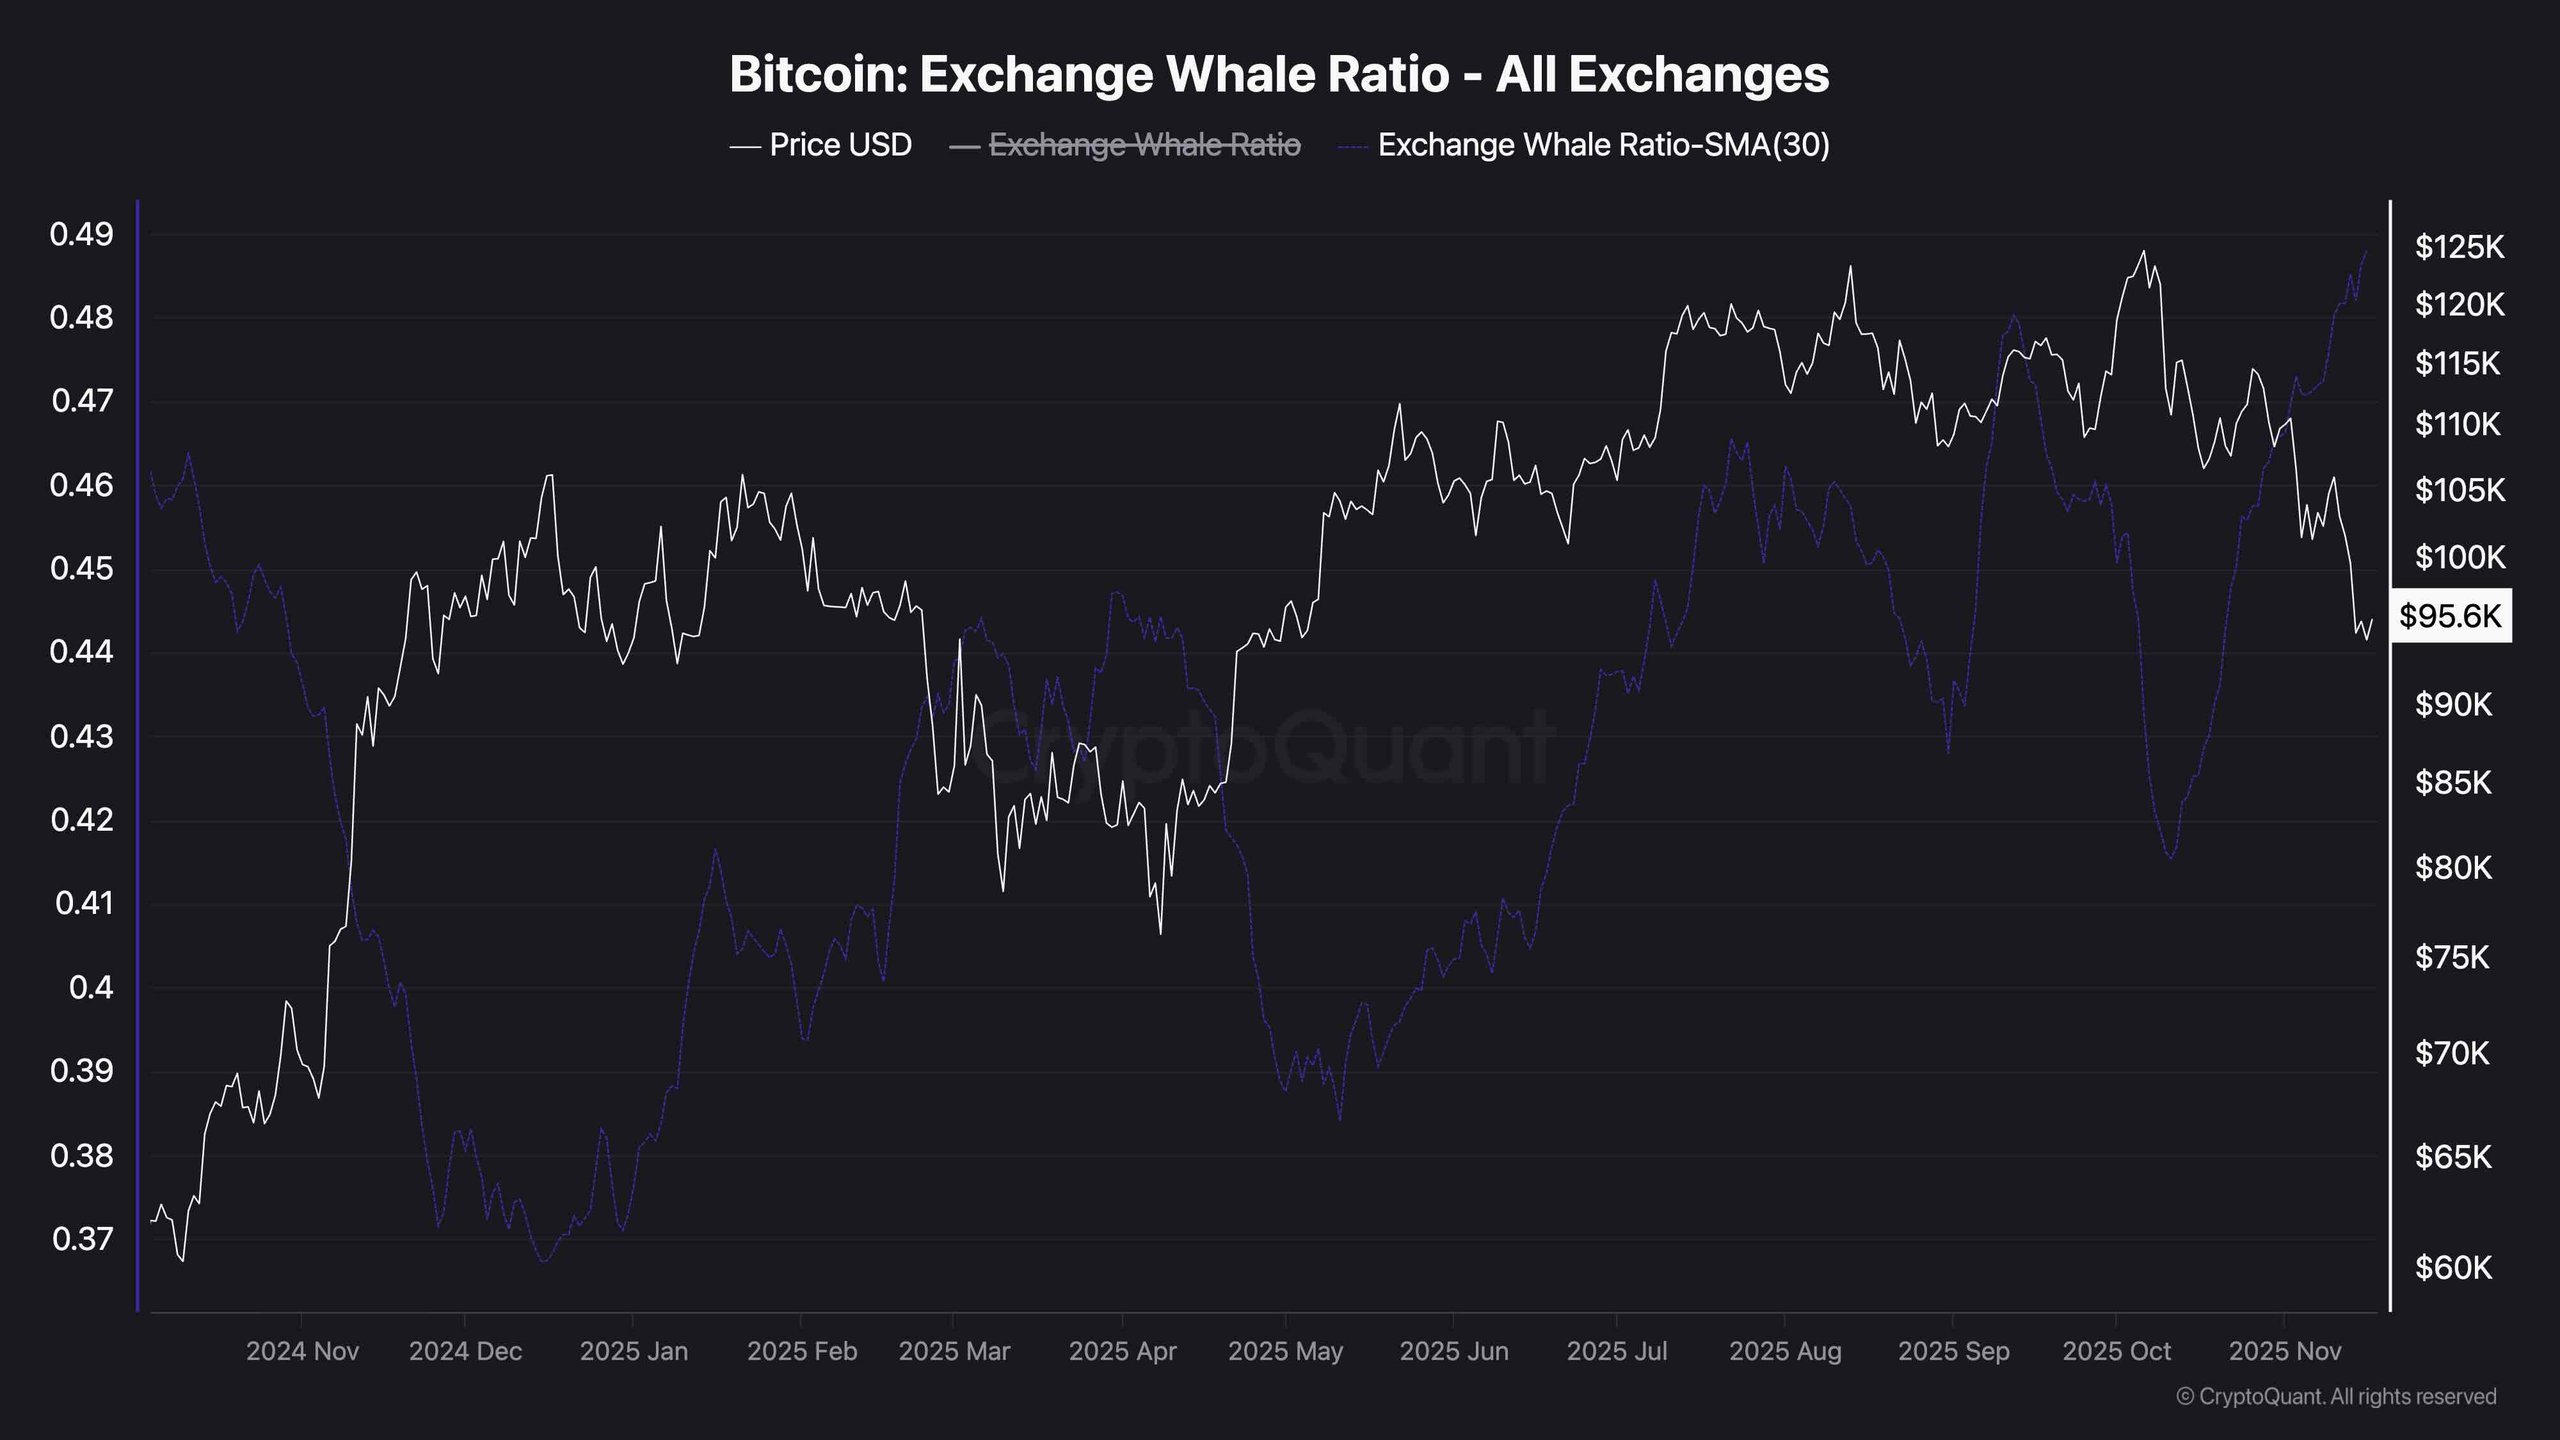
Exchange Whale Ratio (30-Day Moving Average)
The exchange whale ratio has recently risen, with the 30-day SMA surpassing 0.48, marking its highest point in several months. This trend indicates that large holders are increasingly influencing exchange inflows, which can often lead to market volatility or sell-offs.
Historically, spikes in this ratio have correlated with local price peaks or critical risk zones, especially when the market is under technical strain as it is presently. Should this trend persist, increased downside pressure from whale activities may follow, particularly if price resistance levels are not reclaimed swiftly.
Exchange Whale Ratio
Disclaimer: The views expressed here are those of the author indicated. They do not necessarily reflect the opinions of CryptoPotato as a whole regarding investment advice. Readers are always encouraged to conduct their own research when making investment decisions.
