Ethereum's 45% Decline Paves the Way for Significant Gains Ahead
After a steep decline from its peak, Ethereum has hit a crucial support level, sparking anticipation for potential gains if this level holds.


Ethereum (ETH) is currently trading below $2,700 after a significant decline from its August 2025 peak of around $4,950. This correction, which has exceeded 45%, has brought the cryptocurrency to critical technical zones that analysts believe could facilitate a market recovery. Many traders have modified their market perspectives, now anticipating a prolonged cycle with higher upside forecasts.
Daily trading volume is at $50.3 billion. Ethereum’s price has dropped 10% in the last 24 hours and nearly 15% over the past week, landing in regions where previous buying interest was notably robust.
Structure Shifts to Wave 2
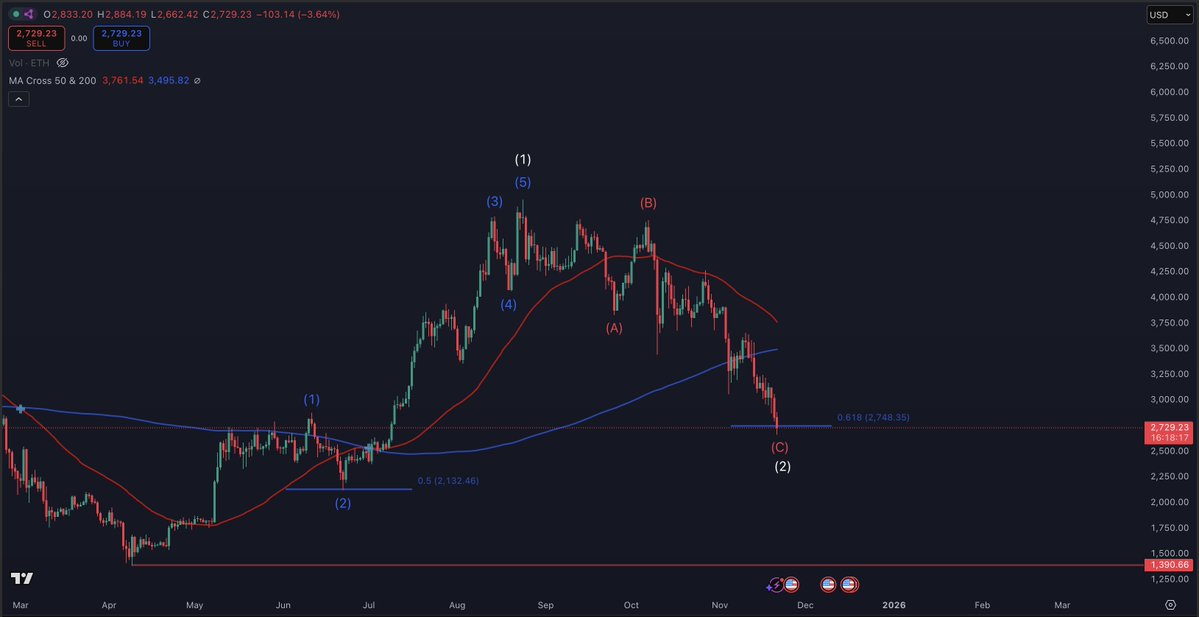
StockTrader_Max posted an updated Elliott Wave analysis indicating that ETH has transitioned into its prior Wave 1 range. This transition negates a potential Wave 4 correction and suggests that a Wave 2 retracement is currently in progress, a common occurrence earlier in market cycles.
“ETH is already at the 0.618 FIB… this is an area where I expect to see a low form,” the analyst noted.
Noteworthy is that the 0.618 retracement level is approximately $2,748, commonly acting as support during trending markets. According to this analysis, the next movement — Wave 3 — might aim for $8,800, a revision from the earlier target of $6,000 for the conclusion of Wave 5.
Ethereum Chart
Source: StockTrader_Max/X
Price Approaching Major Support Zone
Bleeding Crypto shared a chart that illustrates ETH within a broad Fibonacci support zone. This region includes the 0.618 level at $2,748, the 0.706 level at $2,433, and the 0.786 level at $2,147, zones that align with a price range where ETH previously traded sideways earlier this year. The recent drop has returned ETH to this prior consolidation range, which historically has provided support. Although the correction is considerable, it remains consistent with patterns observed in previous cycles. If ETH sustains within this range, it may establish a base for forthcoming market movements.
Furthermore, Ash Crypto posted that Ethereum has closed a CME gap on the daily chart that remained open for about four months, within the price span of $2,850 to $3,000.
“Most CME gaps are filled before a significant move,” the statement highlighted.
In the meantime, certain traders regard this as a typical technical step often completed before a trend change. Currently, the price resides in a critical area, making monitoring volume and market structure essential in the upcoming sessions.
$2,800 Shifts from Support to Resistance
Ted observed that ETH has decreased below $2,800, reaching as low as $2,650.
“If ETH doesn’t reclaim the $2,800 level soon, expect a drop towards the $2,500 level,” he remarked.
This zone also coincides with the realized prices of various wallet groups, which reinforces its significance as a key level. Maintaining this range might indicate a short-term bottom, while failure to do so keeps lower targets in sight.
