
Bitcoin's Rapid Decline Might Hint at a Favorable Year-End for BTC
A recent plunge in Bitcoin prices raises concerns among traders, yet historical data on various indicators may signal an impending upward shift for BTC.


Bitcoin ( BTC ) dropped to $80,600 on Friday, marking a more than 10% decline for the week. This monthly downturn has reached 23%, making it the most significant dip since June 2022. The price drop below $84,000 also led Bitcoin to test the 100-week exponential moving average for the first time since October 2023, coinciding with the beginning of the current bull cycle.
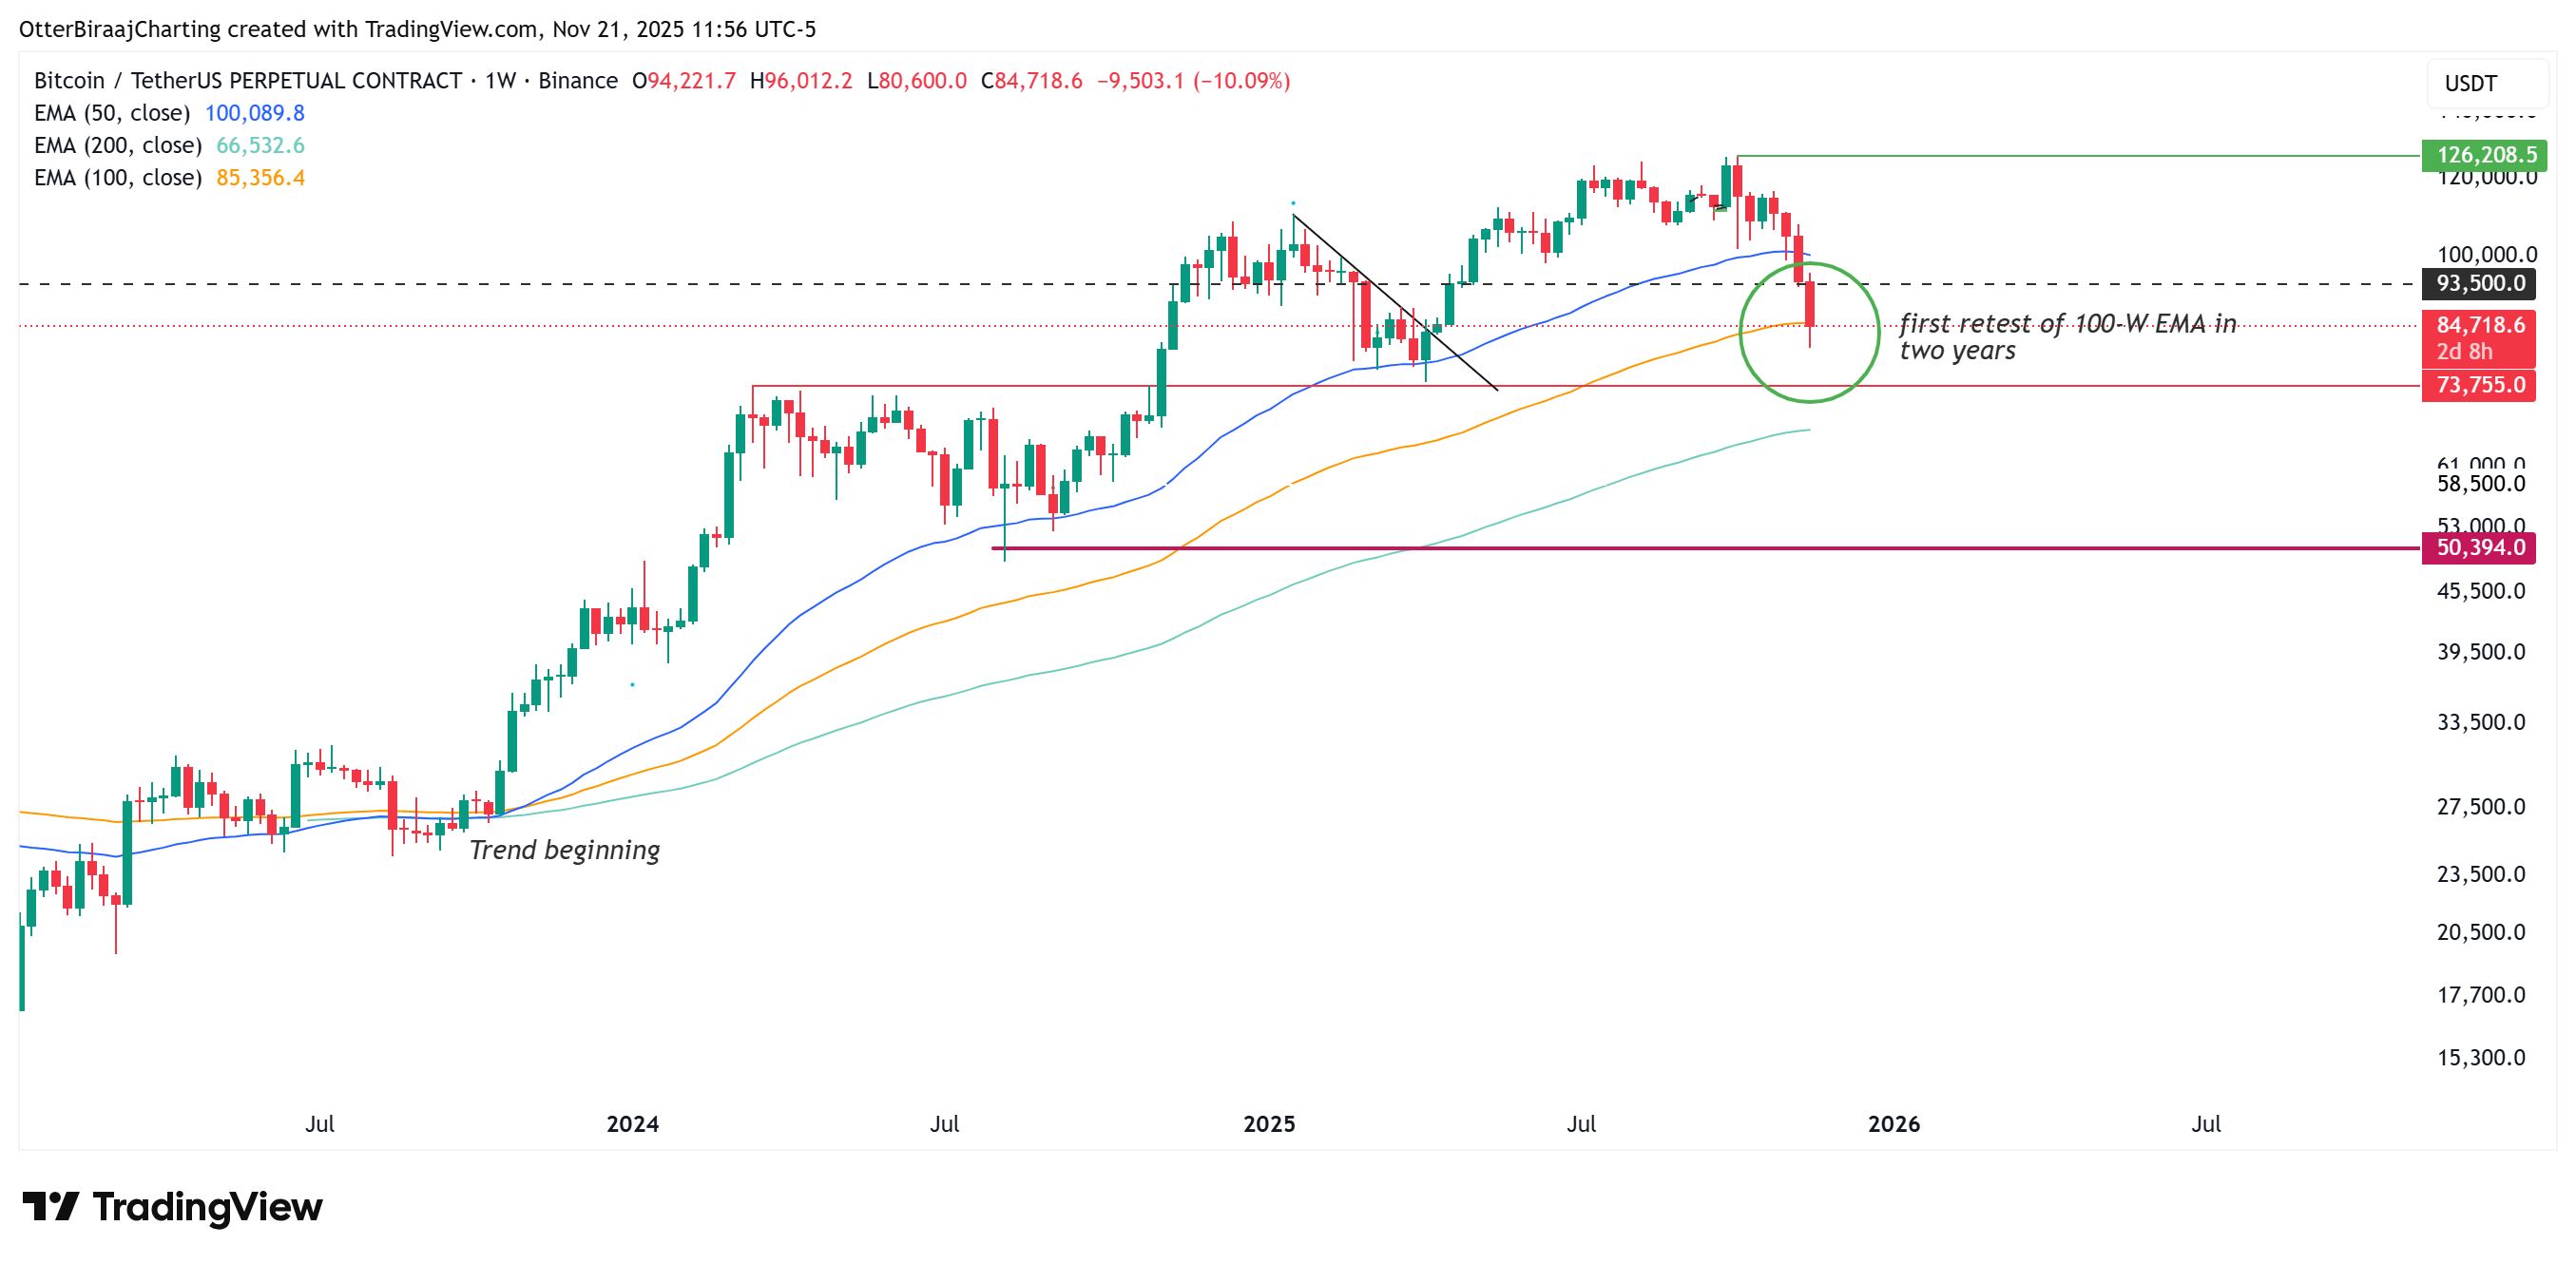 Bitcoin one-week analysis. Source: Cointelegraph/TradingView
Bitcoin futures liquidations exceeded $1 billion, highlighting the magnitude of the downturn, which the Kobeissi Letter termed as the “fastest bear market ever.”
Key takeaways:
- The crypto market’s total capital has decreased by 33% since October, resulting in a swift structural retreat.
- A historic net outflow of funds coupled with negative ETF activity indicates ongoing institutional selling.
- A crucial macroeconomic liquidity indicator (NFCI) is trending downward which often precedes BTC rallies by four to six weeks.
Crypto market cap collapses as “structural” selling accelerates
Since October 6, the total value of the crypto market has plummeted from $4.2 trillion to $2.8 trillion, representing a 33% decline. The Kobeissi Letter characterized this as “one of the fastest-moving crypto bear markets ever,” with selling pressures intensifying across all major sectors. The newsletter stated that digital asset investment products are exhibiting similar stress, recording $2 billion in weekly outflows—the largest since February.
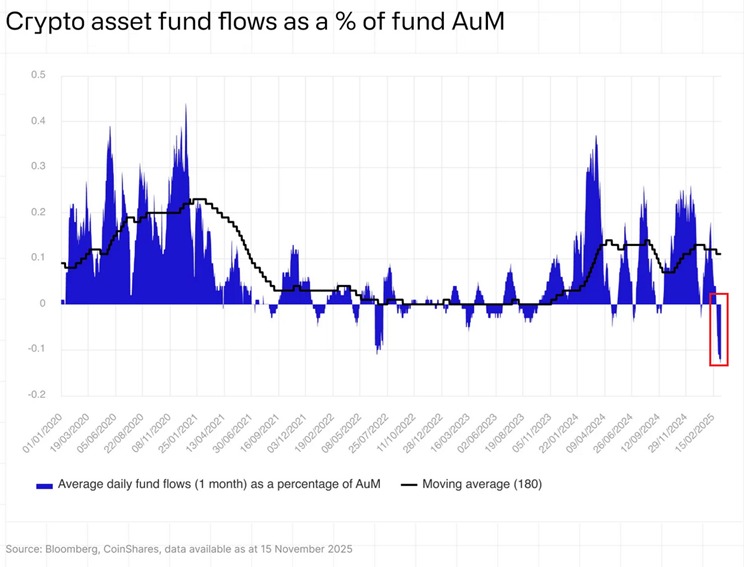 Crypto asset fund flows as a percentage of fund AUM. Source: Kobeissi letter/X
This marks a third consecutive week of net selling, culminating in total outflows of $3.2 billion during this timeframe. Bitcoin has seen the most significant withdrawals, amounting to $1.4 billion, while Ether followed with $689 million—some of the largest weekly losses for either asset in 2025.
Average daily outflows surpassing assets under management (AUM) reached unprecedented levels, pulling total AUM down to $191 billion, a fall of 27% since October. Analysts interpret this as a pronounced structural decline rather than short-lived anxiety.
ETF flows on U.S. markets exacerbate this pressure. Spot BTC ETF inflows remain negative, reinforcing sell-off dynamics. Meanwhile, BlackRock’s spot ETF is on track for its largest weekly outflow ever, potentially exceeding the previous record of $1.17 billion set in February.
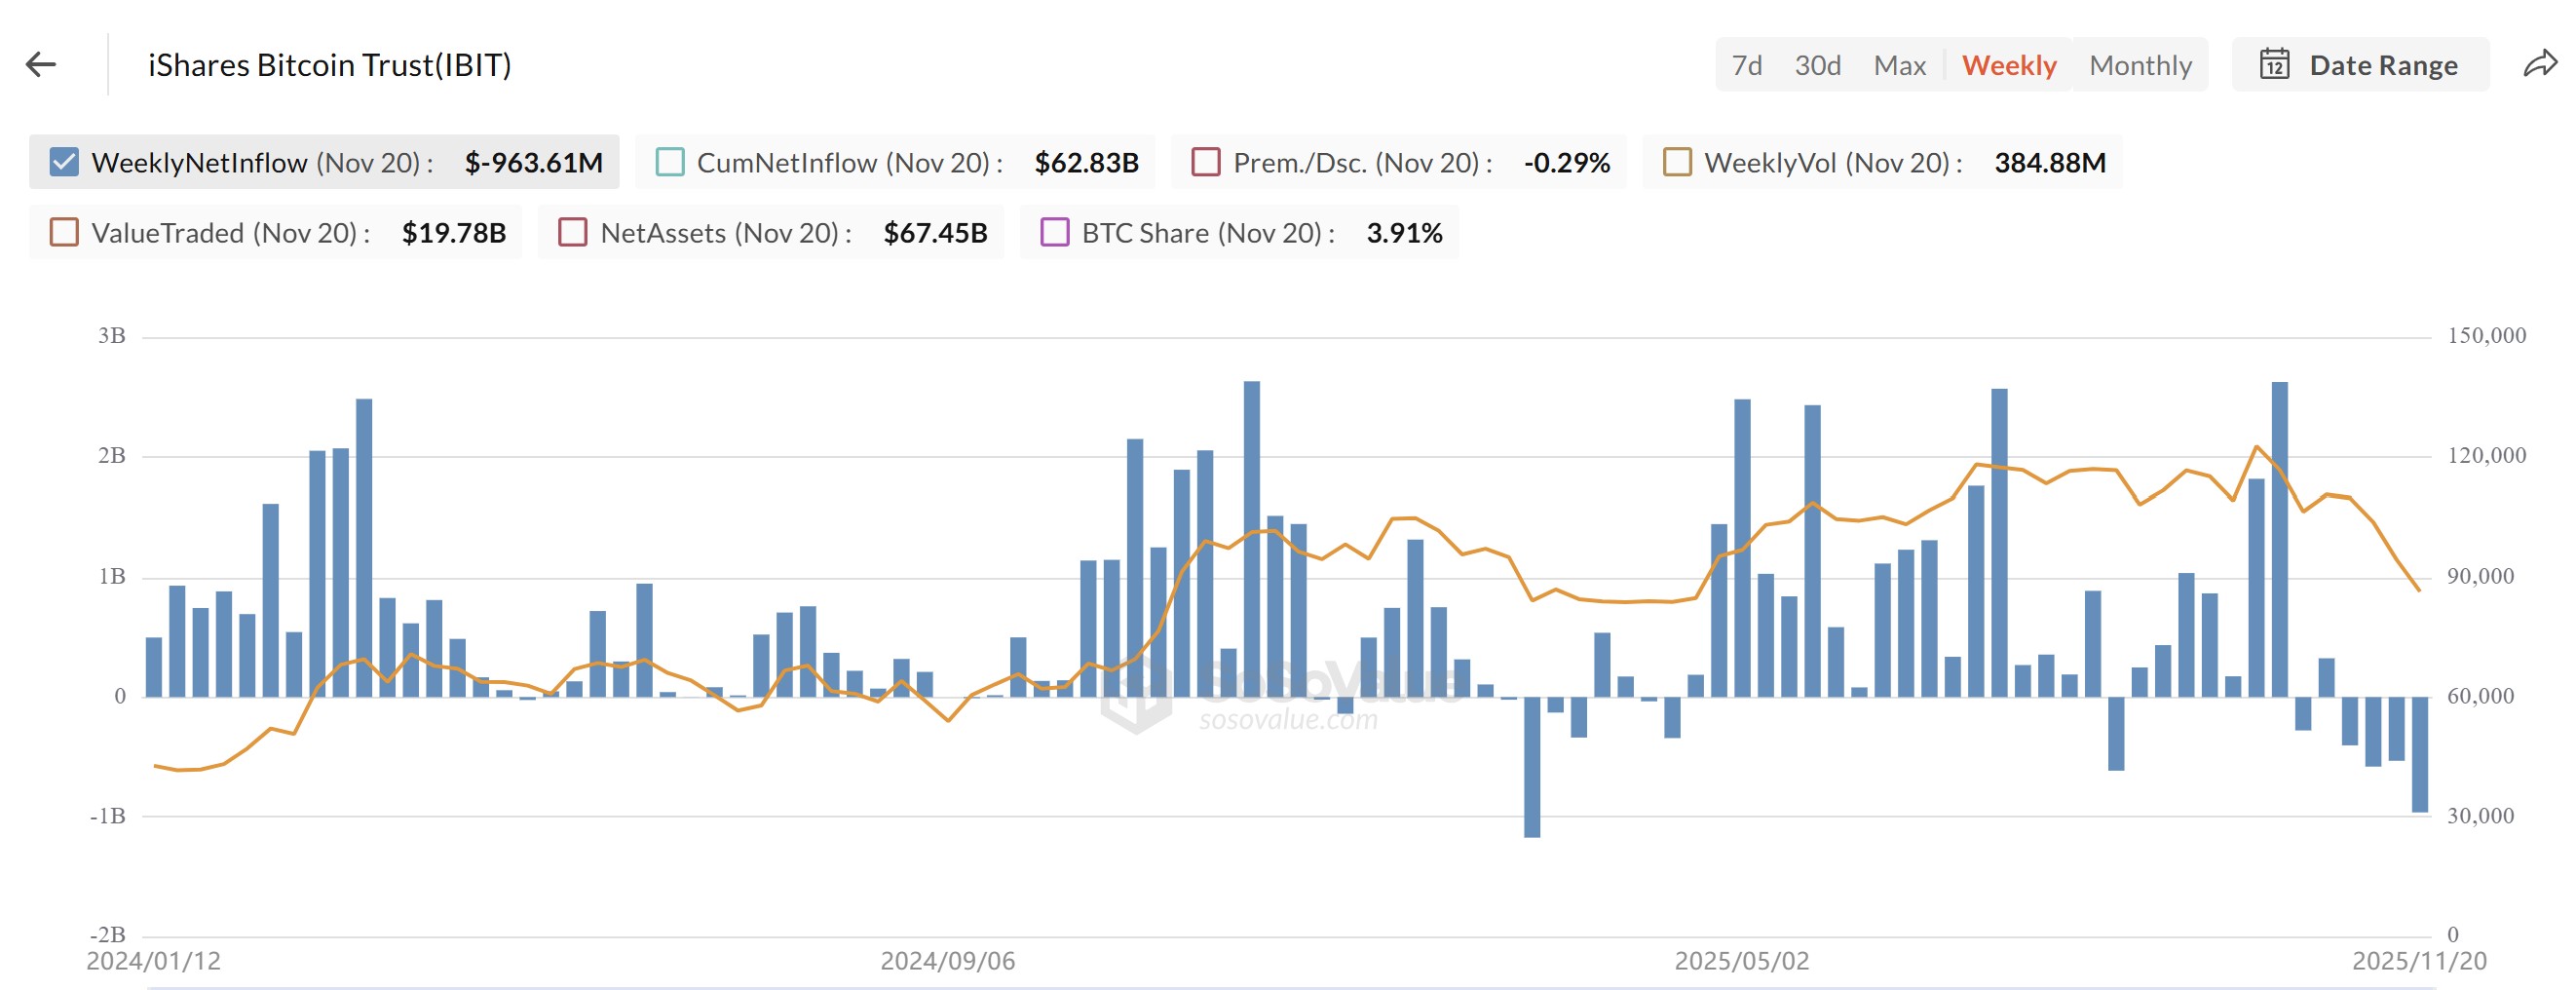 iShares Bitcoin Trust weekly netflows. Source: SoSoValue
Related: Bitcoin slump to $86K brings BTC closer to ‘max pain’ but great ‘discount’ zone
A macroeconomic shift could give Bitcoin a liquidity lead
While various analysts continue to predict a bottom for Bitcoin based on technical charts and on-chain data, Miad Kasravi explored a different methodology. Kasravi conducted a decade-long backtest of 105 financial indicators, revealing that the National Financial Conditions Index (NFCI) is among the few metrics that reliably anticipates Bitcoin trends by four to six weeks during significant macroeconomic regime shifts.

This pattern was clear in October 2022, when easing financial conditions preceded a revolutionary 94% Bitcoin rally, and again in July 2024 when tightening conditions signaled stress prior to Bitcoin’s surge from $50,000 to $107,000.
Presently, NFCI is at -0.52 and shows a downward trend. Historically, a decrease of 0.10 points in the index has aligned with a corresponding 15%-20% increase in Bitcoin’s value, with a more significant move towards -0.60 usually indicating an acceleration phase. December could present a critical catalyst as the Federal Reserve intends to rotate mortgage-backed securities into Treasury bills. Kasravi pointed out that while this measure may not officially be labeled as Quantitative Easing (QE), it holds the potential to inject liquidity akin to the 2019 “not-QE” event that preceded a 40% Bitcoin surge.
Should NFCI continue its decline into mid-December, it would imply the onset of a new liquidity expansion window. Given the index’s previous consistent four-to-six week lead time during past regime shifts, Bitcoin’s next major cyclical movement could coincide with early to mid-December 2025, offering significant opportunities for market participants monitoring macroeconomic conditions.
Related: Bitcoin realized losses rise to FTX crash levels: Where is the bottom?
This article does not include financial advice or recommendations. Every investment involves risk, and readers are encouraged to conduct their own research when making decisions.
