XRP Approaches Key EMA Levels: Is a Breakout Imminent or a Bearish Trap?
XRP is trading just above $2.06 as bullish signs emerge. Traders are closely watching key support levels and an upcoming ETF launch for potential market direction.


XRP is trading near a critical level as traders determine whether the current market conditions indicate a reversal or a breakout. Key chart signals, indicators, and price zones are being closely monitored.
As of now, Ripple’s token is priced at $2.06, with a 24-hour trading volume of $4.13 billion. It has risen nearly 2% in the last day but has decreased 9% over the past week.
EMA Structure Remains Strong
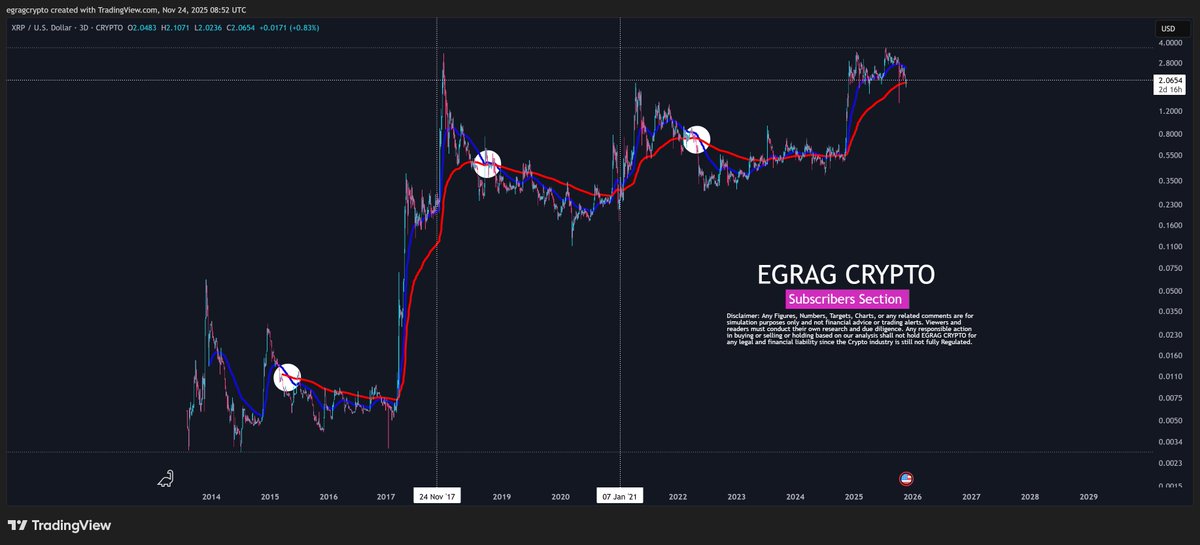
Analyst Egrag Crypto has pointed out that XRP’s 50 EMA is approaching a crossing point with the 200 EMA on the 3-day chart. While this pattern is typically associated with bearish trends, he believes the current conditions do not indicate that. The asset continues to trade above the rising 200 EMA. According to Egrag,
“This does NOT match a classic bear-market setup.”
(Translation: This does not align with a traditional bear market configuration.)
Egrag has drawn parallels between the current conditions and previous surges in 2017 and early 2021, where similar EMA compressions resulted in substantial rallies. Back then, prices remained above key support levels before notable upward movements occurred. It appears that XRP could be undergoing late-stage consolidation instead of experiencing a breakdown.
XRP Chart
Image Source: Egrag Crypto/X
Strength in XRP/ETH Chart
Additionally, analyst JD shared a 2-week chart for the XRP/ETH pair, indicating that the Stochastic RSI remains above 20, and the RSI line is positioned above its moving average. These conditions previously preceded a 12x rally in earlier cycles.
“Last time both confirmed, we went from 0.28 to $3.37,” JD stated.
(Translation: The last time both indicators validated, we experienced a rise from 0.28 to $3.37.)
The chart also displays hidden bullish divergence: while prices formed higher lows, the oscillator shows lower lows, suggesting inherent strength. The horizontal support levels remain intact, supporting a potential breakout if current signals persist.
As CryptoPotato recently reported, the TD Sequential indicator has just issued a buy signal for XRP, tailored to catch trend reversals or exhaustion. This signal comes after a sharp correction, implying that selling pressure may be diminishing.
Daily and Intraday Movements Emphasize $2.08
CryptoWZRD noted that XRP’s daily candle posted a bullish close, maintaining a price above $2.08, which is vital for the next target nearing $2.277. Progressing beyond that could lead towards $2.75.
Moreover, the introduction of Grayscale’s GXRP ETF on NYSE Arca has garnered additional focus on XRP, potentially drawing more liquidity and institutional participation, which might influence future market dynamics.
