Monitoring Bitcoin's (BTC) Breakout: A Stronghold at a Crucial Trendline
Bitcoin maintains its position above a significant four-year trendline as pressure from sellers decreases while whales gather assets, with analysts eyeing critical resistance points.


Bitcoin is currently positioned above a long-term trendline that has dictated its price behavior for the last four years. This line, which once served as a resistance, is now being affirmed as support following a confirmed weekly candle closure above it.
Long-Term Support Maintained After Weekly Closure
A chart provided by Ash Crypto reveals that Bitcoin is maintaining its position above a rising trendline established since 2021, which has previously rejected prices on three occasions over the past three years. Now, Bitcoin trading above this line indicates it is acting as support.
“The weekly candle closed above the 4-year Trend Key level. BTC is positioned right on the macro long-term trendline that has sustained the market for four years. This level, having served as significant resistance three times in three years, is now a robust support.” — Ash Crypto @AshCrypto November 24, 2025
Ash Crypto also emphasized that as long as BTC remains above this trendline, the long-term forecast remains optimistic.
While the weekly charts indicate strength, daily readings suggest otherwise. According to Titan of Crypto, BTC is testing the Tenkan-sen level on the Ichimoku chart, which has constrained price movements recently around the $82,000 range.
Titan pointed out that a clean closure above it is crucial to accessing higher levels. Until then, Bitcoin’s price may stay within a restrictive range. However, if it surpasses the Tenkan-sen, it could lead towards the Kijun-sen and possibly the lower confines of the Ichimoku cloud.
Decrease in Selling Activity
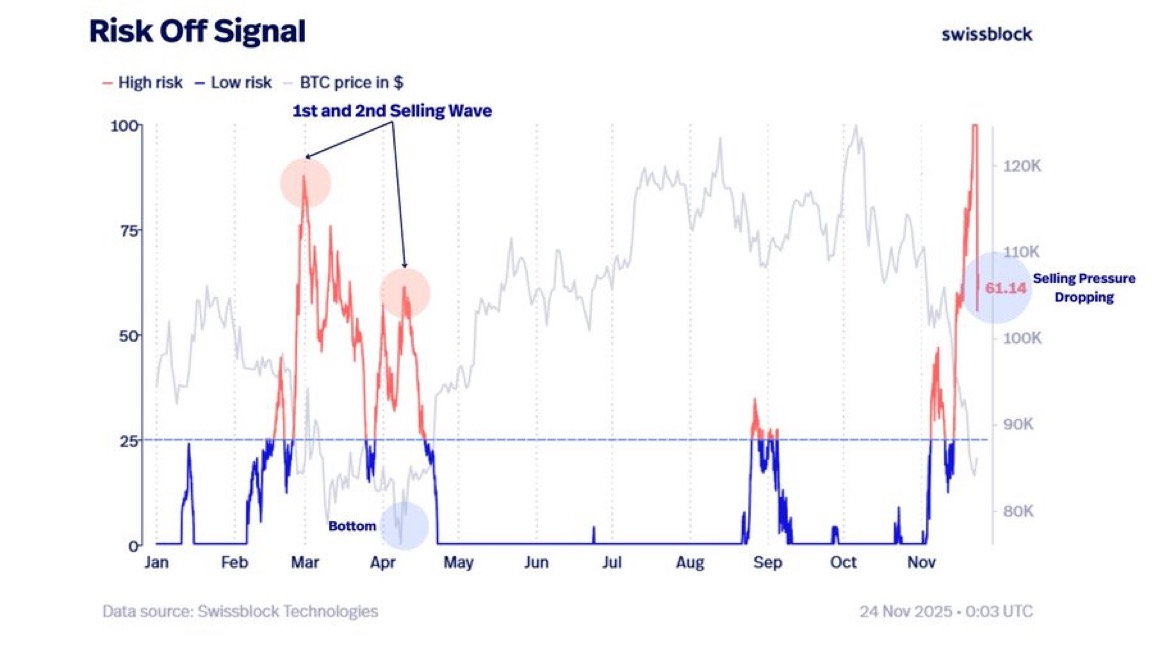
A chart from Swissblock Technologies highlights a Risk Off Signal that peaked during the recent downturn but has since dropped from above 90 to around 61. This trend indicates a reduction in the aggressive selling that previously occurred. The chart also indicates earlier spikes in March and April, succeeded by a low-risk phase.
You May Also Like:
- Big Bitcoin (BTC) Whales Surge as Small Holders Vanish Amid Short-Term Recovery Attempts
- Bitcoin Targets $96K-$99K Recovery as Indices Signal Reversal
- Bitcoin Logs 4th Straight Negative Week as Corrective Phase Extends: Bitfinex Alpha
 Bitcoin Analysis
Source: That Martini Guy/X
Bitcoin Analysis
Source: That Martini Guy/X
Indicators of decreased risk suggest the market may be forming a local bottom, with That Martini Guy commenting:
“Bitcoin selling pressure is easing. BTC is beginning to find a bottom as fear subsides.”
Changes in risk levels commonly manifest towards the end of significant correction phases.
Whale Accumulation Amid Retail Exit
Data from Santiment indicates that the count of wallets holding at least 100 BTC has increased by 91 since November 11, contrasting with a decrease in smaller wallets. This suggests retail investors are withdrawing. Additionally, some seasoned wallets have recently moved coins, with long-term holders reducing their positions.
“Retail capitulation generally favors long-term crypto prices,” Santiment observed.
While this could indicate a market bottom, it also reflects mixed actions among major holders as Bitcoin navigates a turbulent phase.
Tags: Bitcoin (BTC) Price
