XRP Price Surge: Is a Bullish Trend Emerging?
XRP has shown signs of recovery after a significant selloff, with key resistance levels determining its future trajectory.


Ripple’s XRP has experienced its first substantial rebound following an extended decline, managing to recapture the $2.10–$2.20 range. Despite this recent uptick, the overall downward trend remains unaltered, with the current resistance level crucial in determining if this movement is a mere correction or the start of a prolonged recovery.
XRP Price Evaluation
The Daily Chart
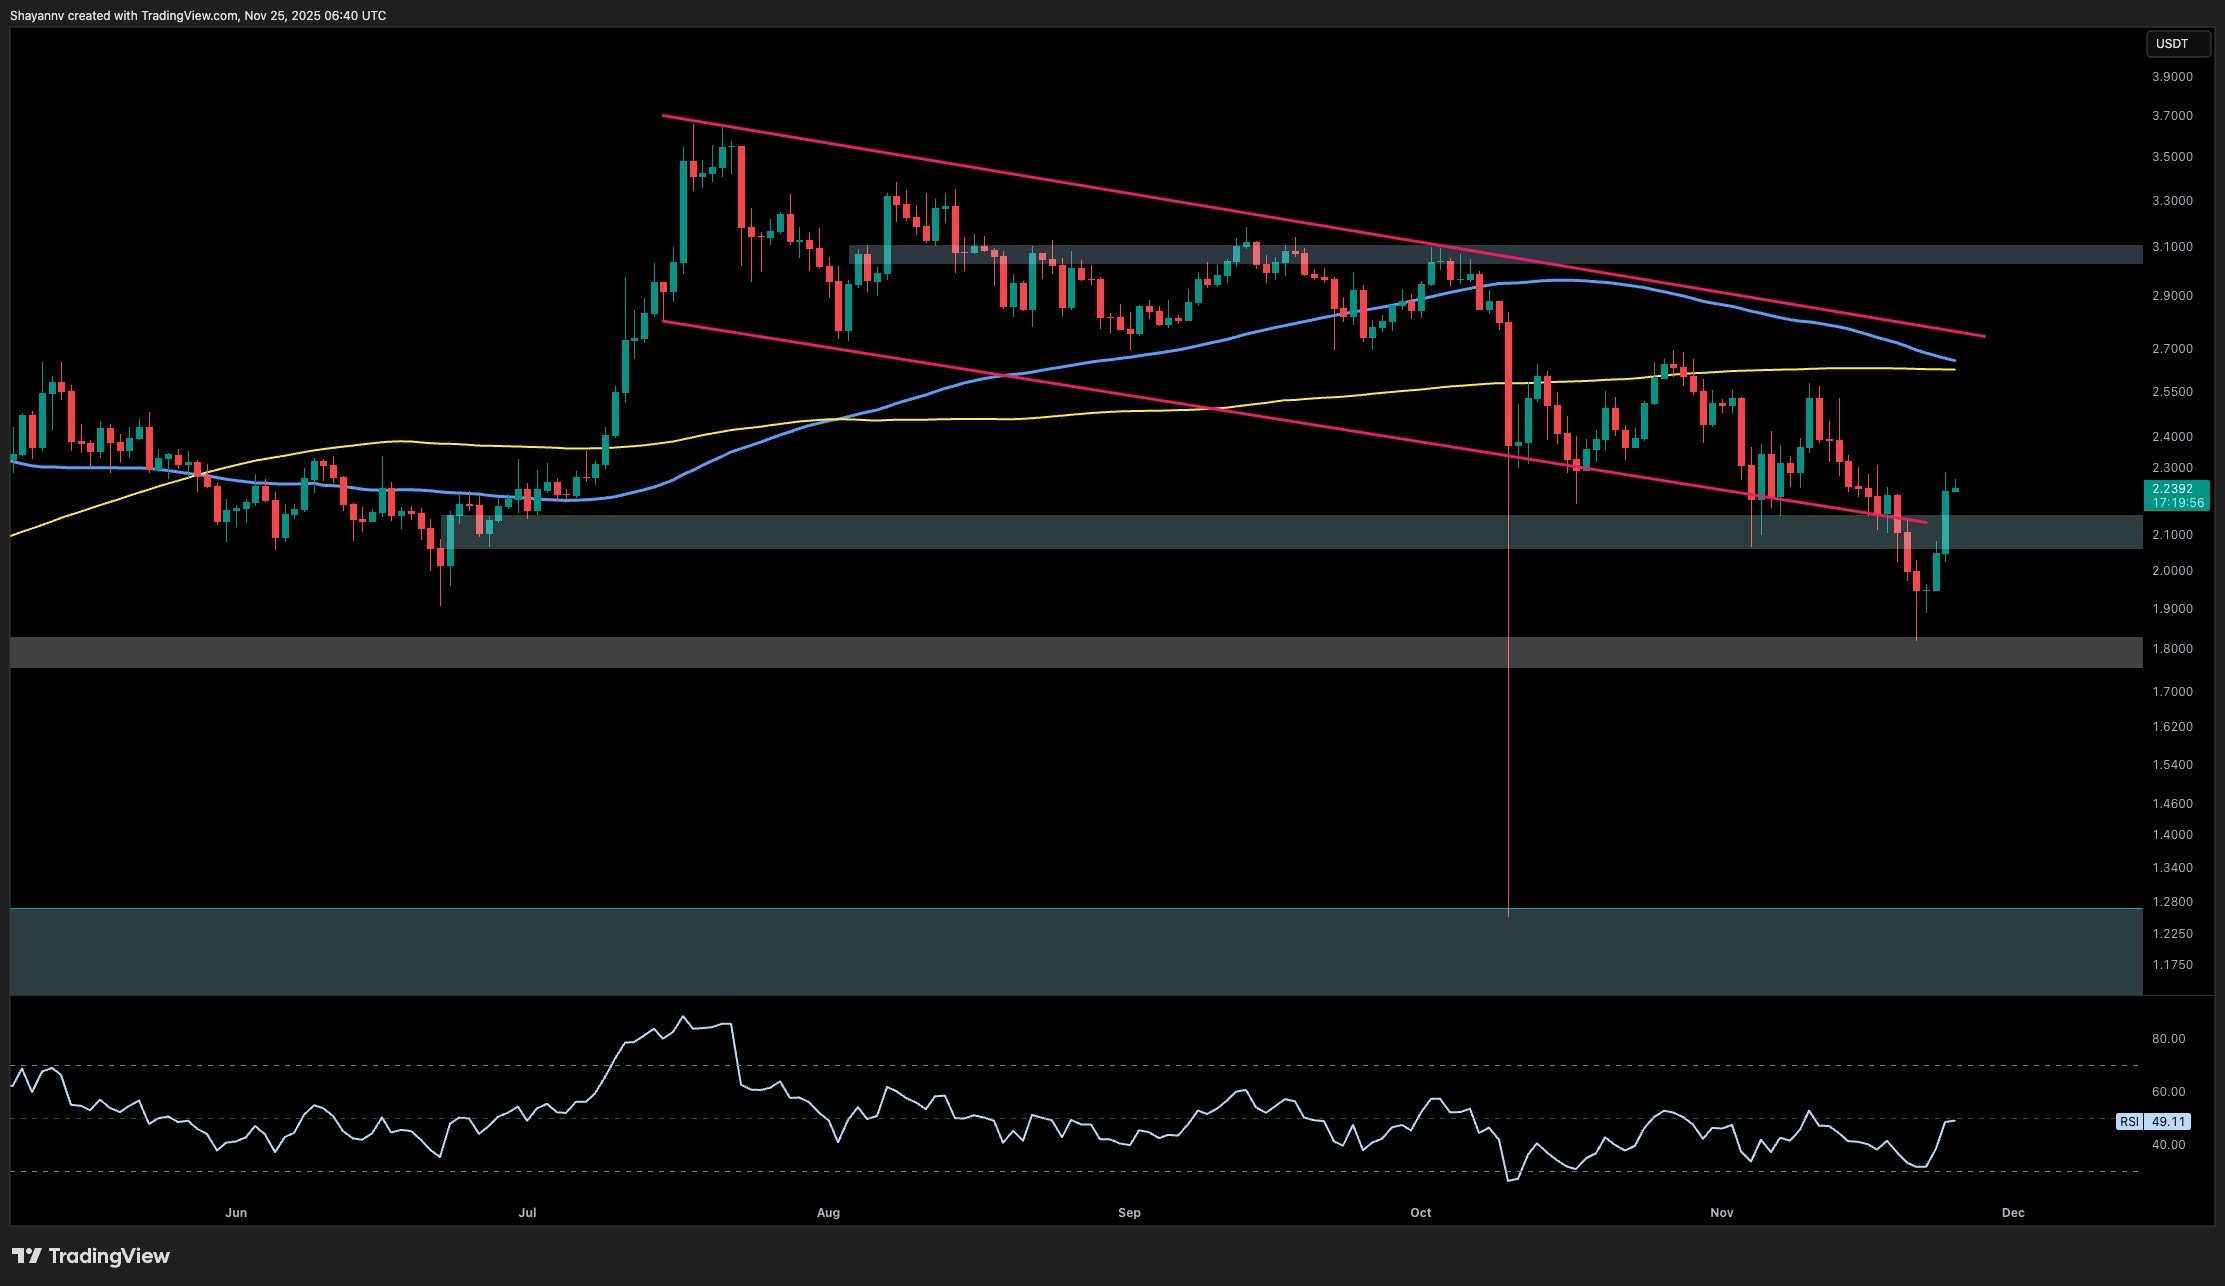
The daily perspective reveals XRP bouncing back significantly from the $1.90 support level—a zone that has historically provided structural backing over several months. This upward move has returned the asset into the longstanding flag structure, hinting at a potential bear trap.
This bounce represents a decisive retest of the flag’s broken lower boundary, which typically indicates a pivotal moment before price continuation. Without reclaiming the $2.40–$2.50 range, the broader bearish sentiment is likely to persist, particularly as this area encompasses both a key order block and prior daily highs that came before downward movements.
The RSI indicates some modest bullish momentum, rising from oversold territory toward mid-range levels; however, it has yet to cross above its multi-week ceiling, implying that while there is some exhaustion of downward momentum, it is insufficient to confirm a broader bullish reversal.
A daily close above $2.45 would signal the first indication of a structural shift; otherwise, we could see further declines toward $1.80, or deeper into the $1.60 demand area if the market weakens again.
Daily XRP Chart
The 4-Hour Chart
The 4-hour chart illustrates a sharp V-shaped recovery, largely attributed to short-covering around the $1.95 level. The price has now approached the area of convergence between a descending trendline and a supply zone at $2.30–$2.40, where initial signs of exhaustion can be observed. The RSI sits near 70, indicating overbought conditions against a backdrop of significant resistance that has been present for the past month. This raises the likelihood of a short-term retracement into the $2.15–$2.20 area, now serving as a temporary support.
Crucially, market participants should watch whether XRP can break and hold above the descending trendline. Success here could see liquidity pockets emerge around $2.55 and $2.75, whereas a rejection would likely trigger another drop back towards the $2.00 mark before any significant recovery attempts occur.
Overall, the 4-hour market structure remains predominantly bearish until XRP secures a decisive close above the $2.40–$2.50 range.
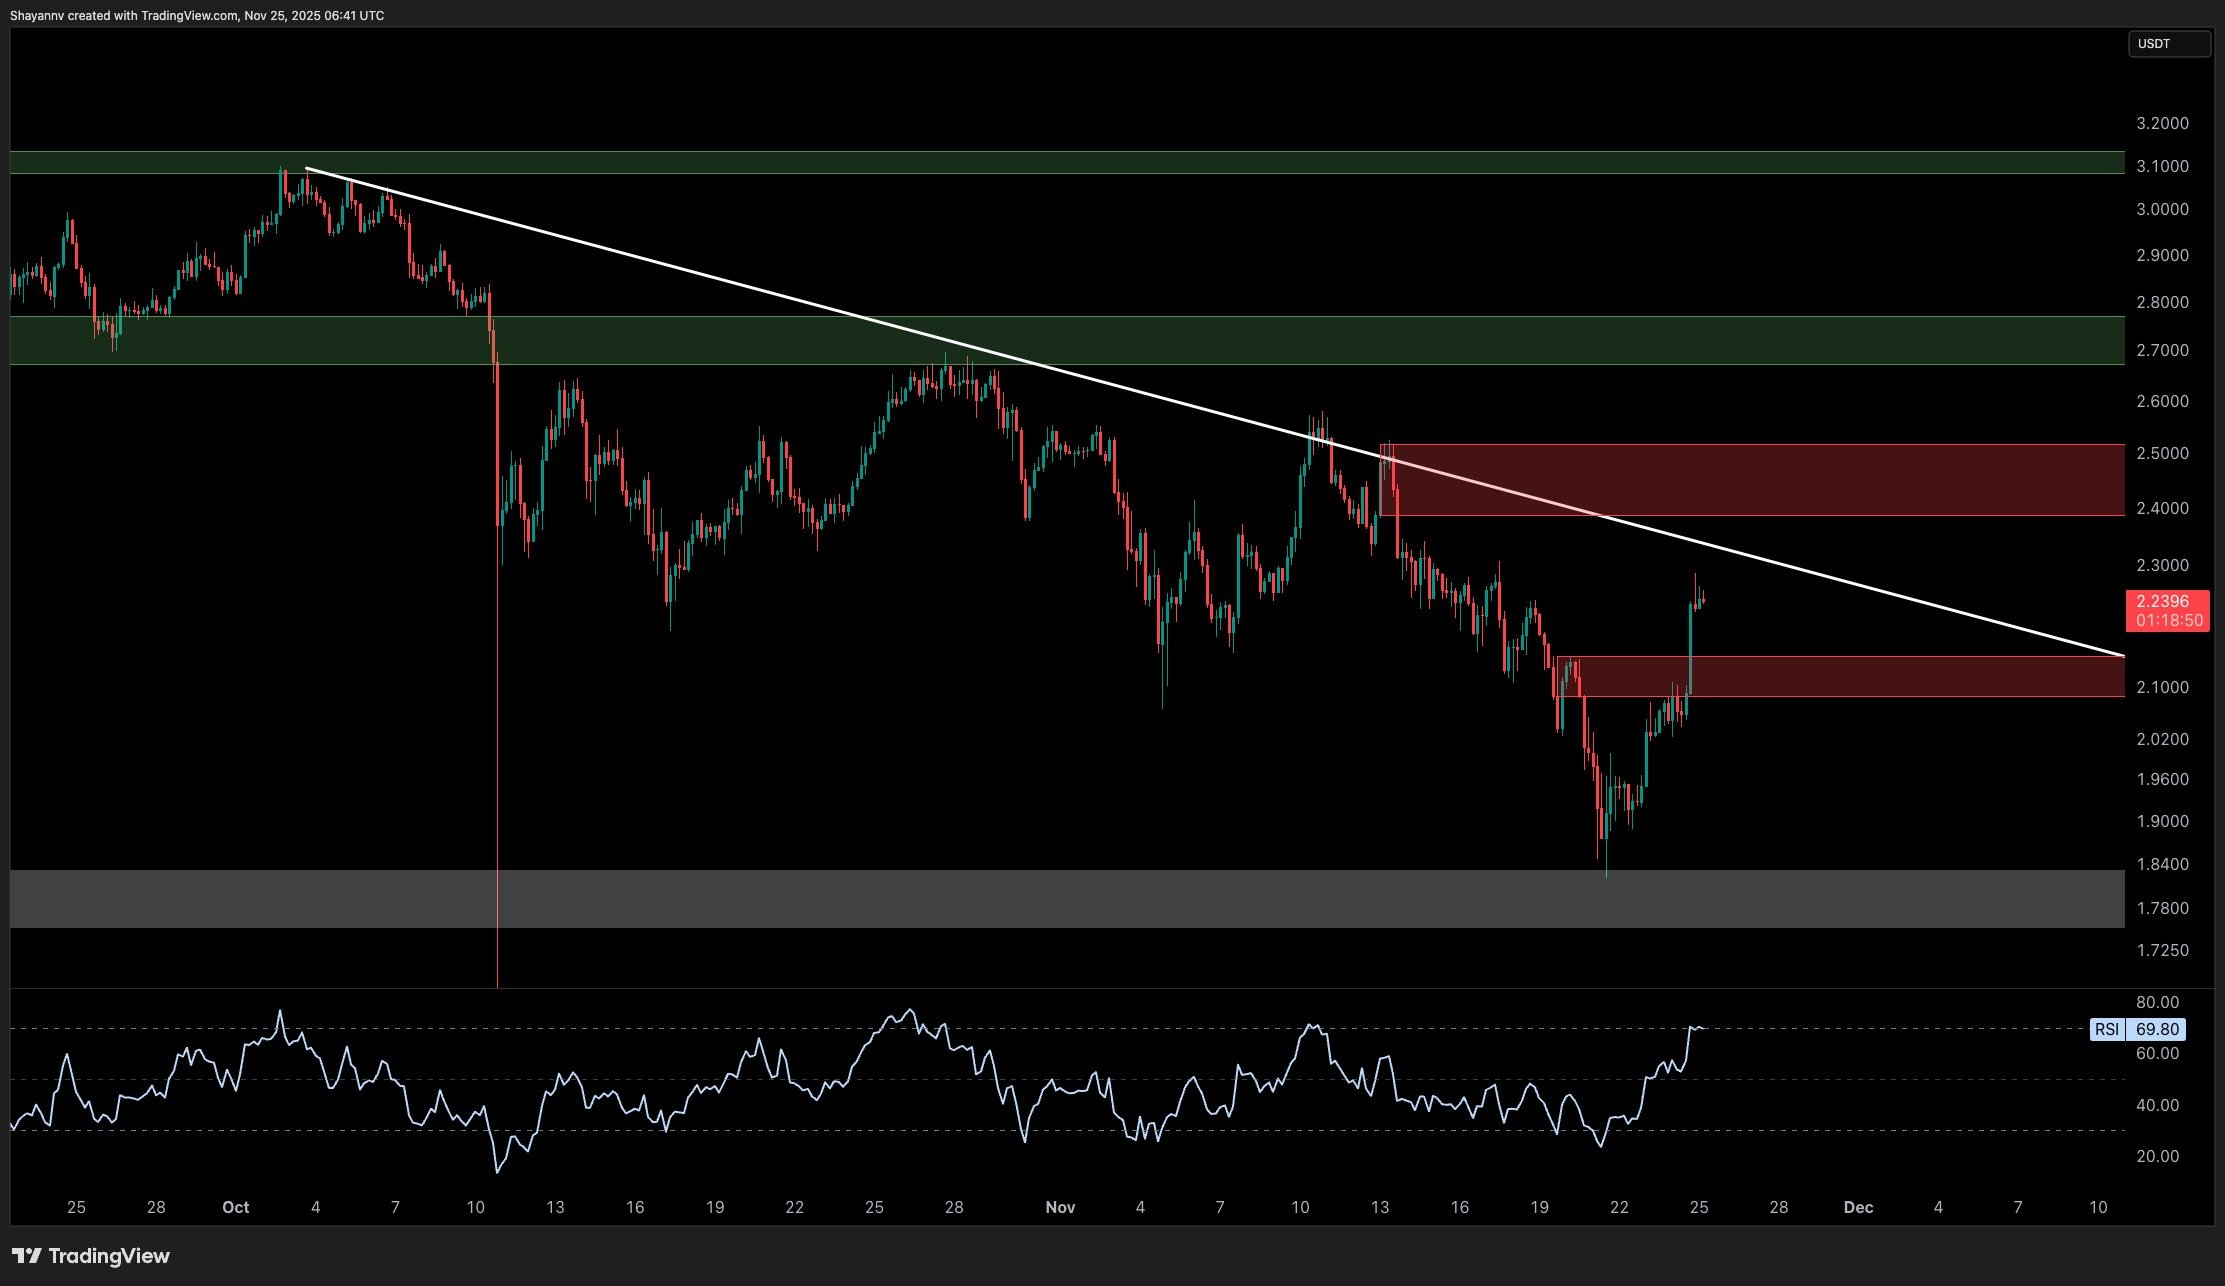 4-Hour XRP Chart
