

XRP has begun to exhibit encouraging signs of recovery after an extended downtrend, attracting traders who are seeking opportunities for bounce-back gains. Despite an uncertain macroeconomic landscape, a recent recovery from local lows and a positive shift in market momentum hint that XRP may be preparing for a short-term reversal of its current trend.
Technical Insights on XRP
Analysis Against USDT
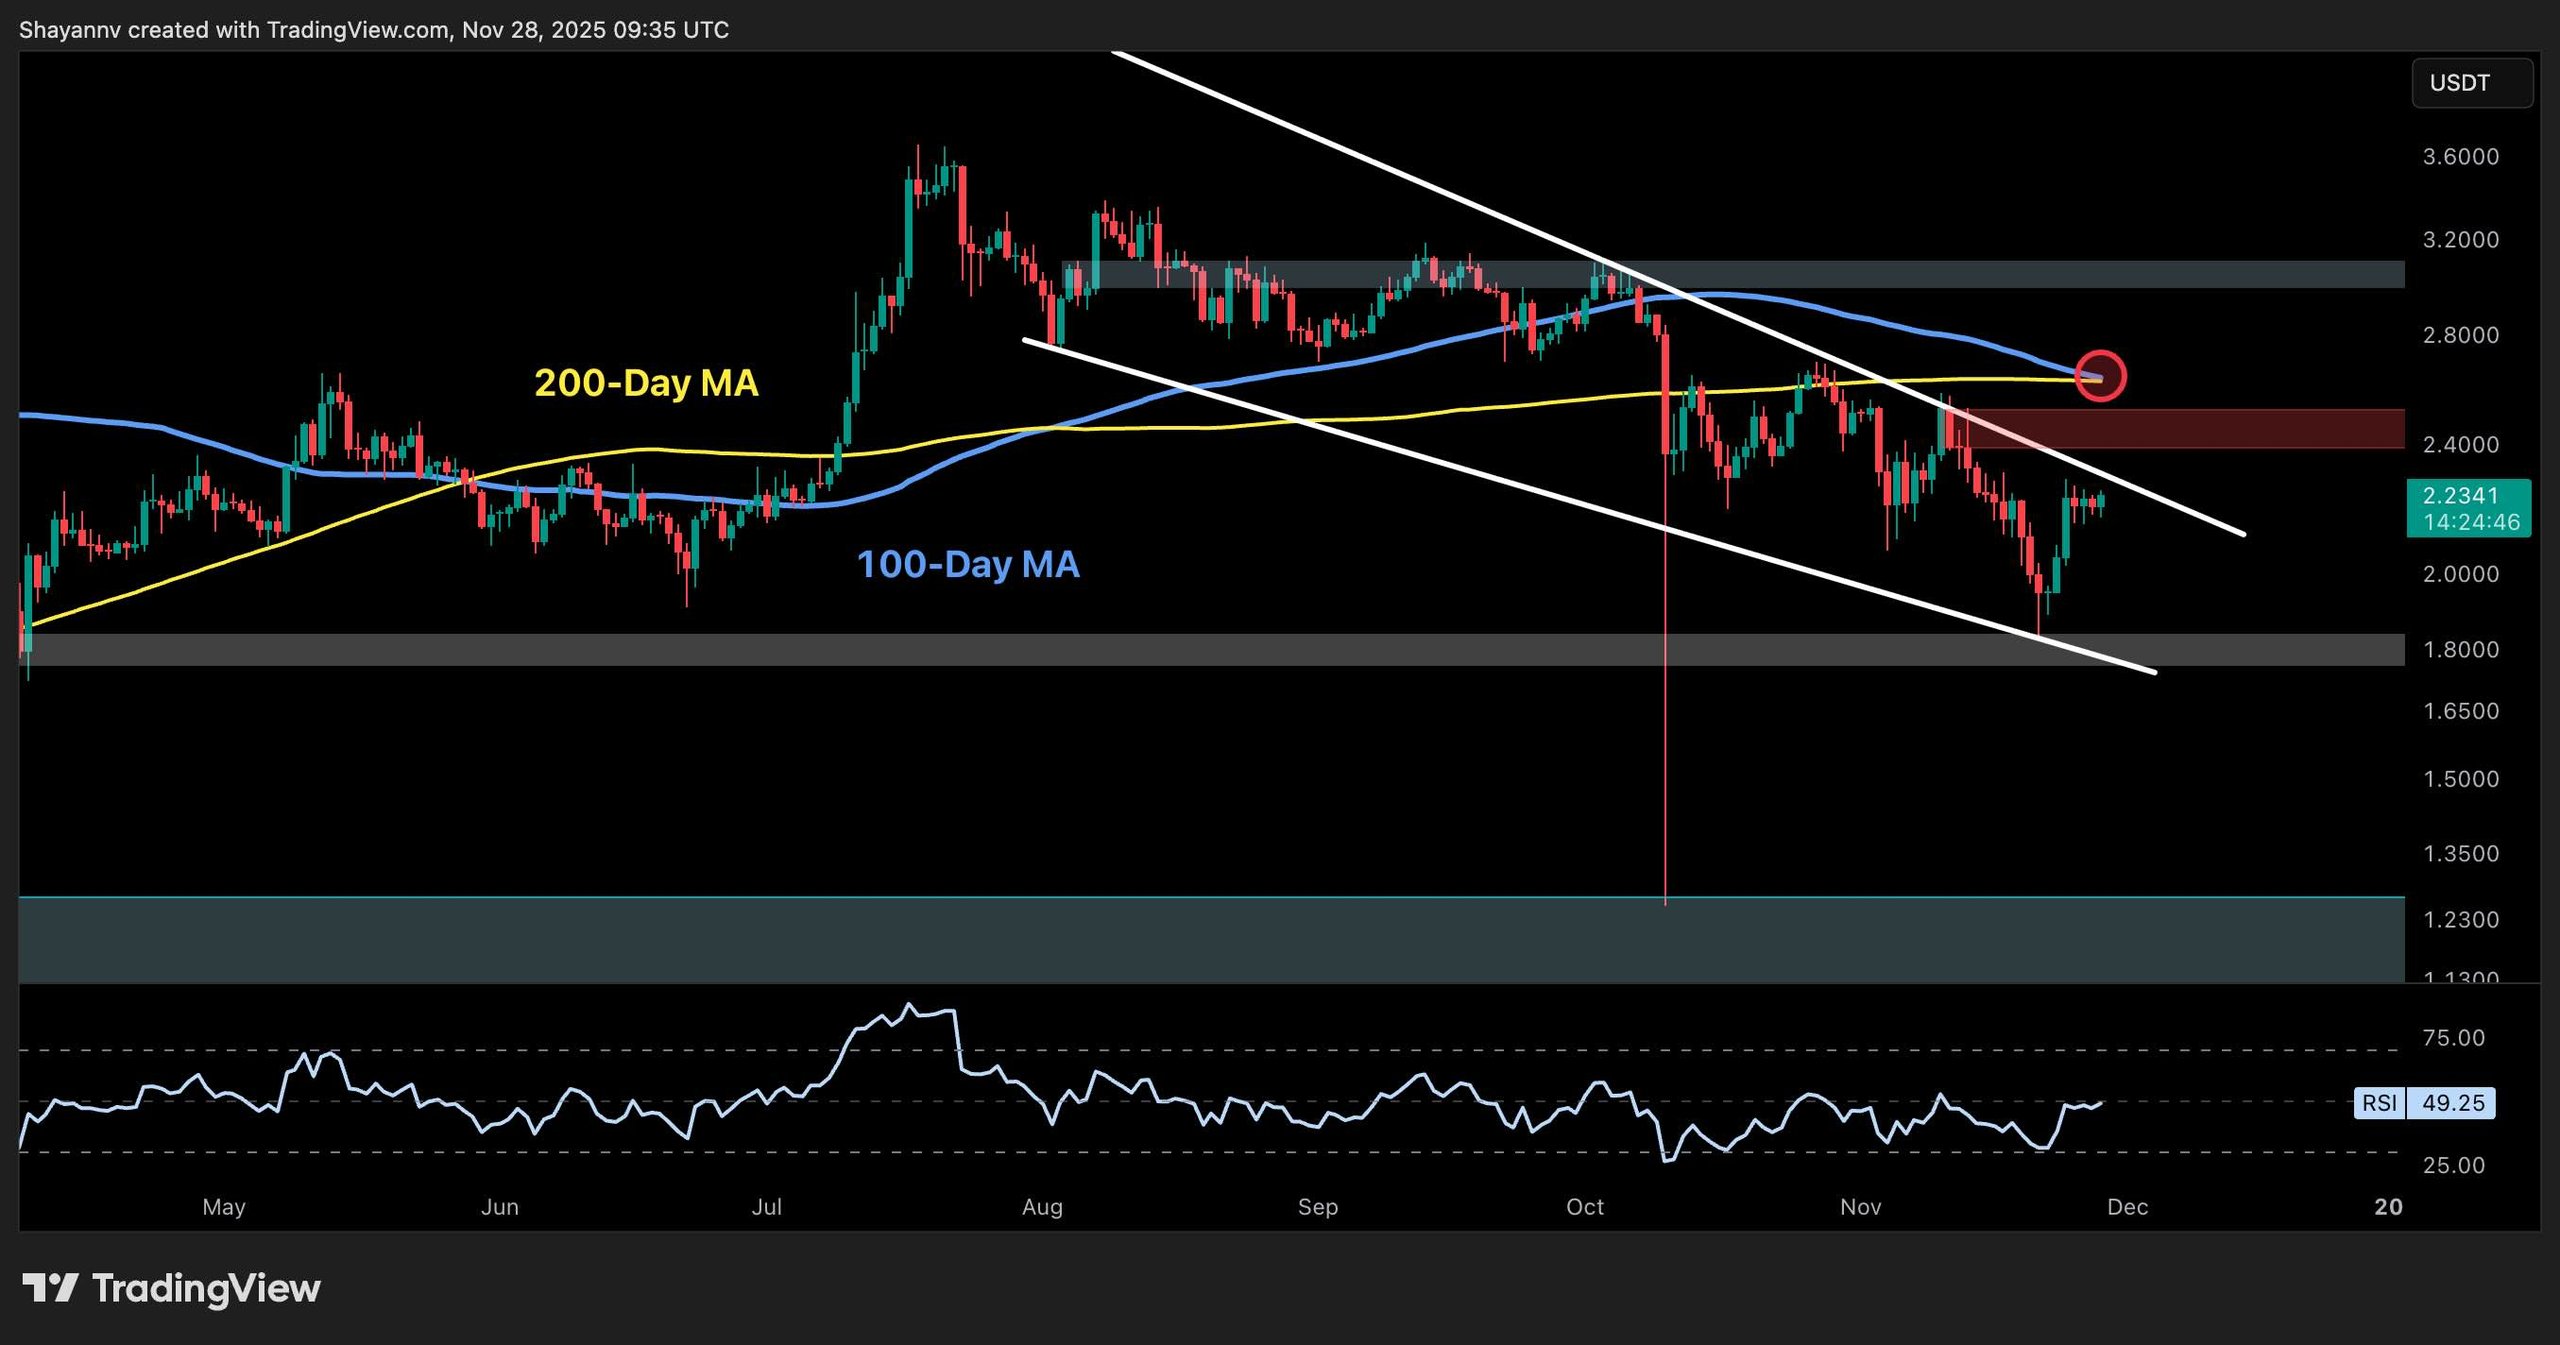
The XRPUSDT pair is currently navigating within a well-crafted falling wedge pattern, which emerged post-failure to break above the $3.20 resistance. Recently, XRP made a rebound from the pattern’s lower boundary and the $1.80 support threshold, successfully reclaiming the $2.00 mark and now aspiring towards the resistance band near $2.50.
However, a significant resistance level lies above, with the token needing to surpass the upper limit of the wedge to reach $2.50. Additionally, the 100-day and 200-day moving averages present further resistance near $2.60, and potential bearish crosses from these averages could signal additional downward pressure on the asset. A closing price above these averages would indicate a strong structural shift towards bullish sentiment.
XRPUSDT Chart
Analysis Against BTC
On the XRPBTC chart, the situation appears more optimistic. XRP has regained both the 100-day and 200-day moving averages at the 2,400 SAT level after bouncing off the crucial 2,000 SAT support zone. It is currently testing the 2,400 SAT area, where moving averages are supporting the price. If buyers maintain their grip above these averages, XRP could set sights on the 2,750 SAT target, potentially reaching up to 3,000 SAT. The RSI has also crossed above 57, indicating improving momentum. Buyers must defend this breakout zone to sustain their advantage.
 XRPBTC Chart
Note: This analysis is for informational purposes only and does not constitute financial advice. Please ensure thorough research before making investment decisions.
