
Is Ethereum (ETH) Ready for a Major Upswing? RSI Signals Potential Surge
Ethereum shows signs of recovery from a key support level. Analysts note potential for upward movement as key technical indicators improve.


Ethereum (ETH) has bounced back from a crucial support level, now trading above $3,000, reflecting a 4% increase within the last 24 hours. This upward movement follows a recovery from the $2,600–$2,700 region, where significant buying activity has been detected
Volume has surged during this ascent, exceeding $21.2 billion traded within the past day. Some analysts hint at a possible trend reversal forming, though further validation is awaited.
RSI Breakout and Short-Term Setup
ETH has broken through its RSI downtrend for the first occasion since October. This jump coincides with the price stabilizing above the $2,900 support level. Mister Crypto commented that “a bounce is very likely here,” indicating improving momentum.
“$ETH is breaking out from this RSI downtrend. A bounce is very likely here!”
— Mister Crypto
Notably, the Relative Strength Index, which gauges price strength, had been on a decline for weeks. A breach above this trendline indicates a slowdown in downward pressure.
Meanwhile, Lennaert Snyder cited $3,040 as a short-term resistance level, labeling it a “make or break” zone. Cleaving this obstacle would potentially lead to prices reaching $3,140 and $3,200. If ETH fails to maintain this, he observes the $2,950–$2,900 zone as likely support.
Snyder remarked, “If price gains $3,040, I’ll look to snipe a long,” but cautioned that if ETH is rejected again, he would consider short positions.
You might also find these interesting:
- Whales are Leaning into Ethereum (ETH) and Cardano (ADA): Retail is Lagging Behind
- Ethereum’s Vitalik Buterin Drops 256 ETH to Boost Next-Gen Encrypted Messaging
- Ethereum’s Largest Whales Just Hit a Record High – What Are They Preparing For?
ETH/BTC Pair Nearing Breakout Pattern
The ETH/BTC chart illustrates a rebound from the 0.0300–0.0325 BTC zone, currently trading at around 0.0332 BTC. Michaël van de Poppe suggested that this structure could induce a breakout, stating, “This cycle is far from over,” regarding ETH’s overall architecture.
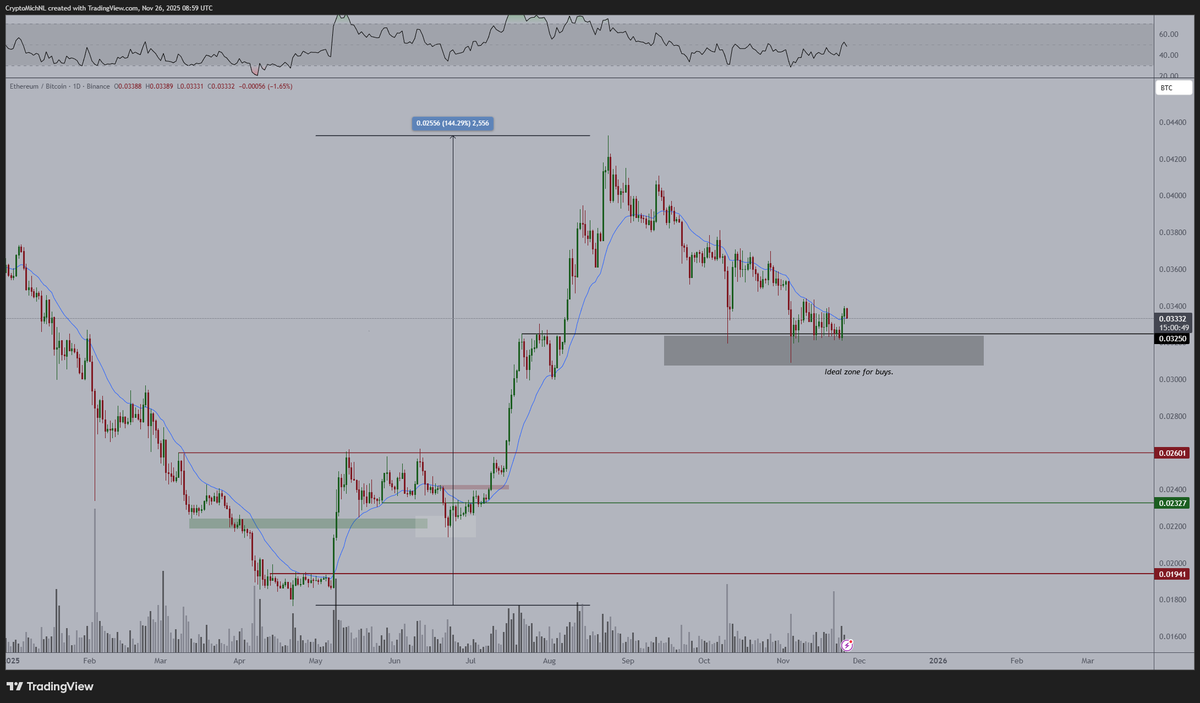 ETH/BTC Chart
Source: Michaël van de Poppe/X
ETH/BTC Chart
Source: Michaël van de Poppe/X
Additionally, Don highlighted the formation of a falling wedge within a long-term descending channel. The price has advanced above the wedge, and an outbreak from the larger channel could elevate ETH/BTC towards the 0.0695 region.
Large Wallet Activity and Exchange Supply Drop
As noted by CryptoPotato, wallets containing between 10,000 and 100,000 ETH now command over 21 million tokens, marking the highest since Ethereum’s inception. Furthermore, addresses holding over 100,000 ETH have also escalated their holdings to approximately 4.3 million.
In parallel, tokens held on exchanges have continued to dwindle, possibly indicating that larger holders are transferring coins off trading platforms for long-term storage. Additionally, Ali Martinez pointed out that $2,250, $1,550, and $1,080 are “strong zones to accumulate ETH ahead of the next rally.”
