
Why Bitcoin's Approach to $93.5K This Time Might Signal a Breakout
Bitcoin is nearing its crucial resistance level at $93.5K, and recent patterns suggest a potential upward movement towards $100K.


Bitcoin is currently testing the critical resistance level of $93,500. Observations suggest that traders are anticipating a breakout as the recent pattern signals a potential upward movement toward $100,000.
Reduced Resistance During Repeated Tests
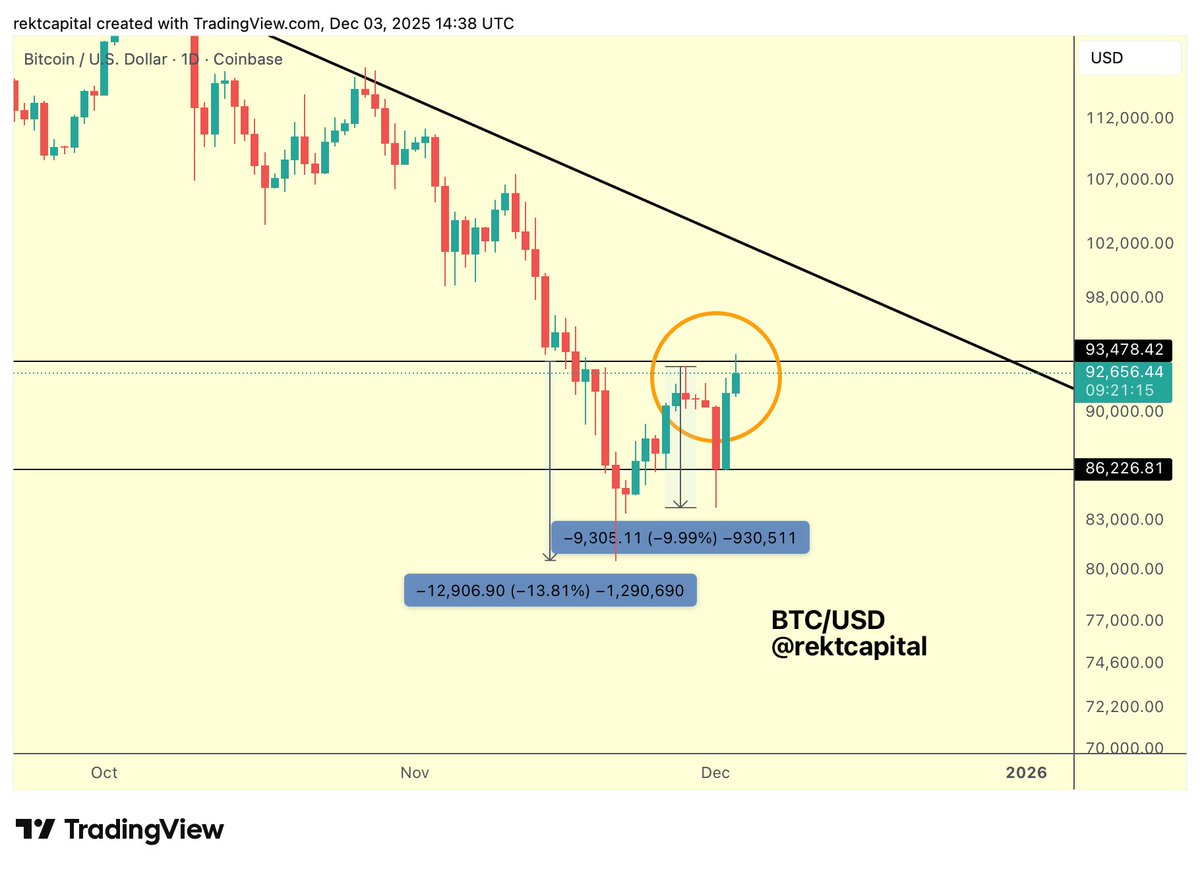
Bitcoin has repeatedly tested the $93,500 resistance. Each attempt has resulted in lesser pullbacks: initially a 14% drop, then 10%, and on the latest test, the market showed minor rejection, indicating that sellers may be losing their grip.
Analyst Rekt Capital remarked,>
“The rejections from the Range High resistance of ~$93,500 have been getting weaker with each test.”
(Translation: The rejections from the range high resistance of around $93,500 have been diminishing with every attempt.)
The pattern depicts higher lows, indicating increased buying pressure, hinting at a possible upcoming breakthrough surpassing this resistance level.
 Bitcoin Price Chart
Bitcoin (BTC) Price Chart 04.12. Source: Rekt Capital/X
At present, Bitcoin is trading closely at $93,200, having seen a daily low of $92,000 and a high of $94,100. Although it experienced a short-term bout of stagnation, recent actions reflect a growth of over 2% weekly, notwithstanding slight declines in the last 24 hours.
In the previous week, BTC ascended past $90,000 after dipping below $81,000 in mid-November, temporarily breaching $93,000 but now oscillating between $91,000 and $92,000.
Analyst CryptoWZRD acknowledged that Bitcoin’s closure above $91,500 represents a bullish daily close, and this threshold is now acting as support. The subsequent key area on the chart to exceed is $94,000, which, if surpassed, may open pathways toward $100,000.
Signs of a Shift in Early Month Patterns
Trader Daan Crypto Trades noted an interesting pattern. He stated,>
“It is often a very weak high/low and gets retested and taken out relatively soon after.”
(Translation: It usually represents a weak peak or low and gets revisited and corrected quickly.)
Most months tend to exhibit a reversal after a prompt movement. The current month appears to be conforming to this pattern, which may indicate Bitcoin could shift momentum back upward following an early low.
As an additional point, on-chain data reveals that Bitcoin reserves on Binance have plummeted to their lowest levels in several years, signifying increasing demand for self-custody and institutional interest, especially linked to ETF activities. According to recent reports, this behavior suggests Bitcoin may be nearing the lows of its cycle. As fewer coins linger on exchanges and demand surges, prices typically rise in response over time.
