Is Bitcoin's Current Recovery Real or Just a Temporary Rebound?
An analysis of Bitcoin's recent price movements, highlighting critical support levels and potential trends.


Overview
After experiencing consistent selling pressure, Bitcoin has started to show preliminary signs of recovery. Recently, it bounced back from the $80,000 support zone, moving above $90,000 and shifting market sentiment from fear to cautious optimism. However, analysts caution that this may merely be a short-term recovery.
Daily Analysis
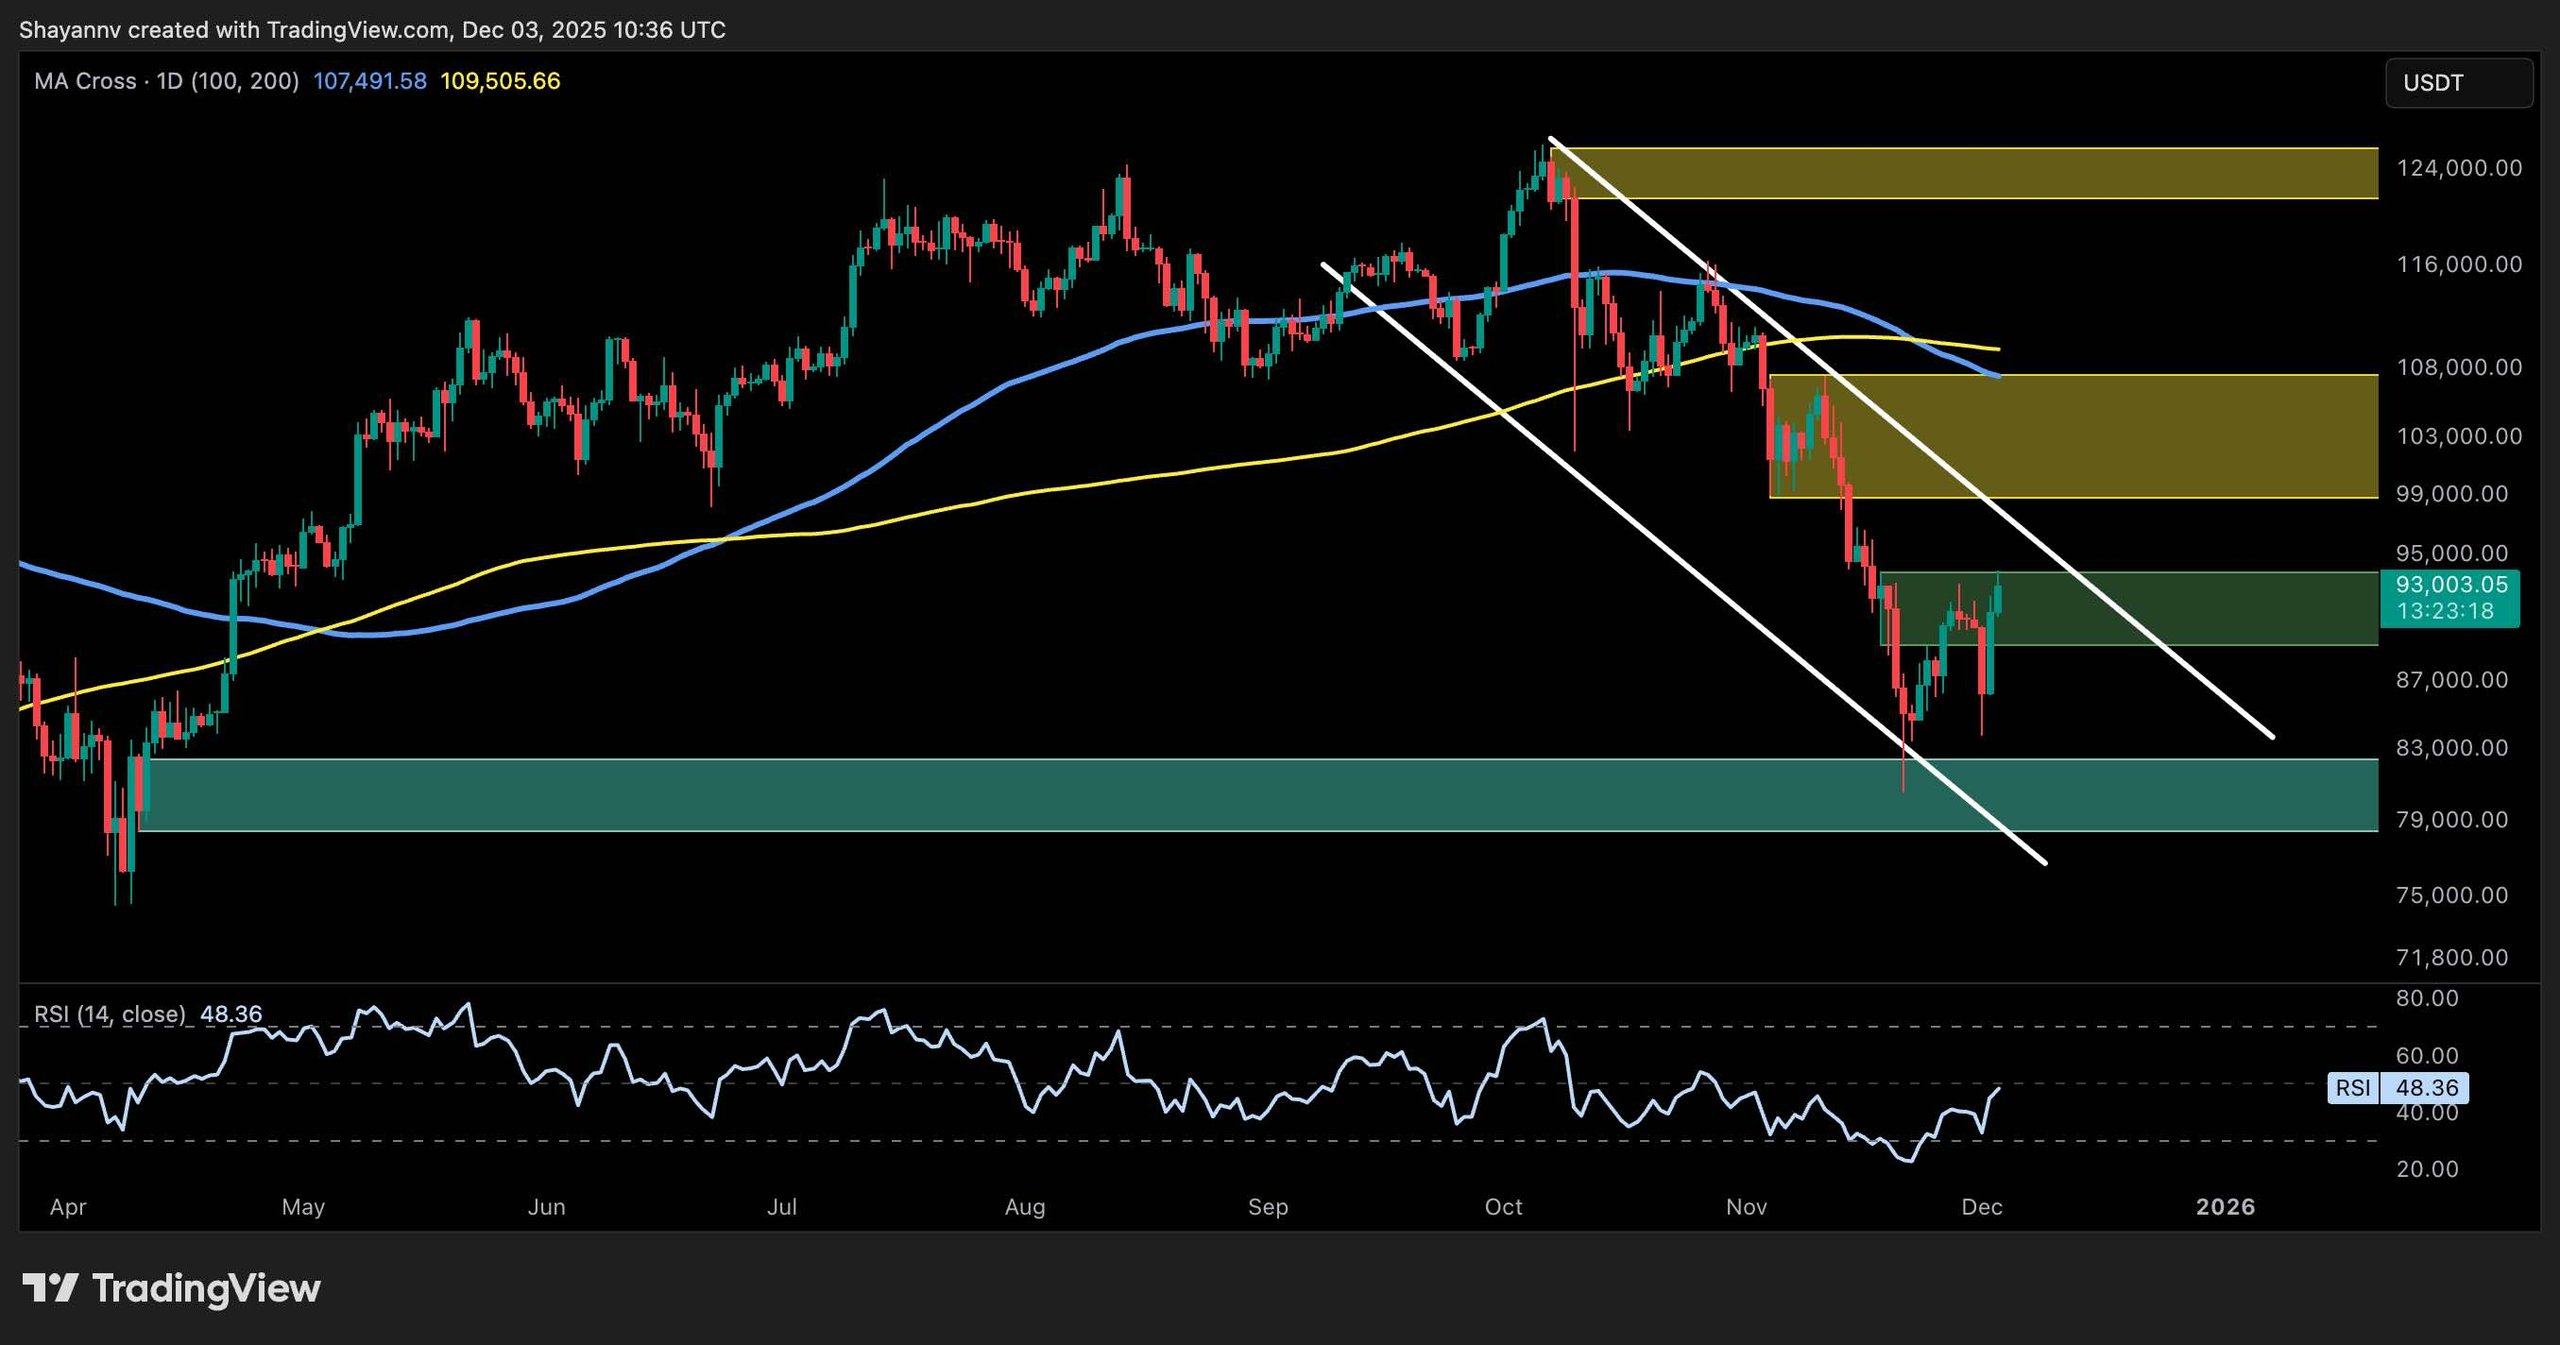
On the daily chart, BTC is attempting to regain the mid-range green demand zone between $89,000 and $93,000. In the coming days, it is likely to confront the upper trendline of the descending pattern, which has been offering resistance since the drop from $116,000. Both the 100-day and 200-day moving averages are situated above, near the $108,000 mark, forming a significant resistance zone. Until these averages switch from resistance to support, the broader trend may remain bearish despite the recent uptick.
4-Hour Chart Insights
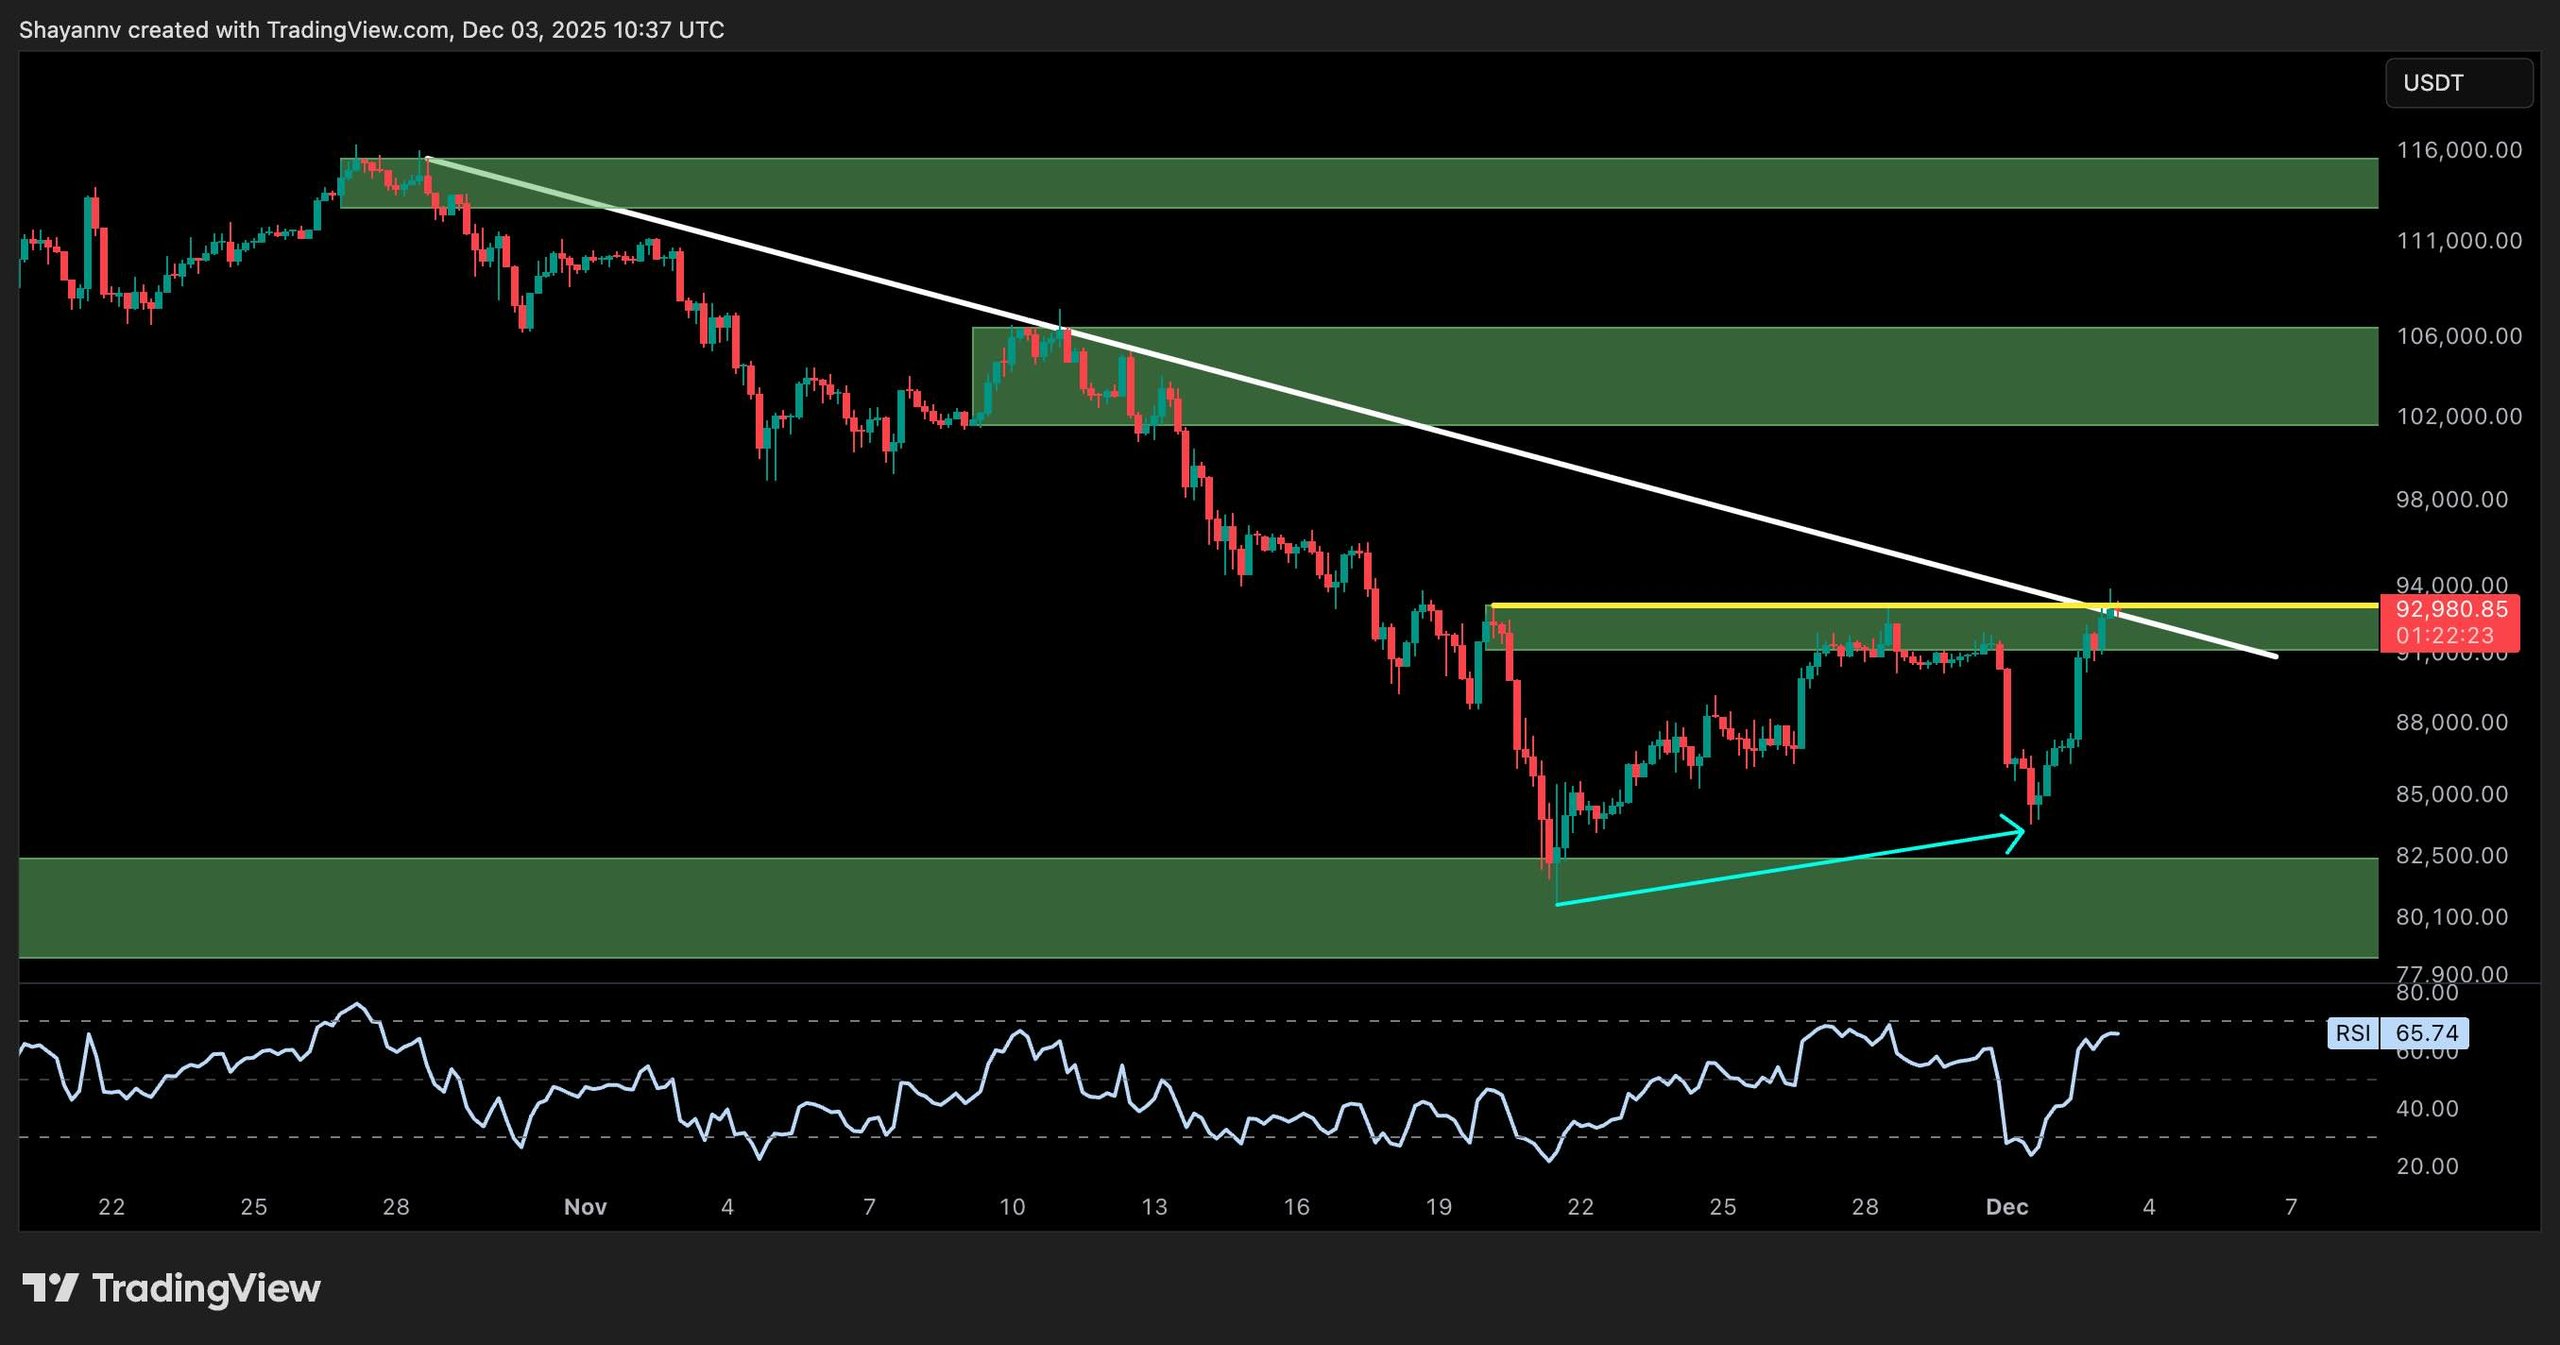
On the shorter, 4-hour chart, Bitcoin is positioned to potentially break through the bearish trendline, showing strong momentum. It recently established a higher low around $83,000, propelling the current rally.
Currently, Bitcoin is testing horizontal resistance at $93,000 as it also interacts with the descending trendline. A successful breach here could usher in movement toward the $103,000 supply zone. Conversely, a rejection might lead to a pullback towards $88,000, potentially rekindling a bearish trend should it dip below the critical support zone of $80,000.
On-Chain Evaluation
Analyzing on-chain metrics, Bitcoin exchange reserves have recently plummeted, reaching their lowest point in years. This decline in BTC held on exchanges is often perceived as positive, as it implies that coins are transitioning into long-term storage.
Historically, a decrease in reserves combined with price recovery signifies accumulation by investors with deep pockets. Though this isn’t a short-term indicator, it supports a more optimistic long-term outlook, suggesting that supply on exchanges is tightening amid fluctuating price activity.
