Bitcoin Price Outlook: Risk of Dropping to $80K If Key Resistance Not Surpassed
Bitcoin's upward movement faces hurdles as it attempts to secure its position above critical resistance levels, potentially leading to a decrease towards $80,000.


Bitcoin’s price growth has recently faced obstacles following a rapid rally. After breaking through essential levels last week, current buyers now encounter two significant issues: the need to regain dominance above resistance and address declining on-chain metrics.
Technical Analysis
By Shayan
The Daily Chart
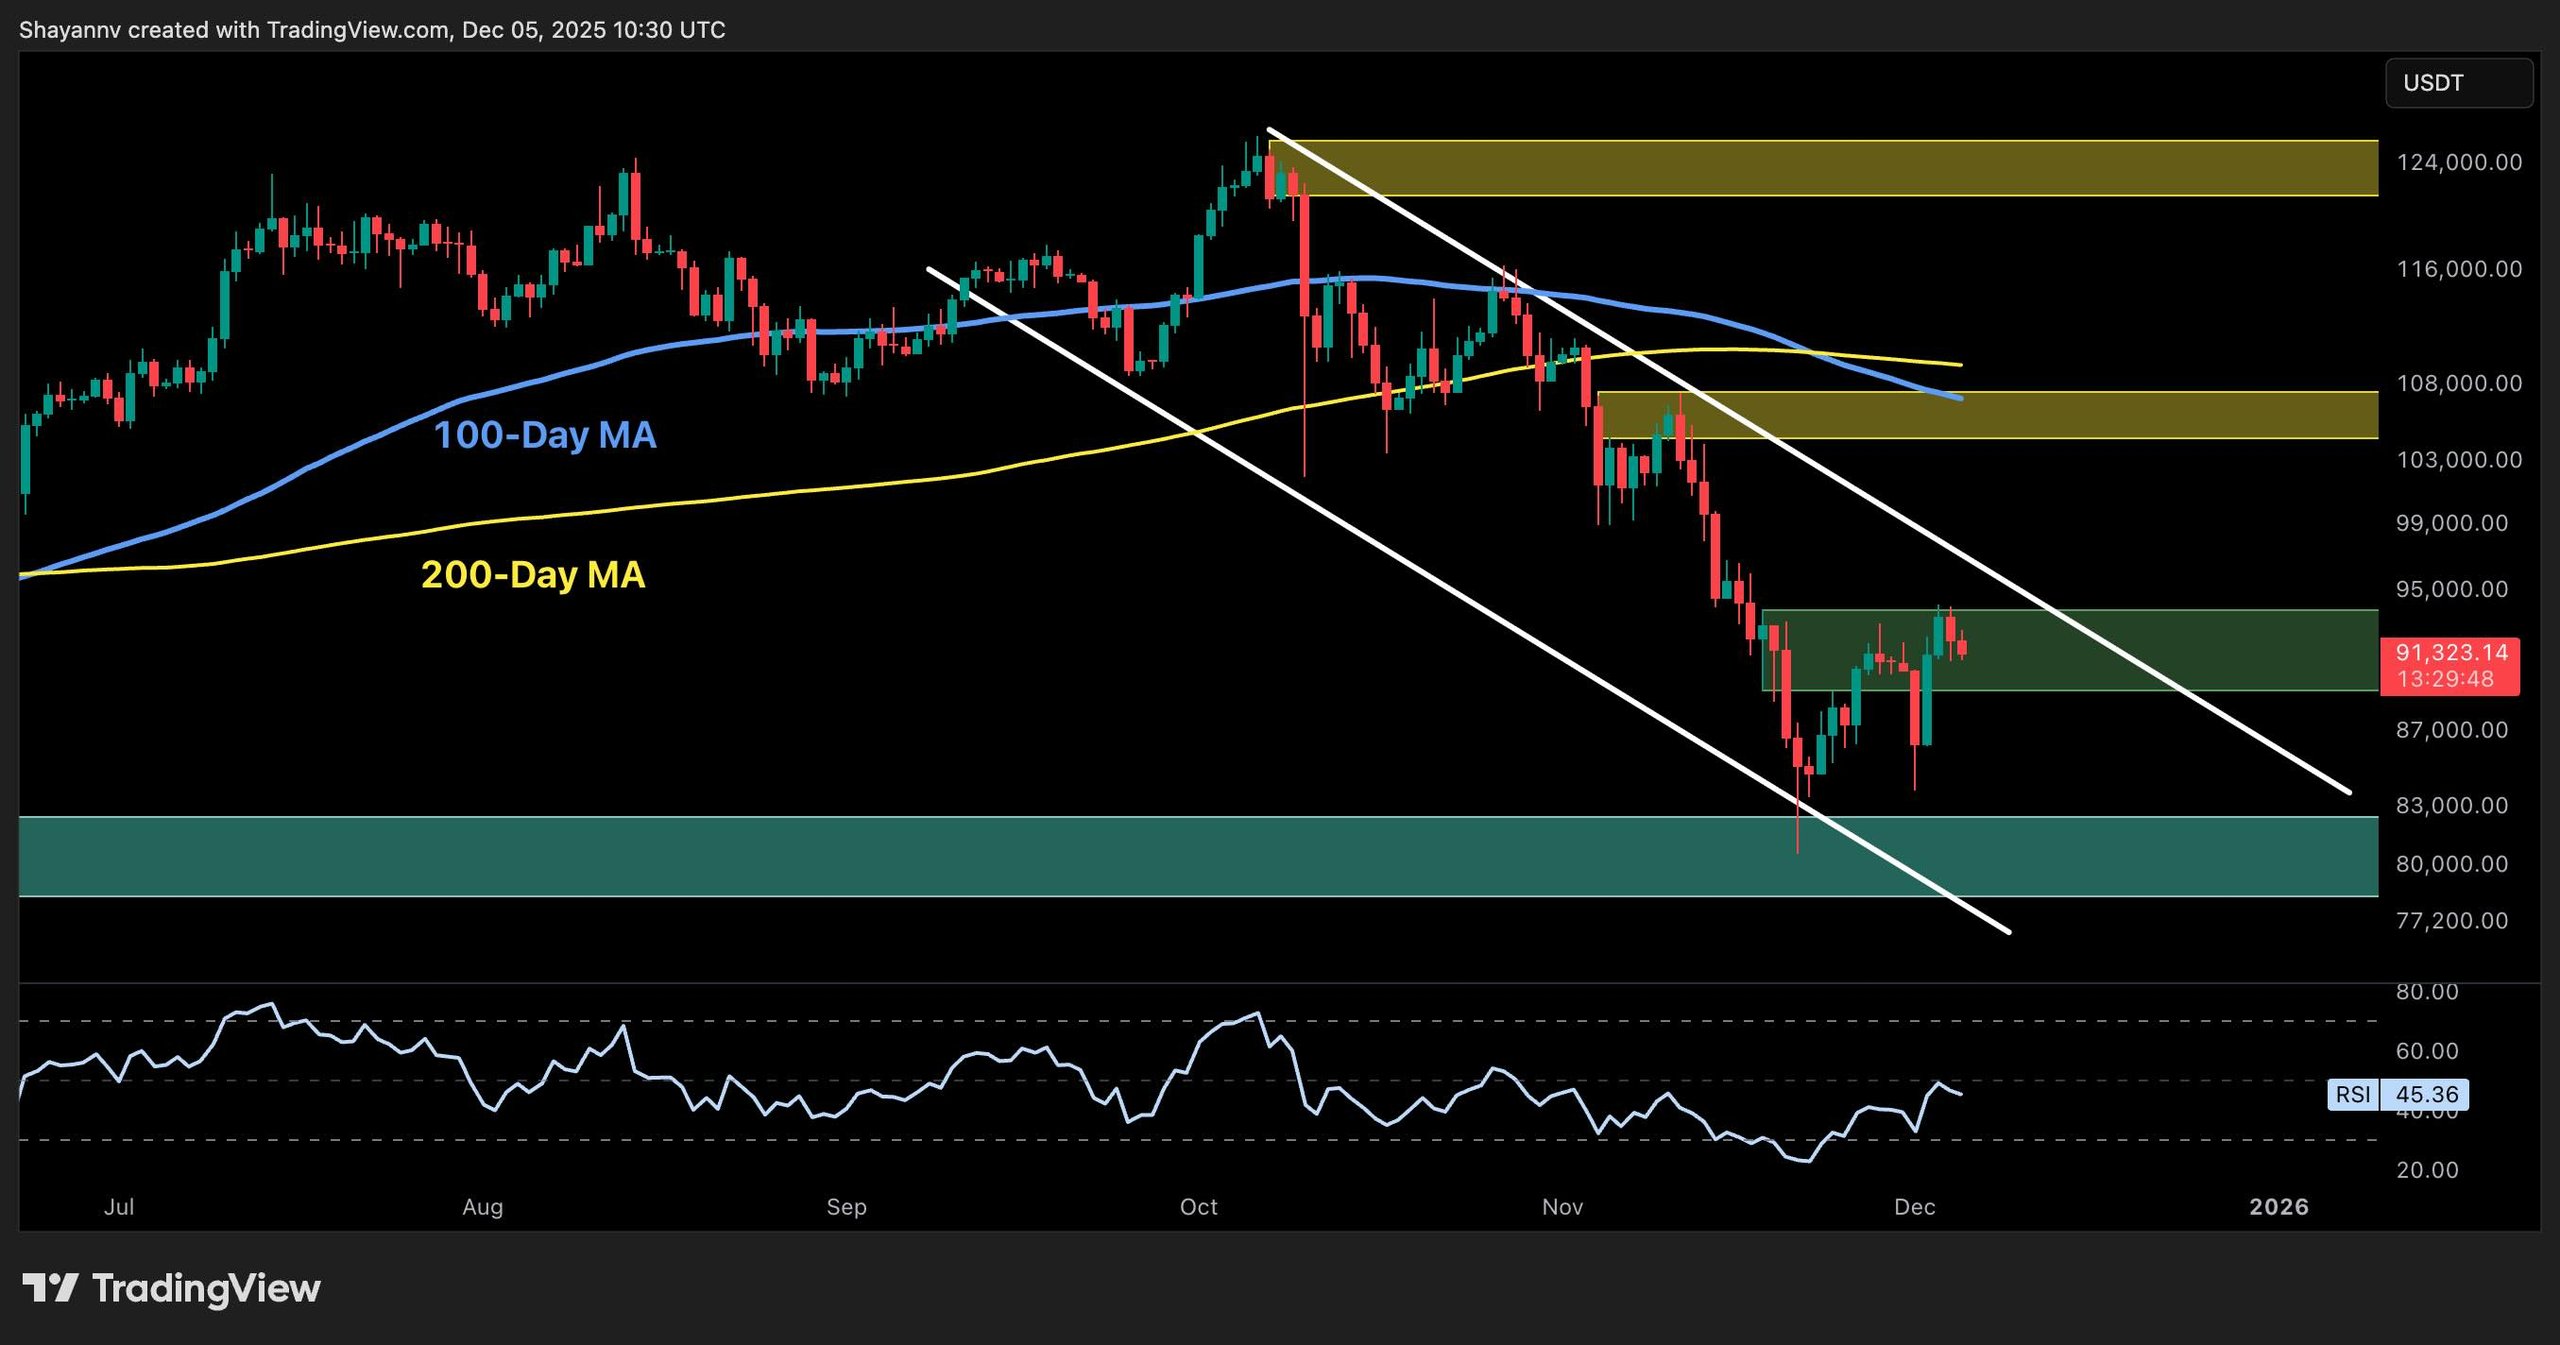
The daily chart for BTC reveals a distinct rebound from the $80K demand zone, pushing its value back into the $90K–$93K resistance area. The asset remains confined within a descending channel and is currently struggling below the upper trendline resistance.
Both the 100-day and 200-day moving averages (hovering around $108K) are significantly above the prevailing price. As long as BTC stays beneath these moving averages, a bullish trend cannot be established. Furthermore, the RSI indicates indecision, remaining around 45 and unable to venture into bullish territory.
The $90K–$95K zone is pivotal in the short term. A clear breakout and daily closure above this area could indicate a trend reversal. Conversely, until that happens, the current upward movement appears to be a bear market rally amid a larger downtrend.
Daily Chart
The 4-Hour Chart
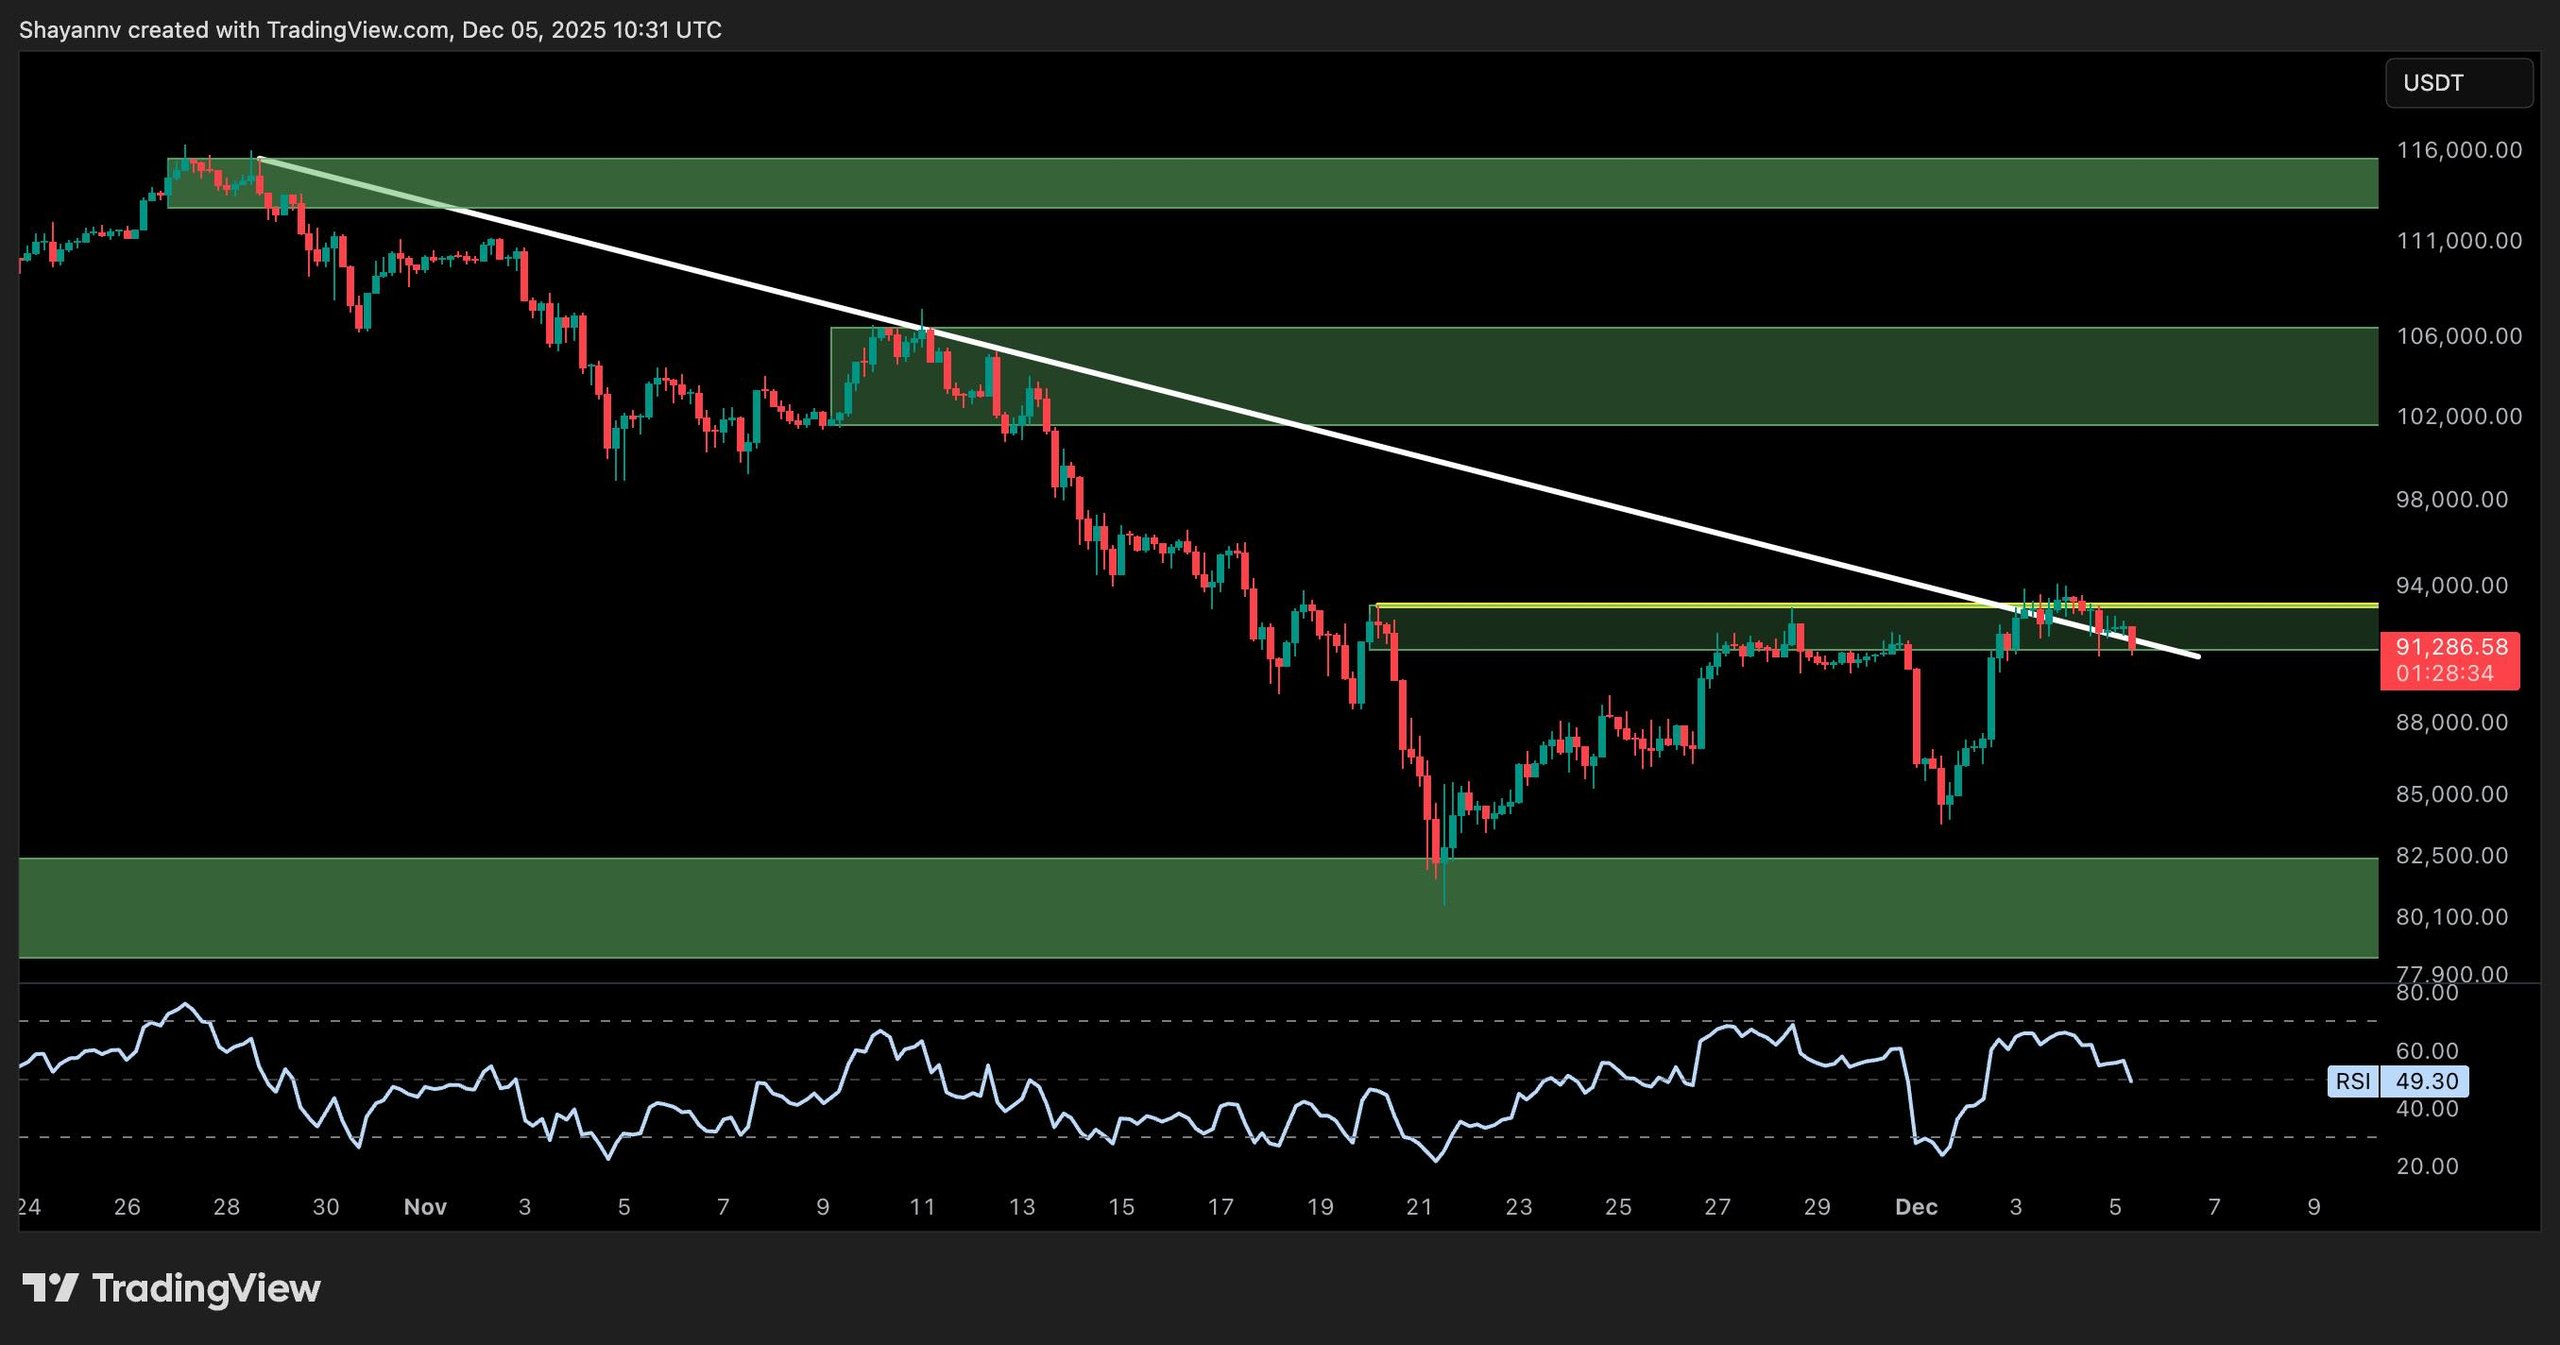
Focusing on the 4H chart, Bitcoin has developed a structure hinting at a breakout and retest following a descending trendline established in late October. After repeated failures at $94K, BTC successfully went above this trendline but is currently fluctuating around the $91K level again.
Even if the local market structure appears favorable, a bearish divergence is visible on the RSI, with diminishing momentum. Should buyers fail to maintain their position above $90K in upcoming sessions, a decline back toward the $80K zone could materialize. Conversely, a robust push above $94K could quickly reinstate targets above $100K.
 4-Hour Chart
On-Chain Analysis
Active Addresses (100-Day Moving Average)
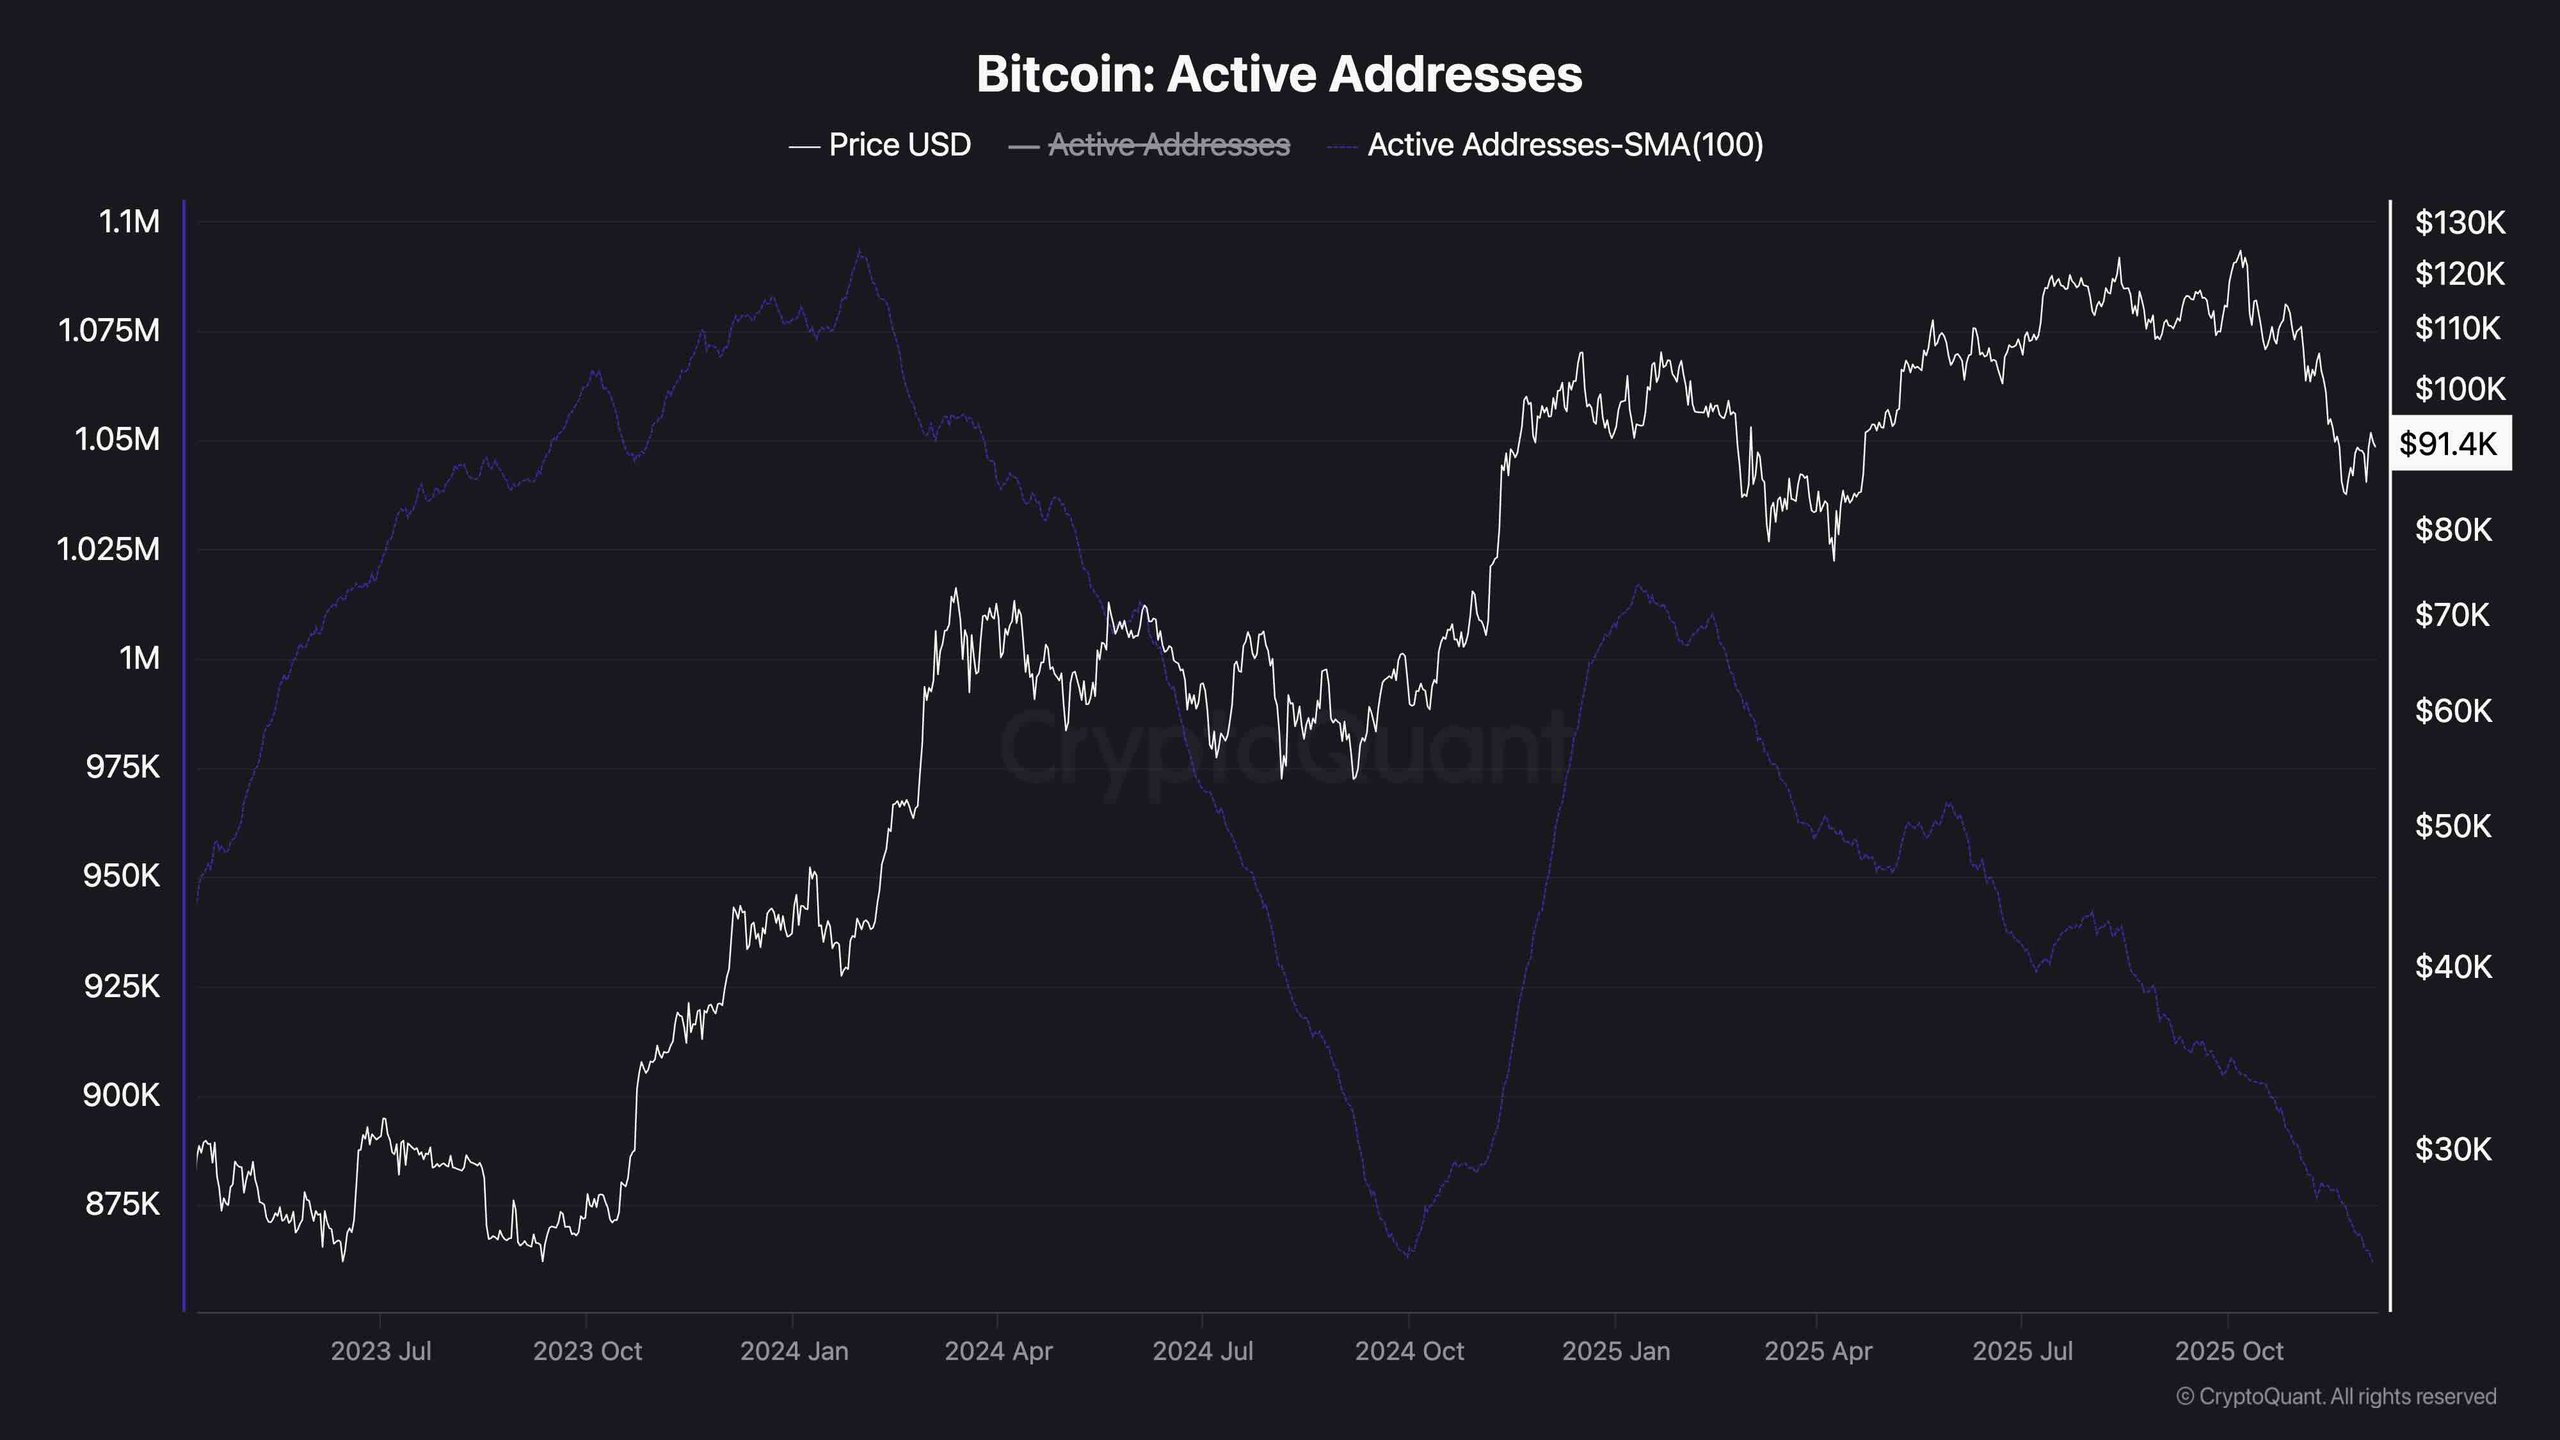
The on-chain landscape is currently unfavorable for investors. Active Bitcoin addresses have consistently declined since February 2025, even as prices reached new all-time highs. This trend manifested during the steep drop in October and November.
Despite the price surge from $80K to $91K, the count of active addresses (tracked using the 100-day SMA) continues to fall, recently dropping below the 875K mark. This hints at diminishing retail and user engagement, indicating that the rally might be chiefly driven by fewer large-scale participants, such as whales or institutional investors.
Sustainable rallies usually require a resurgence in network activity and user involvement. Until there is a shift in address activity trends, this bounce will likely be viewed with skepticism from a fundamental perspective.
 Active Addresses
