
Ether Price Projections Indicate Potential for a Significant Rally as ETF Inflows Rebound
The demand for Ether has shown signs of recovery, with a notable uptick in ETF inflows. Will this jumpstart a new uprising in Ether's price?


Ether’s price movements have tempered this week after encountering strong resistance between the $3,650 and $3,350 levels, stabilizing around $3,200. This drop corresponded with the 200-day EMA, reinforcing resistance while ETF inflows began to show slight recovery indications.
Key Highlights:
- Spot Ether ETF inflows have surged from $16.8 billion to $21.5 billion since November 21, marking a 28% increase.
- There has been an increase in net taker volumes, indicating a decline in aggressive sellers as buyers gradually return.
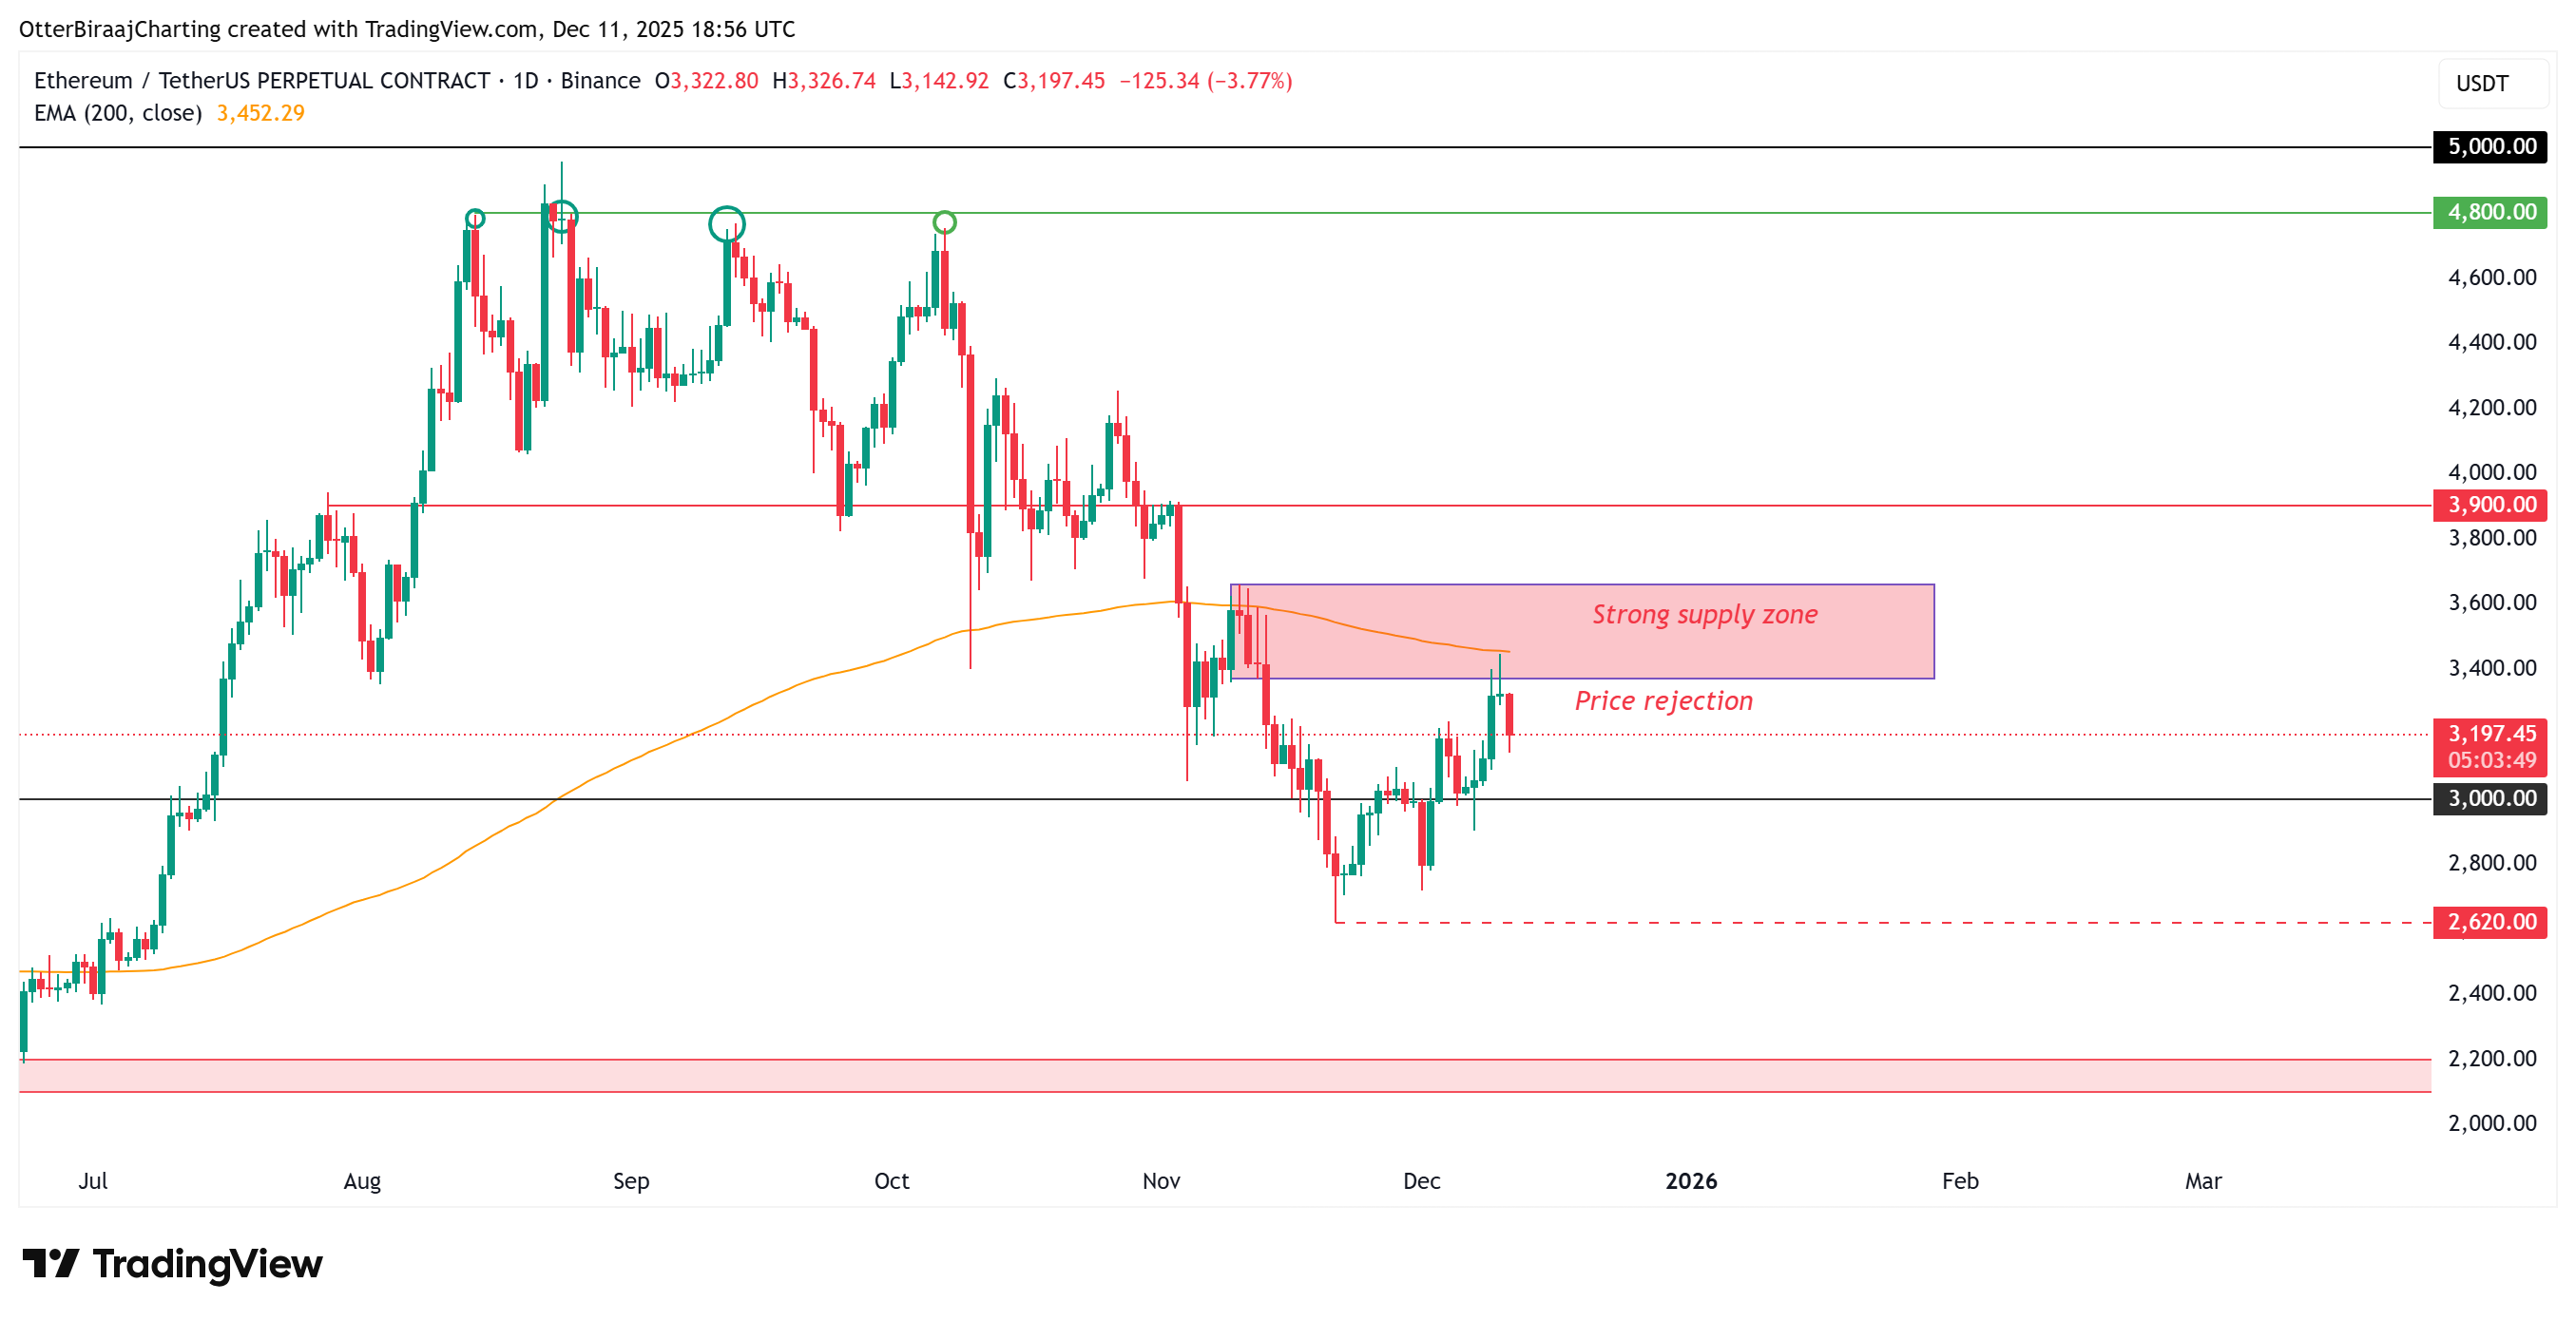 Ethereum one-day chart. Source: Cointelegraph/TradingView
ETF Inflows Rebound Amid Trader Caution
Reports from Glassnode indicate that spot ETH ETFs are finally showing ’the first signs of life’ following weeks of withdrawals. The 28% growth in total net ETF assets since late November hints at increasing demand as the year closes.
However, this bounce back is minimal relative to the $32 billion peak observed in early October, suggesting that considerable institutional confidence has yet to return.
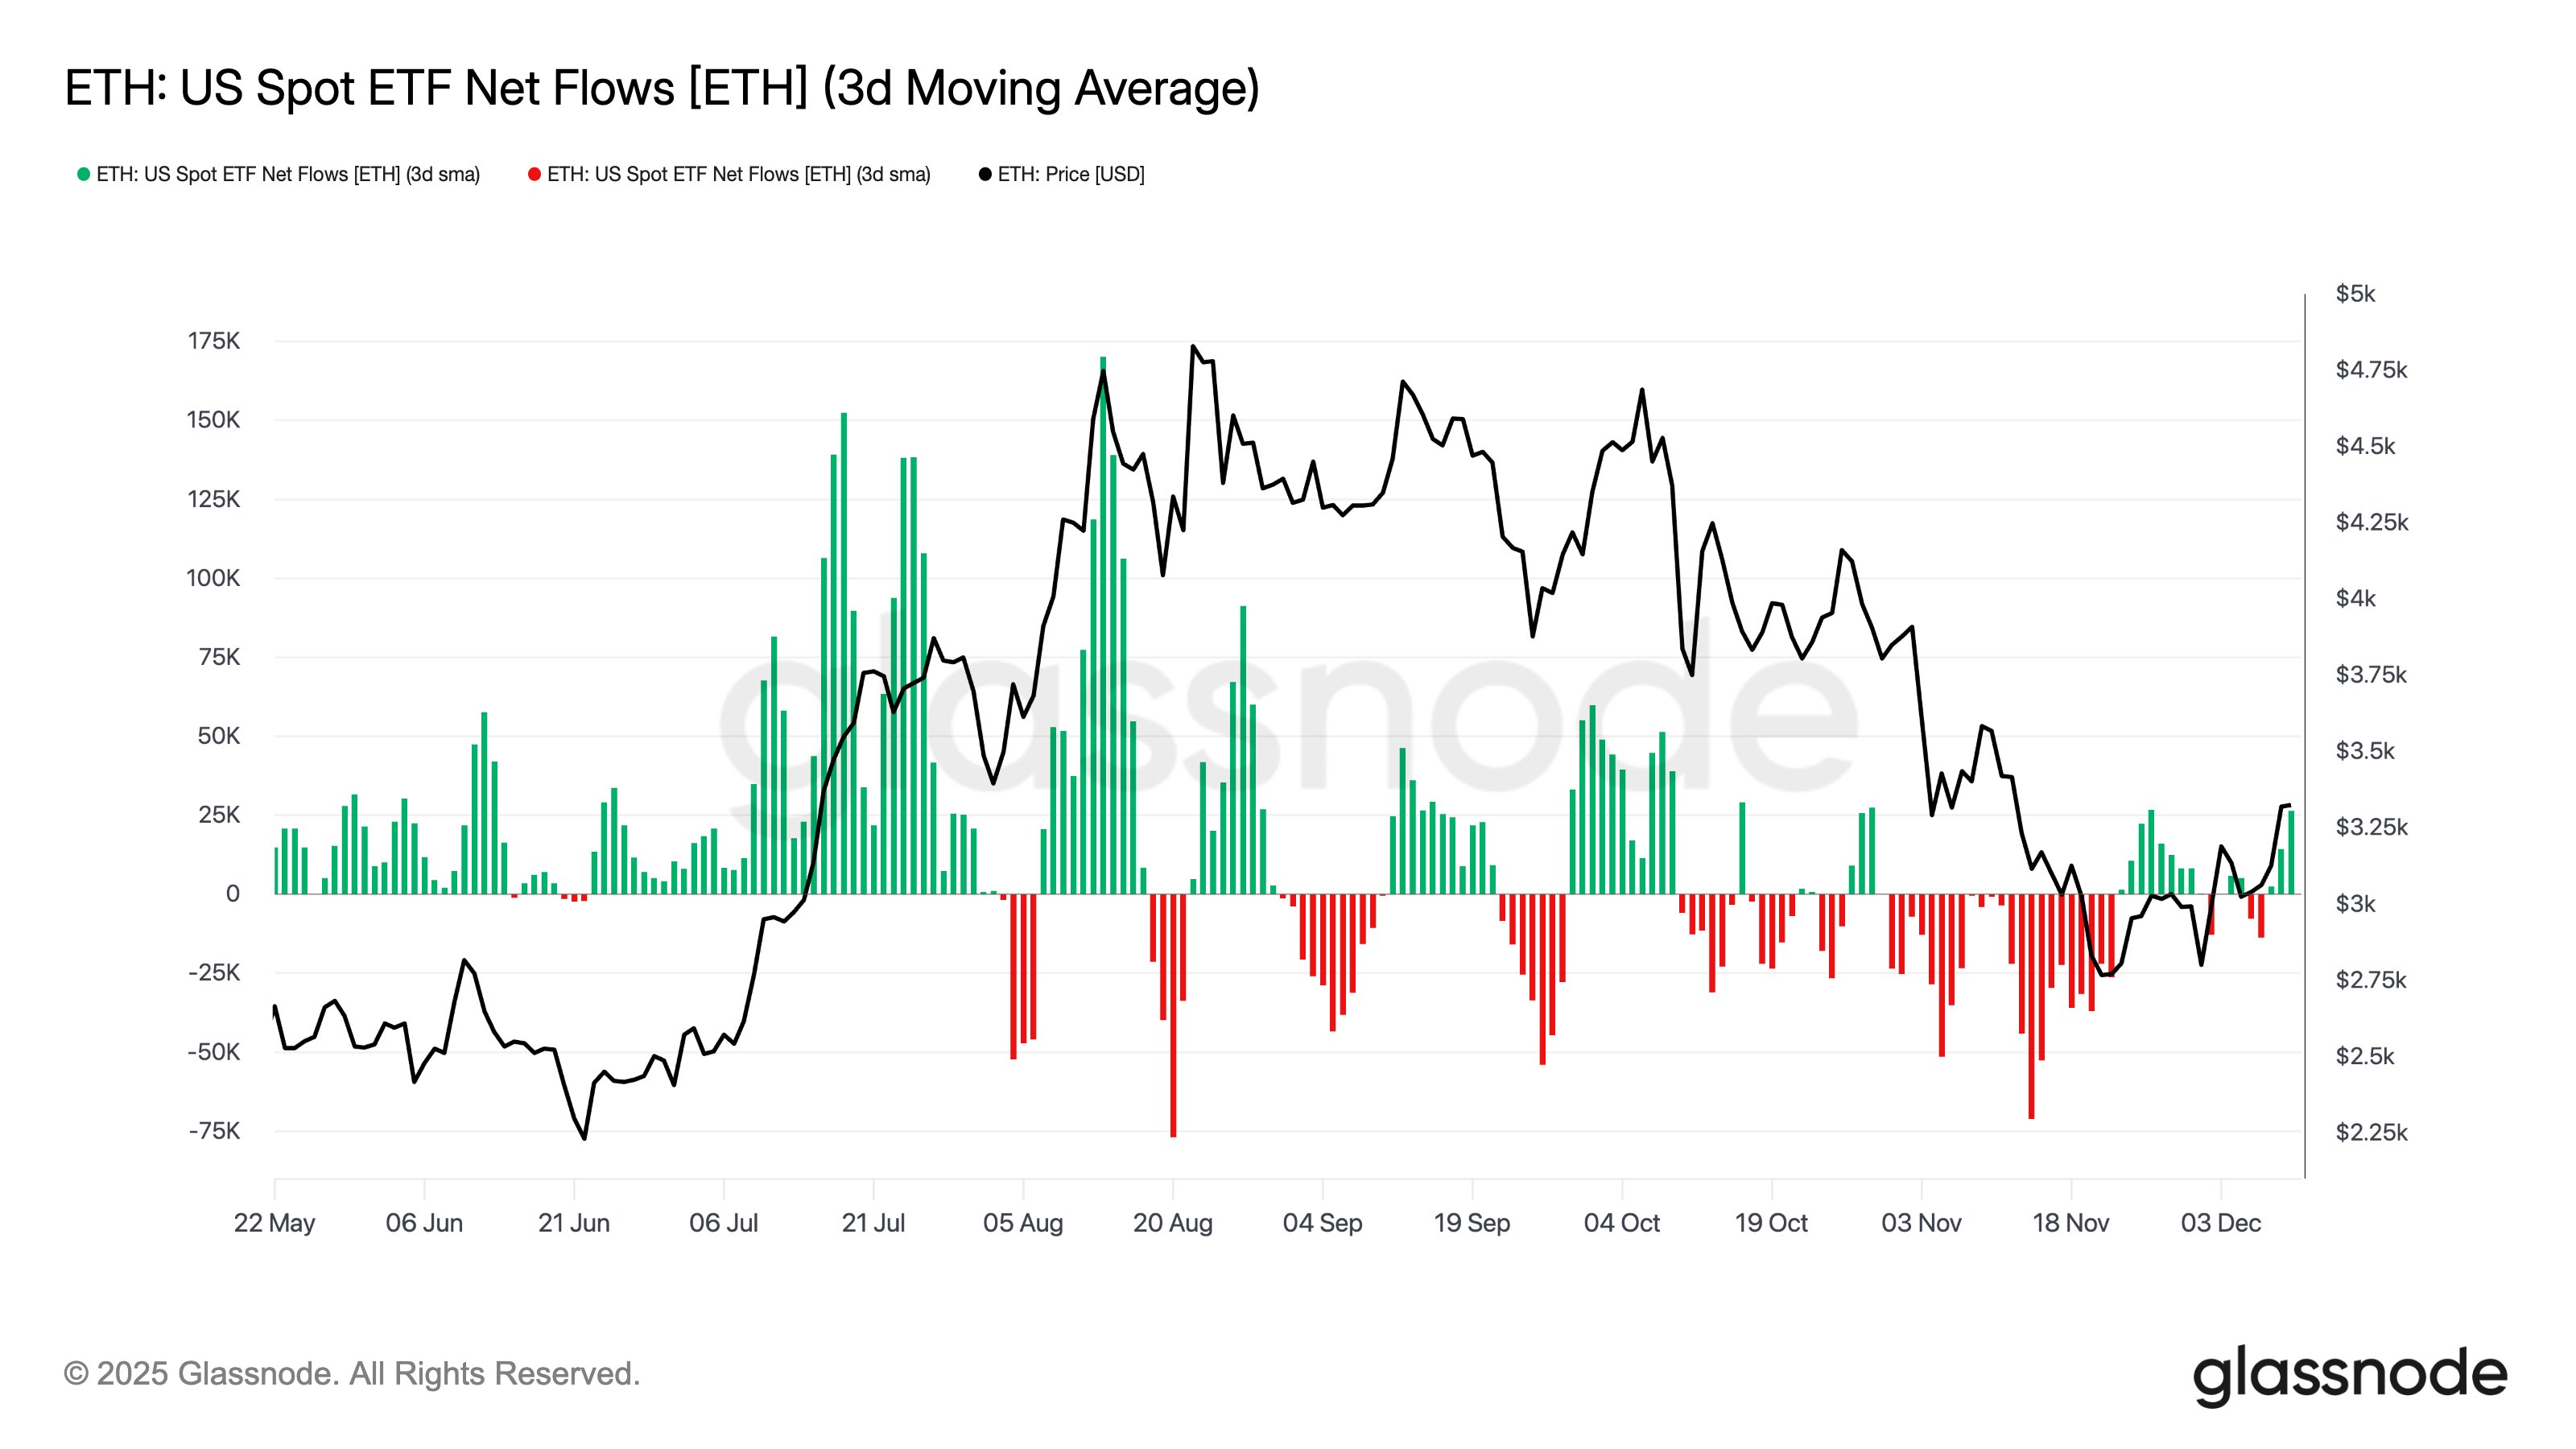 Spot ETH ETF net flows. Source: Glassnode
Data from CryptoQuant extends this narrative, revealing that while the net taker volume remains negative at -$138 million, the shift from October’s -$500 million indicates a significant change in market dynamics. The market was previously dominated by aggressive sellers during the September-October decline, but that trend appears to be shifting.
With the 30-day moving average of net taker volume reflecting a rising trend in lows—last seen in early 2025 before a major ETH price rally—the outlook appears cautiously optimistic for a potential bullish breakout in the coming weeks.
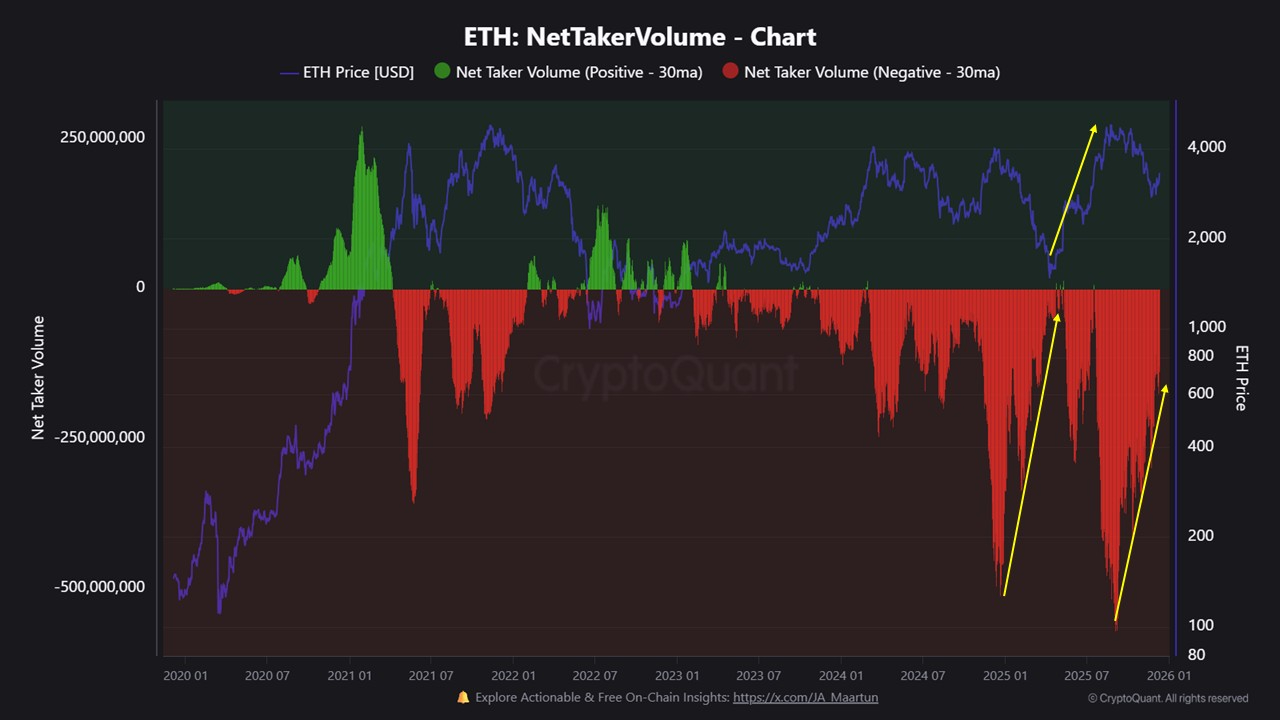 Ether net taker volume data. Source: CryptoQuant
Current ETH Price Testing Support
ETH is presently testing the $3,100-$3,180 order block, which may act as a support zone. Although the price remains within its upward trend channel, momentum seems to be cooling, indicating a critical point in market structure.
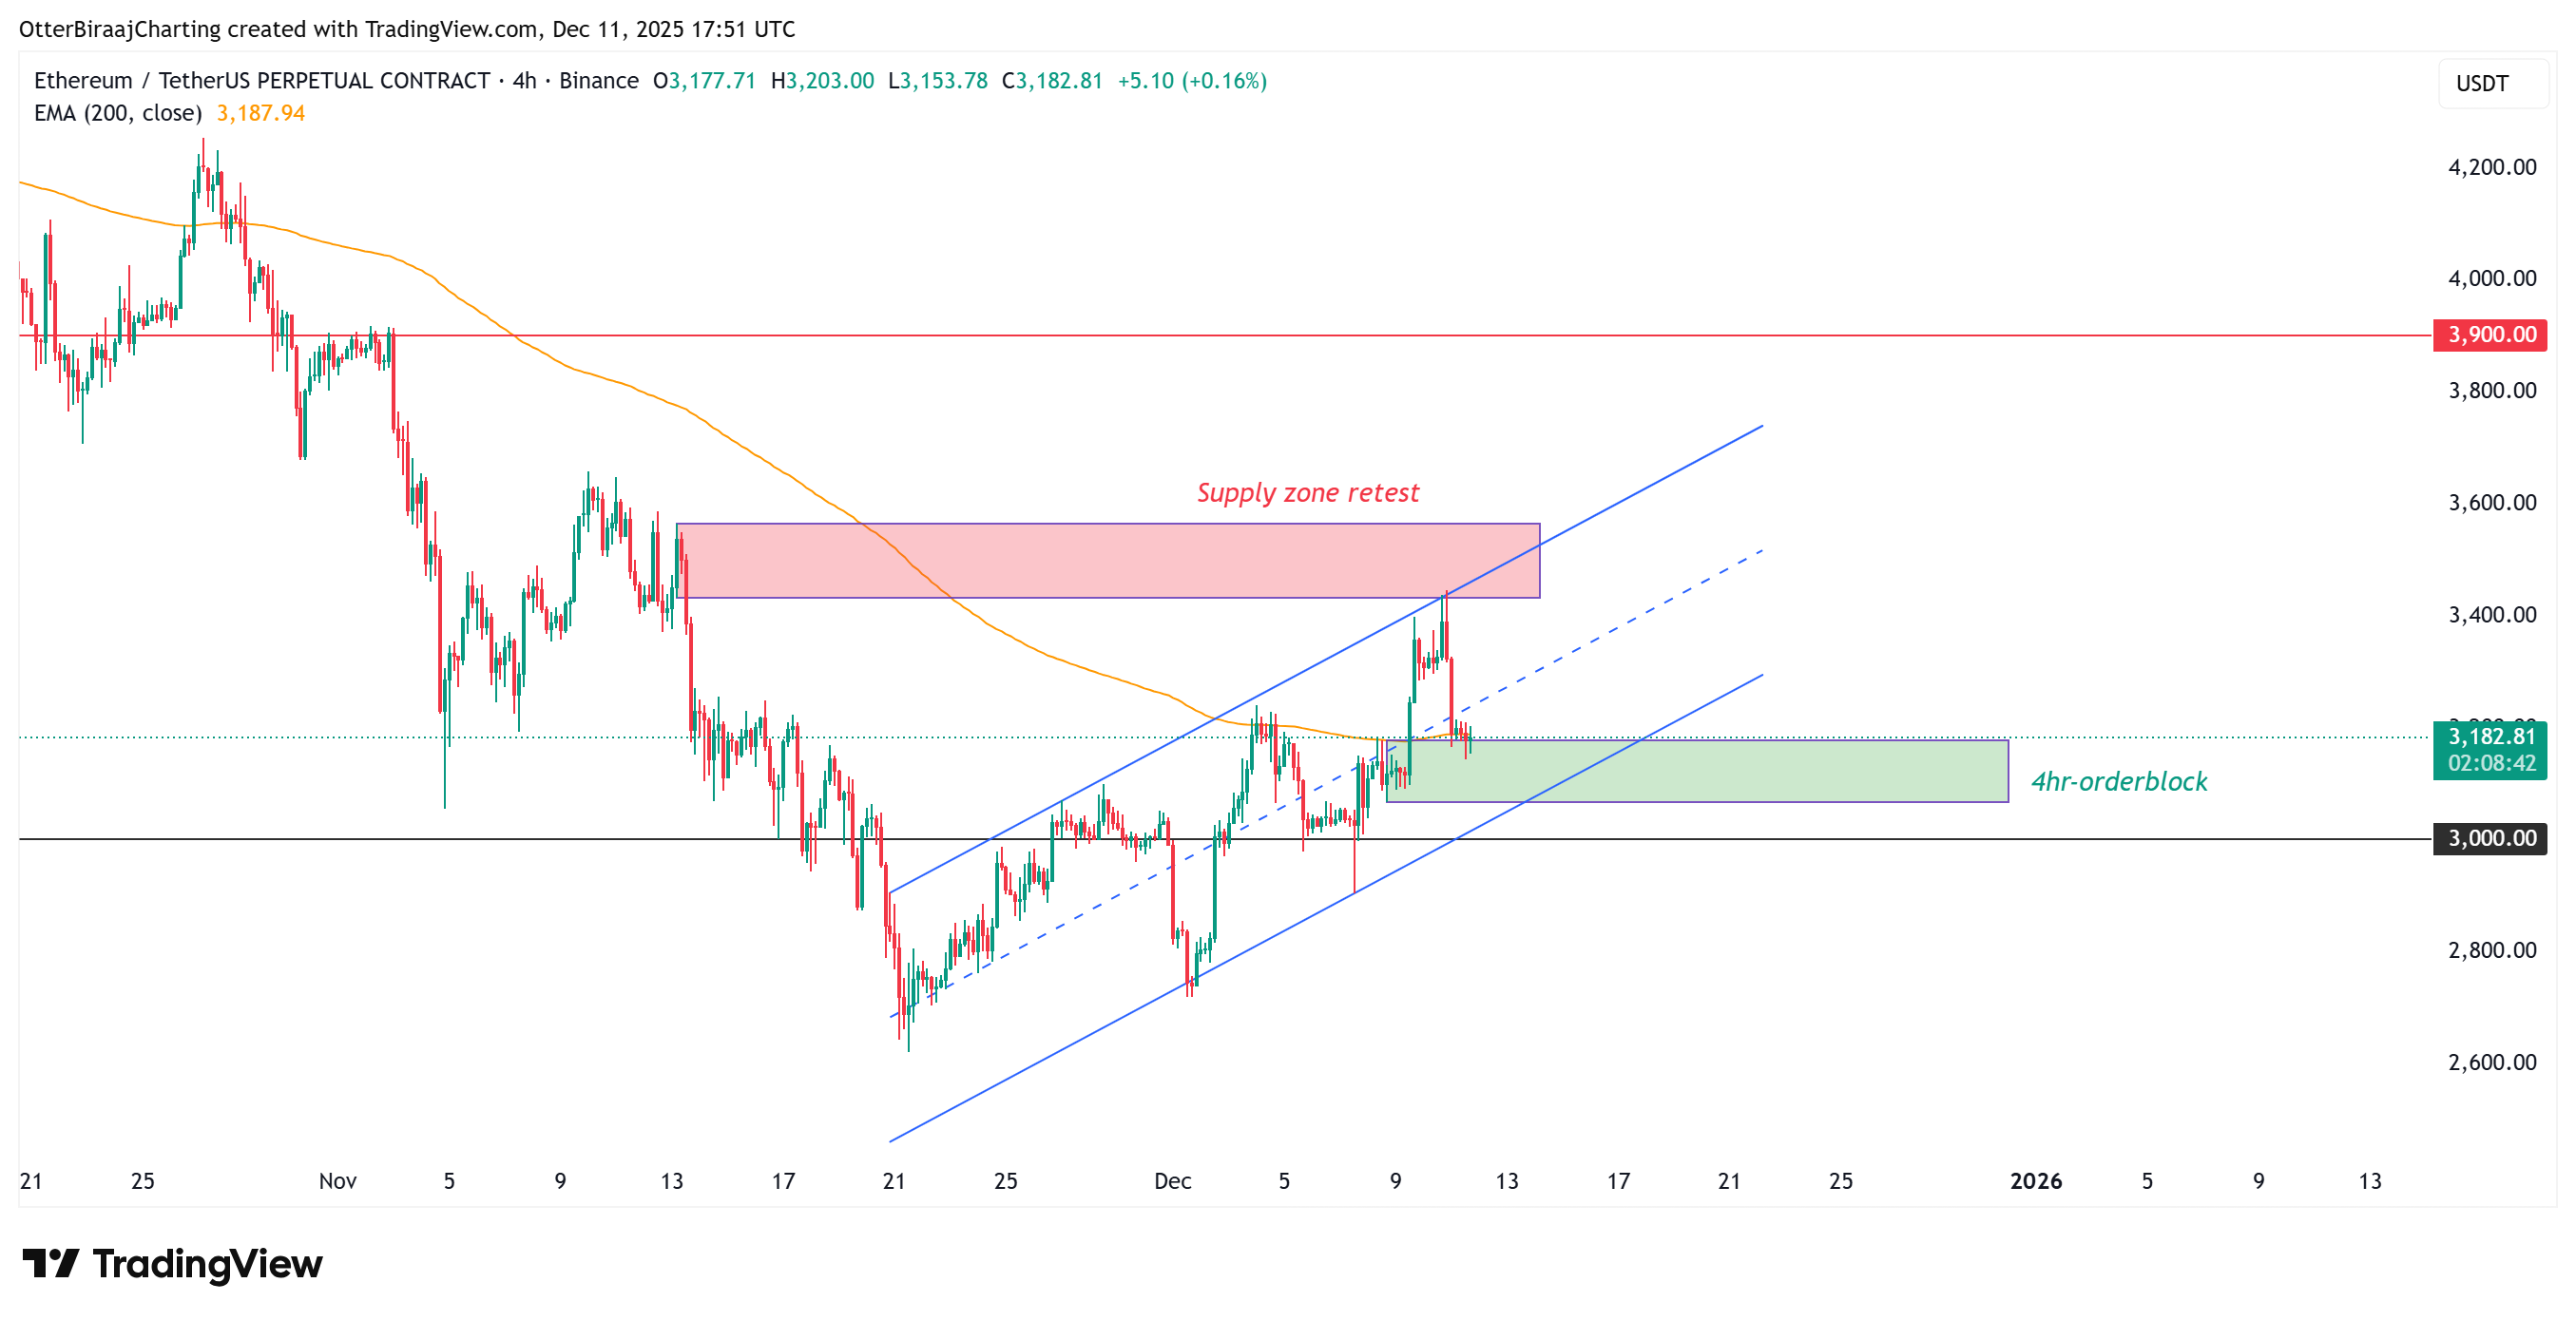 Ether four-hour chart. Source: Cointelegraph/TradingView
In a bullish scenario, maintaining support at this demand block could see ETH rebound towards the daily 200-day EMA. A decisive breach above $3,450 may invalidate any recent rejection and pave the way for a climb towards the $3,900 resistance level.
Conversely, if the price falls below the upward channel support, it could signal bearish confirmation and lead to a retest of the $3,000 support zone.
Data from Hyblock further supports a neutral yet precarious outlook. Open interest has slightly declined since the last rejection, and while the funding rate is modestly positive, it remains unexaggerated, showing site buyers have not yet adopted an aggressive bullish stance.
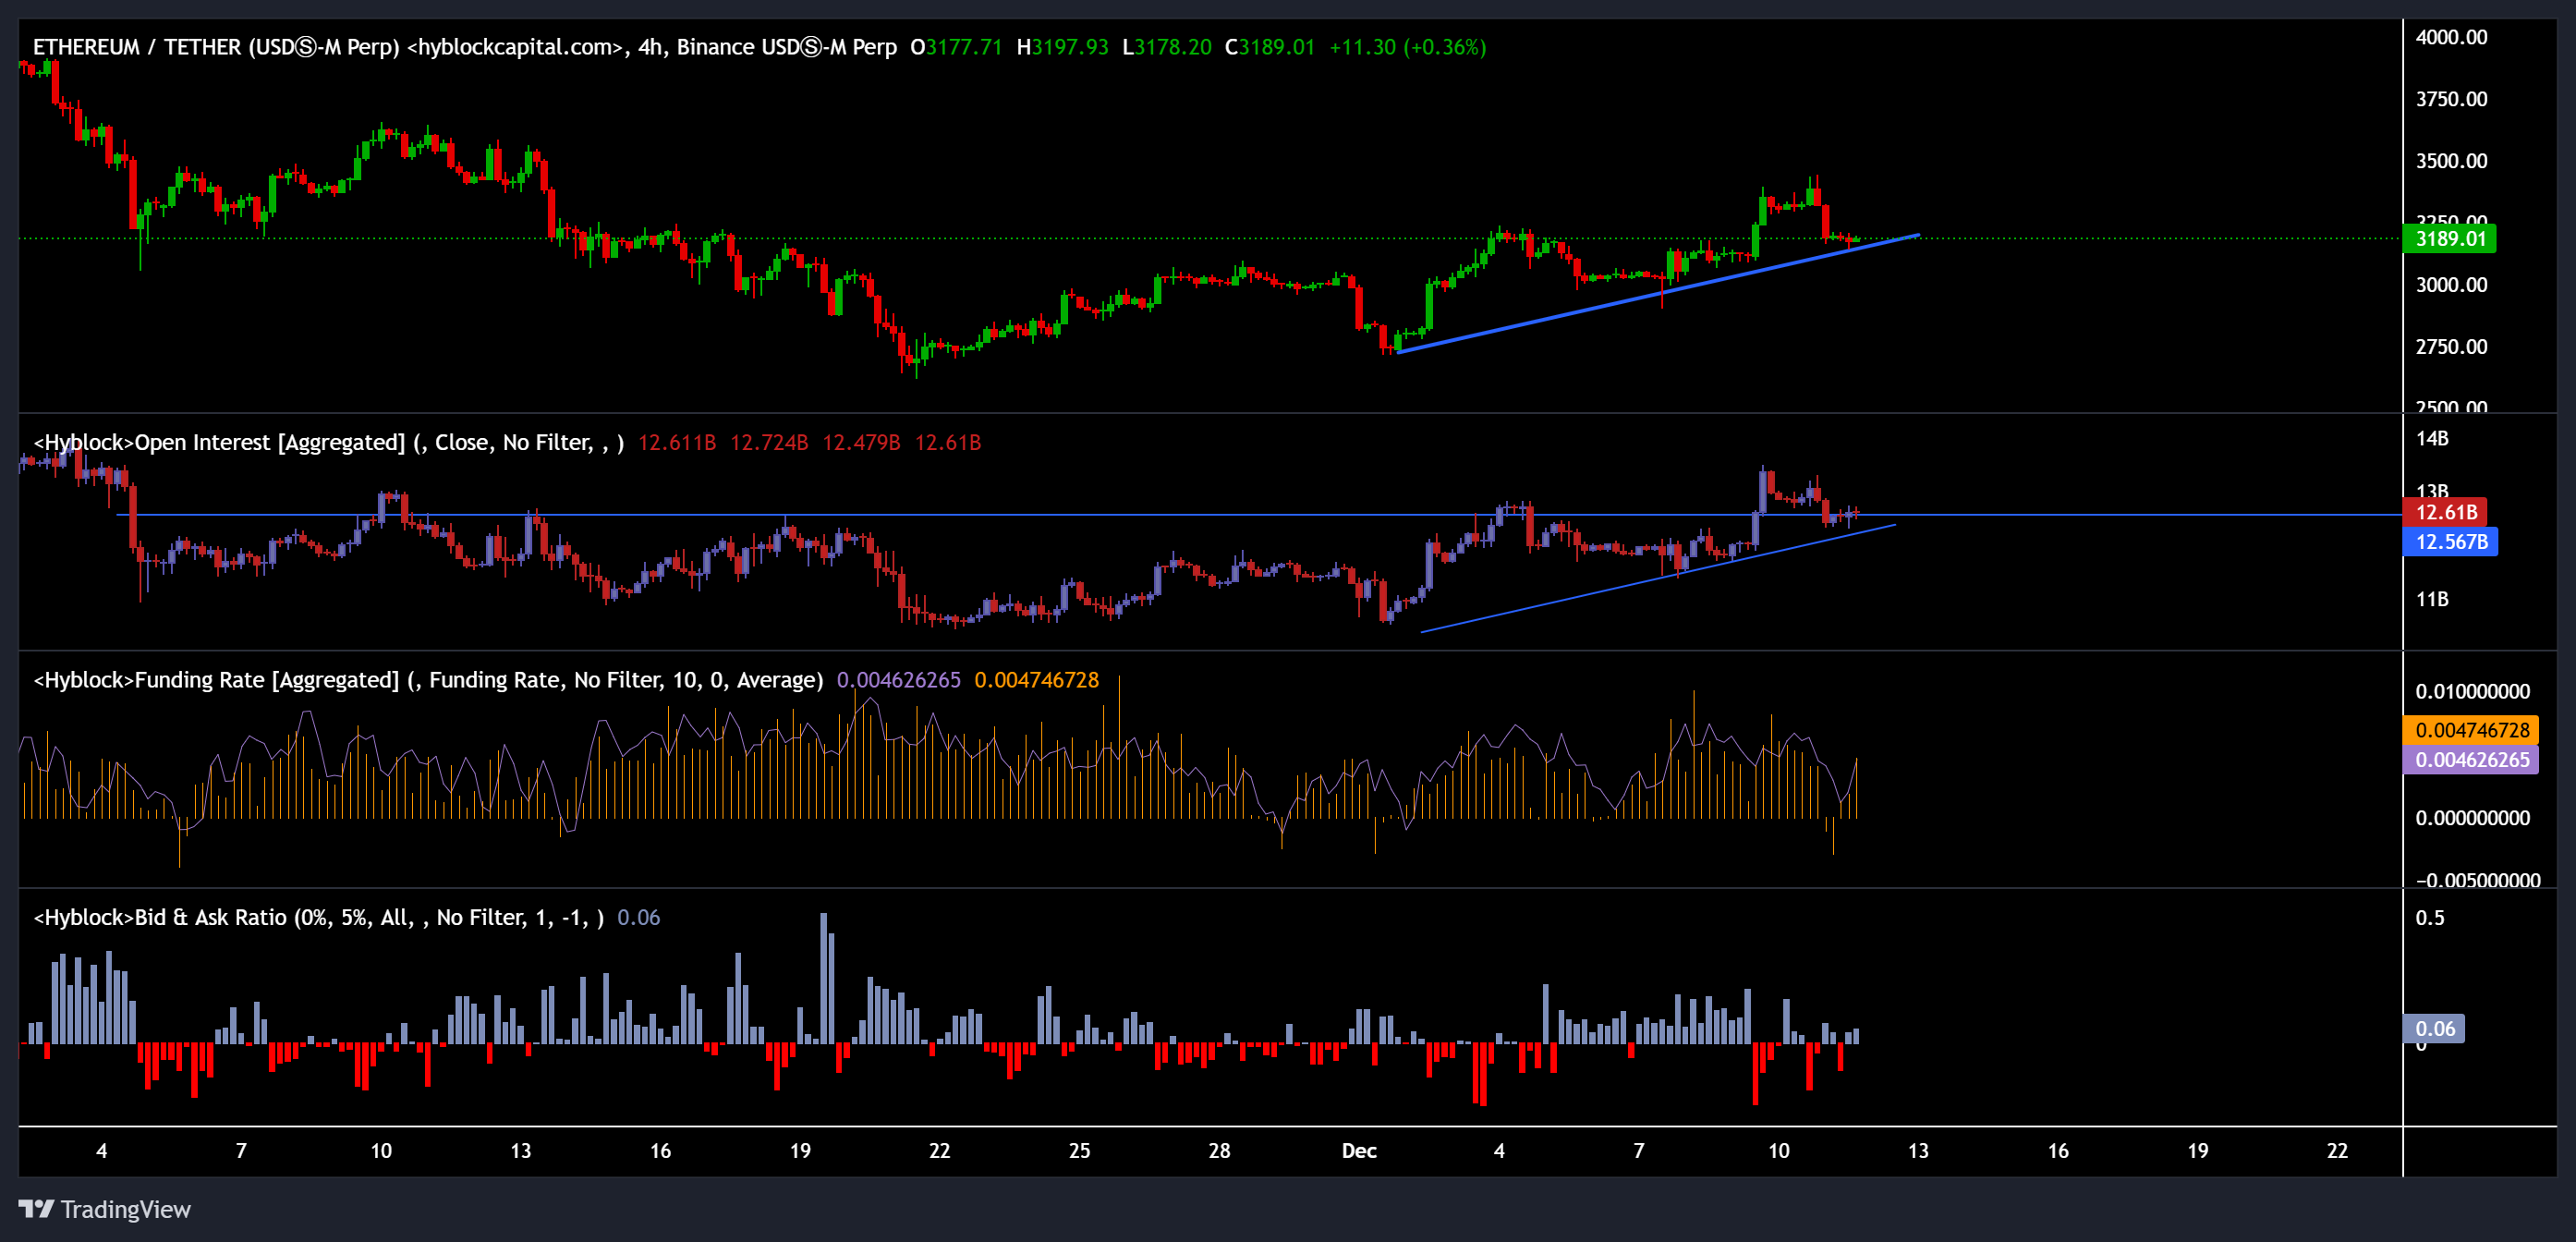 Ether futures data analysis. Source: Hyblock Capital
The next significant movement in ETH’s price will depend on whether buyers can hold the demand zone long enough for the improving taker flows and ETF interest to support a sustained upward trend.
This piece does not provide financial advice. All investments carry risks, and readers are encouraged to perform their own research before making decisions.
