


Bitcoin and several prominent altcoins have retreated from their overhead resistance levels, highlighting the continuous presence of bears at these range tops.
Key points:
- The inability of bulls to keep Bitcoin above $94,050 has led to renewed sell-offs, potentially dragging the price down to $87,700 and further to $84,000.
- A majority of leading altcoins are facing pressure, with the possibility of testing recent lows.
Bitcoin (BTC) is confined in a limited range between $94,588 and $89,260, reflecting a standoff between bulls and bears. The prediction markets suggest a mere 30% probability of BTC reaching $100,000 before the year concludes.
According to crypto analyst Darkfost, BTC is struggling to recover due to insufficient liquidity inflow, particularly from stablecoins. For BTC to embark on a genuine bullish trend, the crypto markets must attract fresh liquidity.
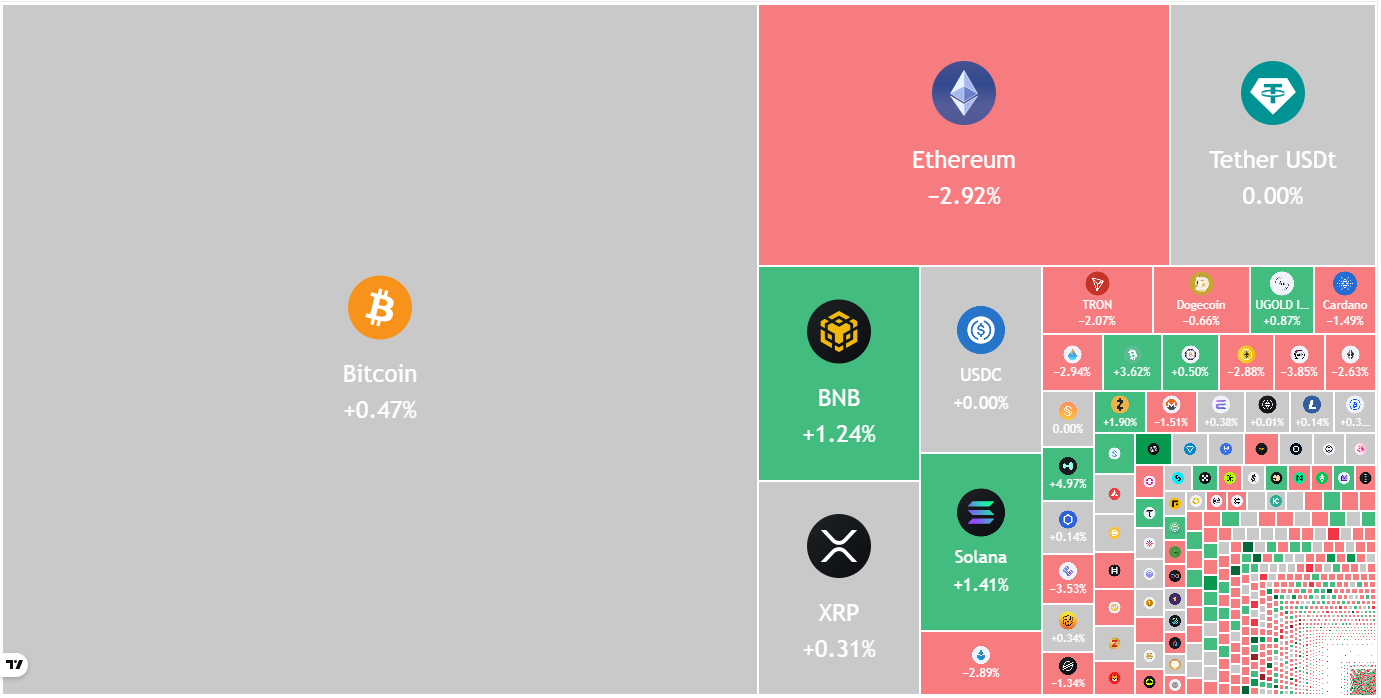 Crypto market data daily view. Source: TradingView
Some analysts expect BTC to slide below the recent low of $80,600. Trader Roman remarked on X that BTC is likely to drop to $76,000, suggesting that declining interest rates won’t halt this descent.
Support and Resistance Levels
What are the essential support and resistance levels to monitor for BTC and major altcoins? Let’s dive into the charts of the top 10 cryptocurrencies to uncover insights.
Bitcoin Price Forecast
BTC is facing resistance at the 50% Fibonacci retracement level of $94,050, pointing to active bears at elevated levels.
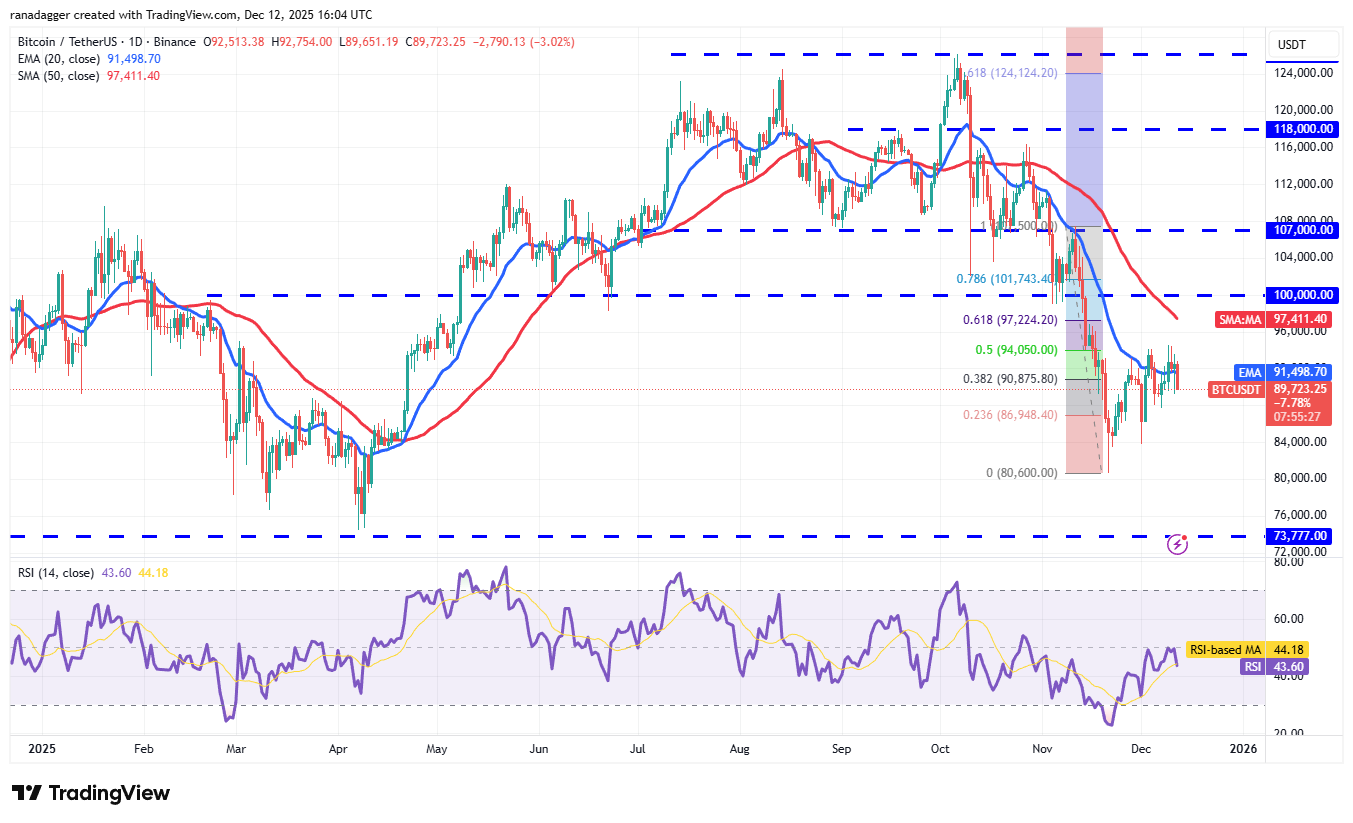 BTC/USDT daily chart. Source: Cointelegraph/TradingView
Support is positioned at $87,700 and further at $84,000. A breakdown below the $84,000 threshold could lead back to the Nov. 21 low of $80,600.
To indicate strength, buyers will need to push Bitcoin above the $94,050 resistance level. If successful, the BTC/USDT pair could rally to the 50-day simple moving average (SMA) at $97,411.
An upward movement is likely to face substantial selling resistance between the 50-day SMA and the significant psychological barrier of $100,000. A close above $100,000 would signal that bulls are reclaiming control.
Ether Price Projection
Ether (ETH) recently pulled back from the $3,350 mark, with bears trying to solidify the price under the 20-day exponential moving average (EMA) at $3,125.
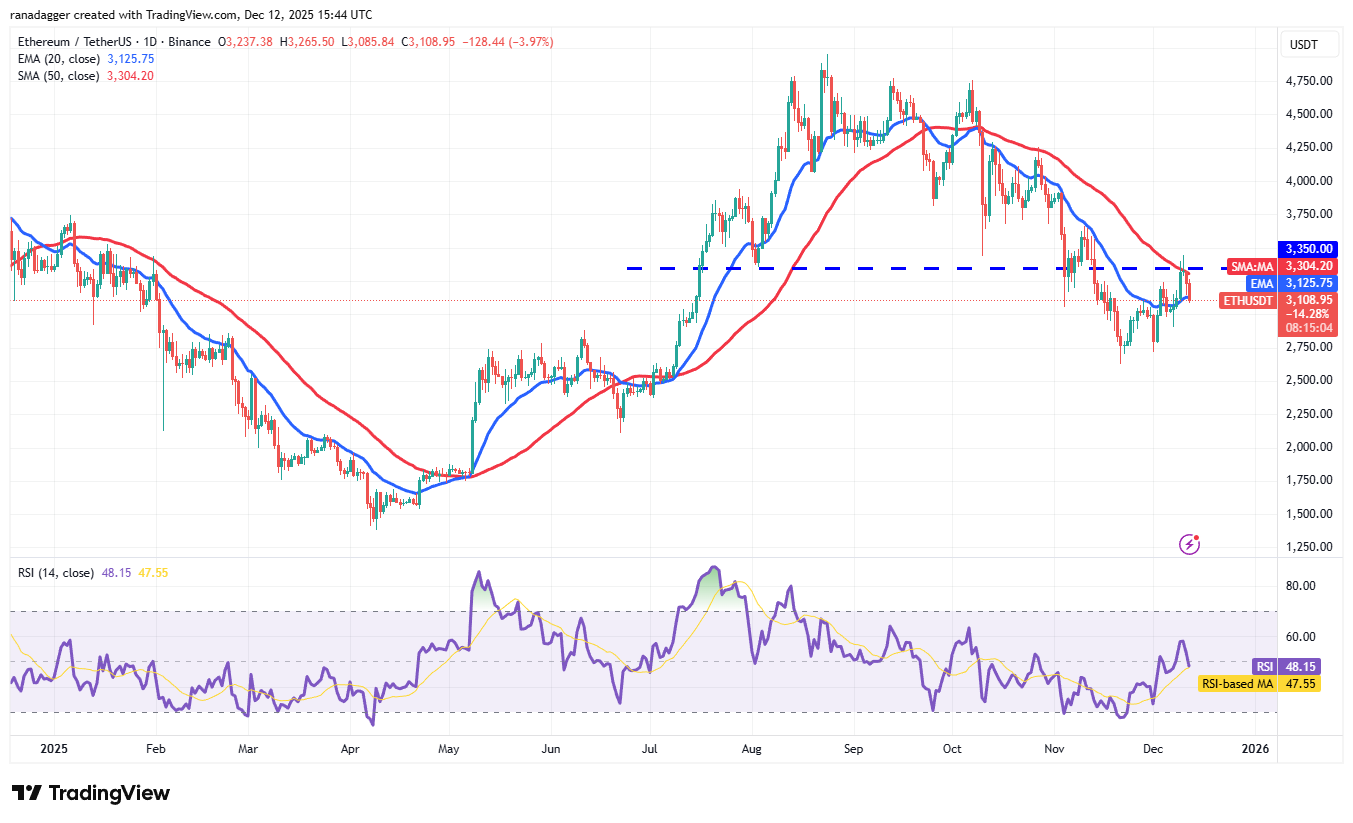 ETH/USDT daily chart. Source: Cointelegraph/TradingView
If they succeed, it suggests that sellers remain active. The Ether price may dip to $2,907 and eventually reach $2,716. Conversely, if the price rebounds and surpasses $3,350, it could signal the beginning of a new upward trend, potentially reaching $3,918 and later $4,250.
BNB Price Analysis
BNB (BNB) has been trading near the 20-day EMA at $892, showing a balance between buying and selling pressures.
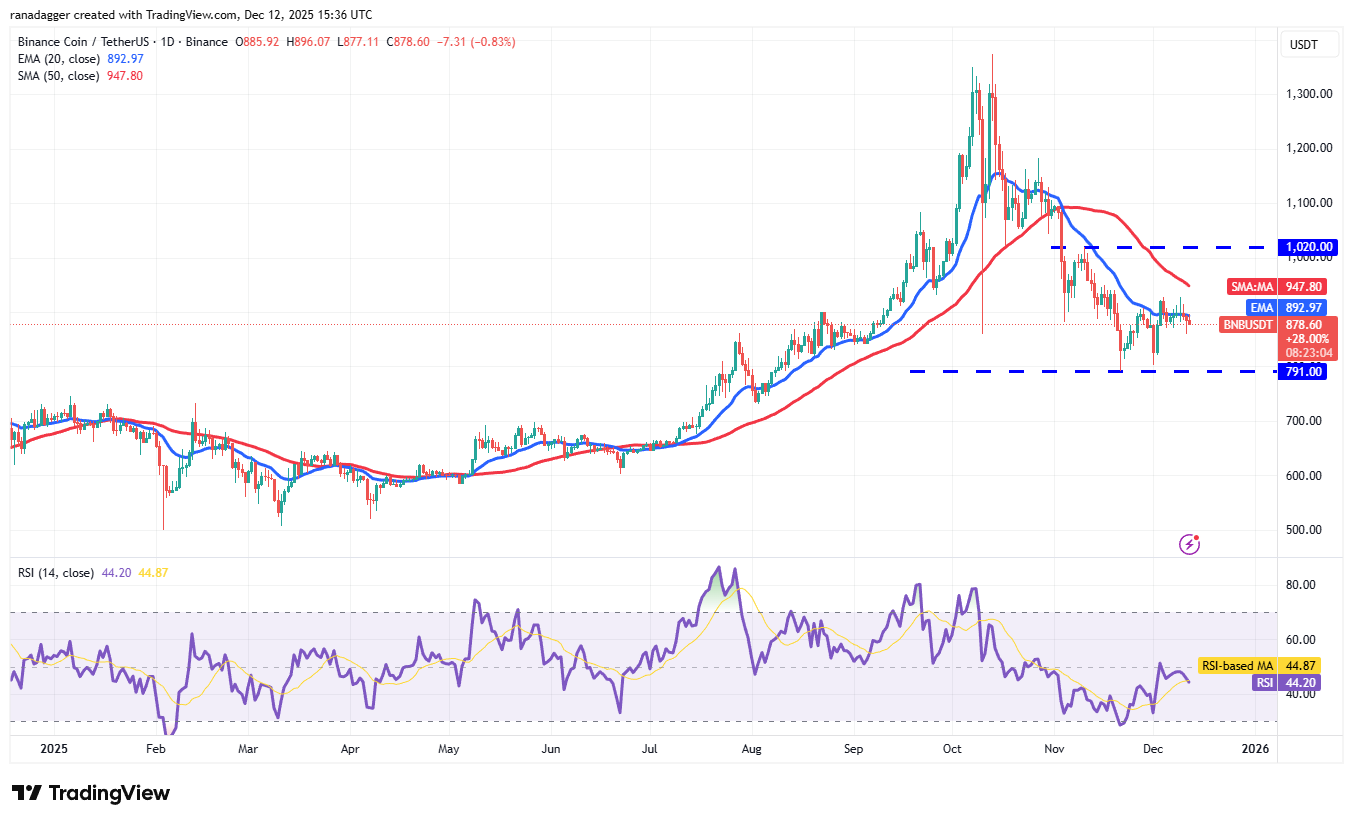 BNB/USDT daily chart. Source: Cointelegraph/TradingView
The symmetrical 20-day EMA and RSI slightly below midpoint indicate a likely range-bound action between $791 and $1,020 in the coming days. Sellers must drive the BNB price beneath $791 to commence the next leg down, which could lead to a plunge toward $730. Conversely, a closing above $1,020 may suggest the correction is over, allowing a rise to $1,182.
XRP Price Outlook
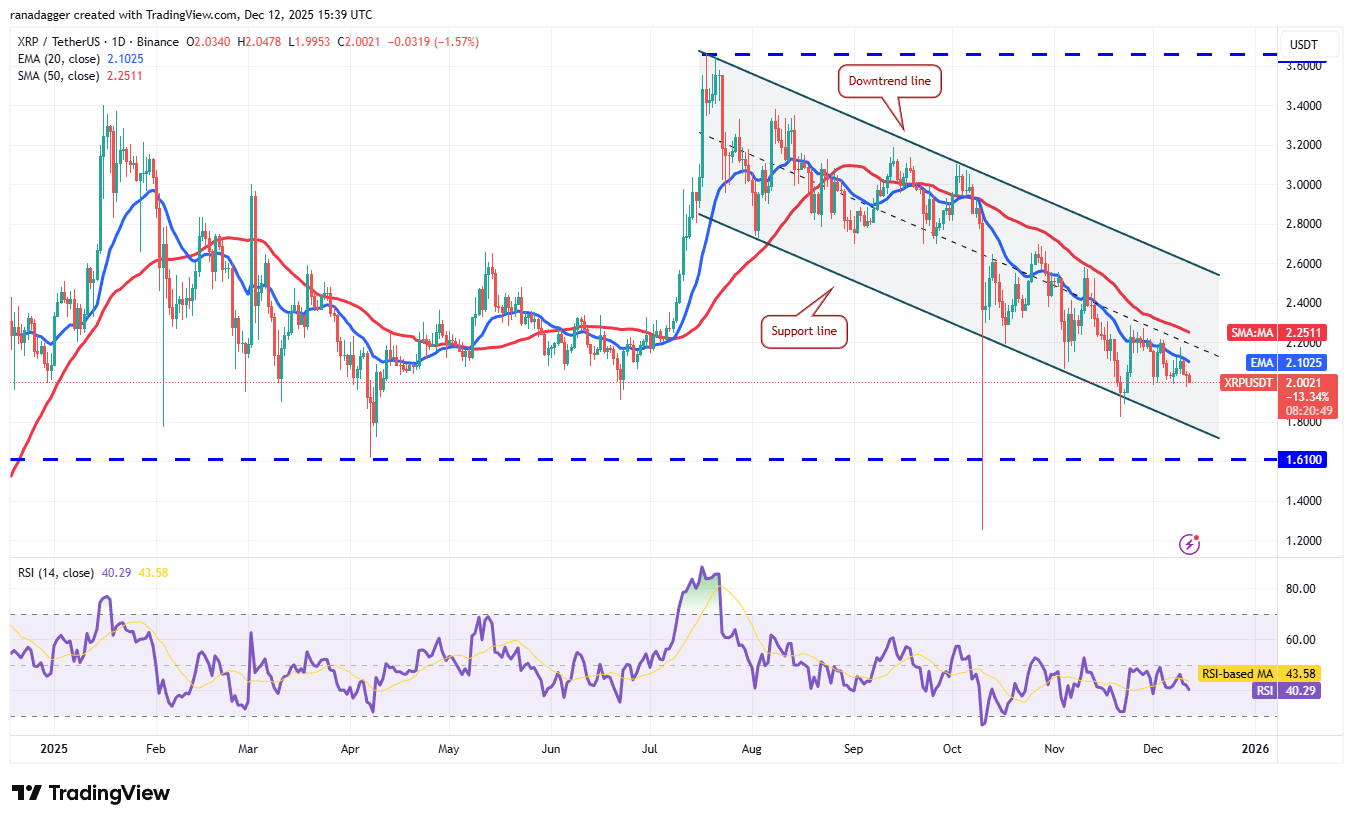
XRP (XRP) remains trapped in a descending channel pattern, demonstrating bears’ control.
 XRP/USDT daily chart. Source: Cointelegraph/TradingView
For bulls to regain momentum, they must push XRP above the 50-day SMA ($2.25). If successful, the XRP/USDT pair may rally towards the downtrend line, a key resistance point to watch. A close above this line could signal bulls retaking command.
Conversely, bears need to push the price below the $1.98 threshold to enable a decline to the support line and down to the crucial mark of $1.61.
Solana Price Projection
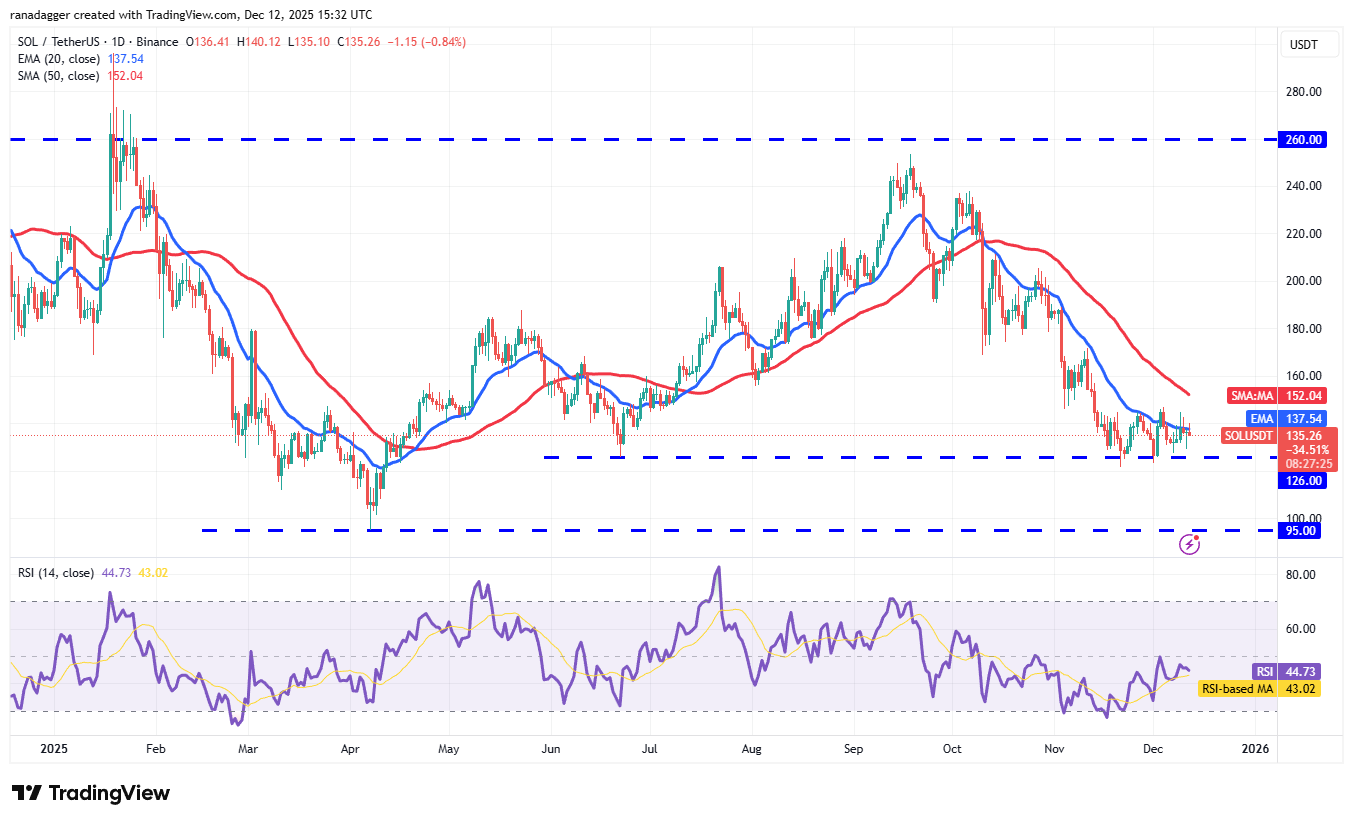
The long tail from Solana’s (SOL) Thursday candlestick indicates vigorous defense of the $126 level by bulls.
 SOL/USDT daily chart. Source: Cointelegraph/TradingView
For a potential trend reversal, bulls must elevate the Solana price above the 50-day SMA ($152). If successful, the SOL/USDT pair could climb to $172 and subsequently to $190. Alternatively, a drop and closure beneath $126 would signal a resumption of the downward movement, potentially plummeting to $100 and then to robust support at $95.
Dogecoin Price Insight
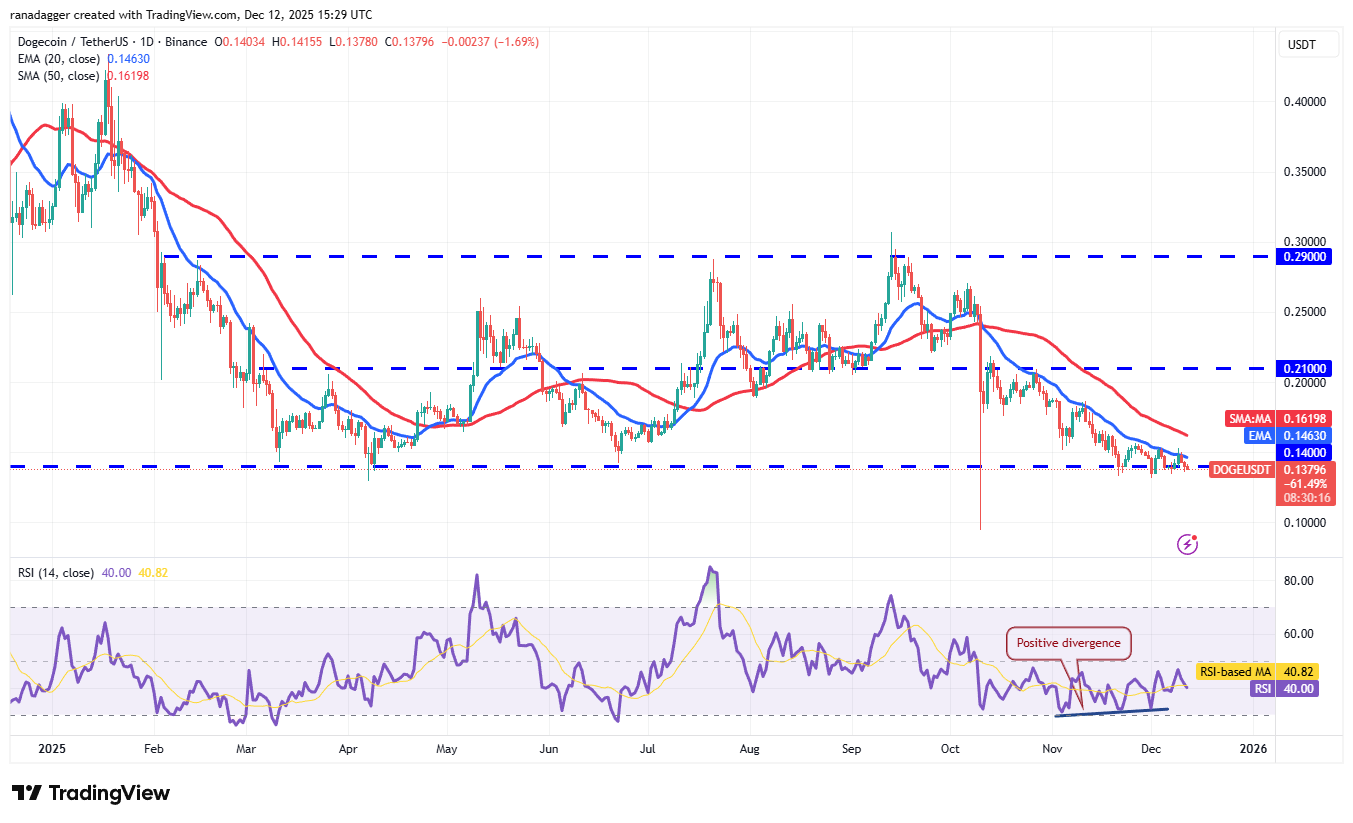
Dogecoin (DOGE) fell from the 20-day EMA ($0.14) Wednesday, revealing selling pressure from bears on minor rallies.
 DOGE/USDT daily chart. Source: Cointelegraph/TradingView
If the price drops below the $0.13 support, it may signify the onset of a fresh downtrend, sending the DOGE/USDT pair down to the October 10 low of $0.10, likely attracting buyers. The first signal of strength will emerge from a break and close above the 20-day EMA, indicating that bulls are firmly defending the $0.14 level. The Dogecoin price could then rise to the 50-day SMA ($0.16) and potentially reach $0.19.
Cardano Price Evaluation
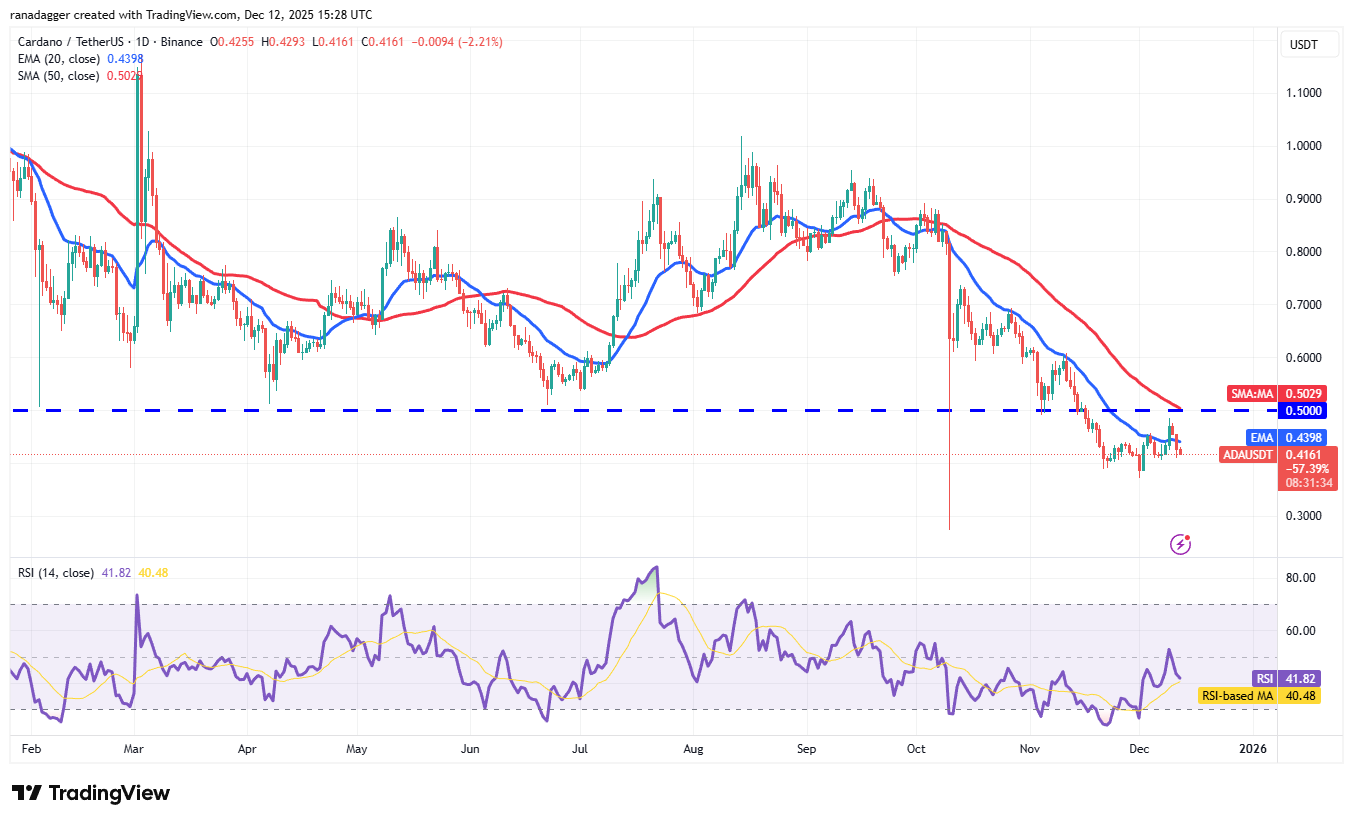
Cardano (ADA) retraced from the resistance level of $0.50 on Wednesday, displaying bears’ intent to flip this level into resistance.
 ADA/USDT daily chart. Source: Cointelegraph/TradingView
A flattened 20-day EMA ($0.44) combined with the RSI in negative territory suggests a slight advantage for bears. Support can be found at $0.40 and $0.37. If sellers push the Cardano price under $0.37, the ADA/USDT pair could plummet to $0.31 and possibly reach the October 10 intraday low of $0.27. To signal a recovery, buyers need to sustain the price above $0.50. If successful, the pair may rally to $0.60 and later to $0.70.
Related: Ether price soared 260% during a previous similar event: Can ETH hit $5K?
Bitcoin Cash Price Analysis
Bitcoin Cash (BCH) rebounded from the 20-day EMA ($560) on Thursday, reflecting a bullish sentiment.
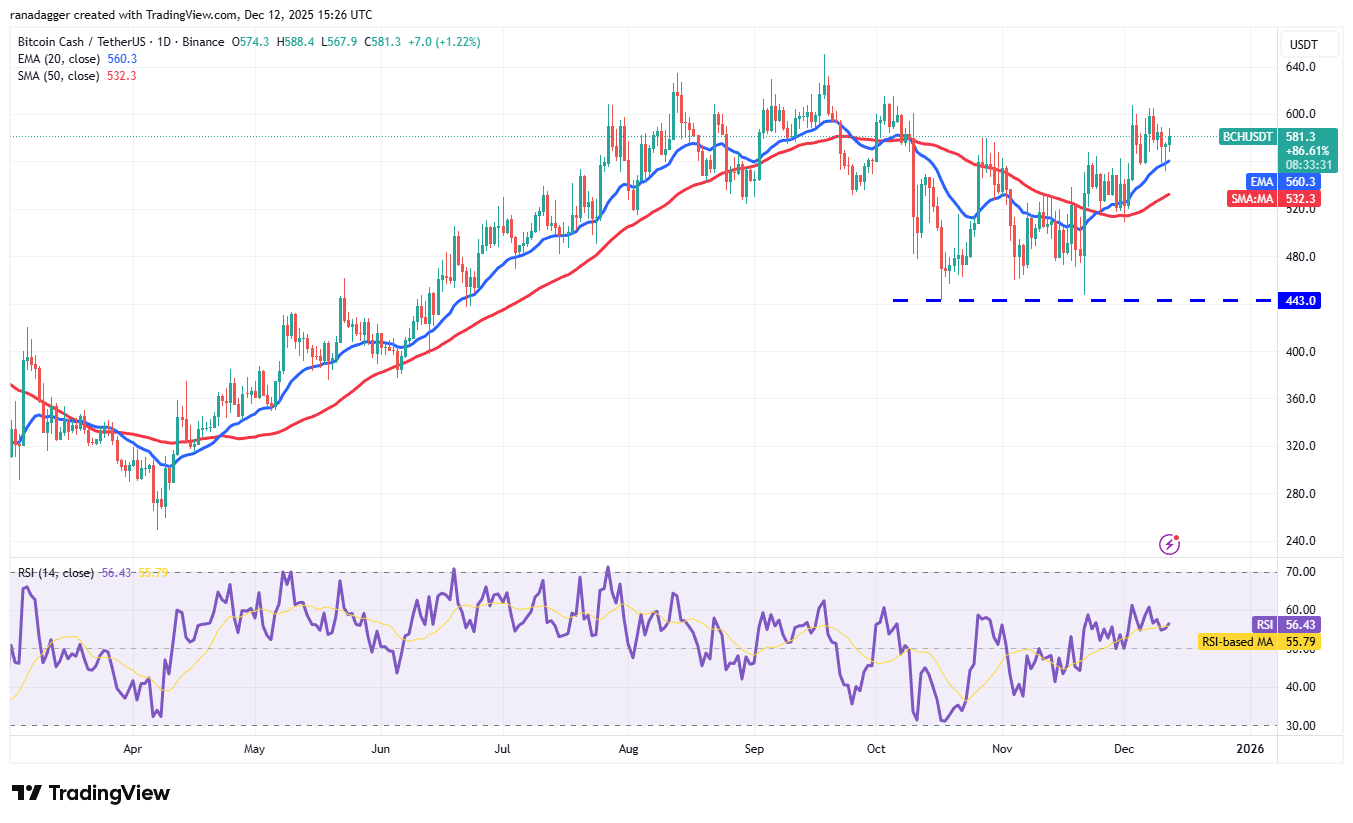 BCH/USDT daily chart. Source: Cointelegraph/TradingView
Bulls will work towards pushing the Bitcoin Cash price above $607 to challenge overhead resistance at $651. Sellers will mount a strong defense at $651; a breach above this level opens pathways for a rally to $720. Conversely, bears must drive the price below the moving averages to secure their advantage, potentially leading to a range between $607 and $443.
Hyperliquid Price Prediction
Sellers attempted to push Hyperliquid (HYPE) prices down on Thursday, yet the lengthy tail on the candlestick points to aggressive buying by bulls.
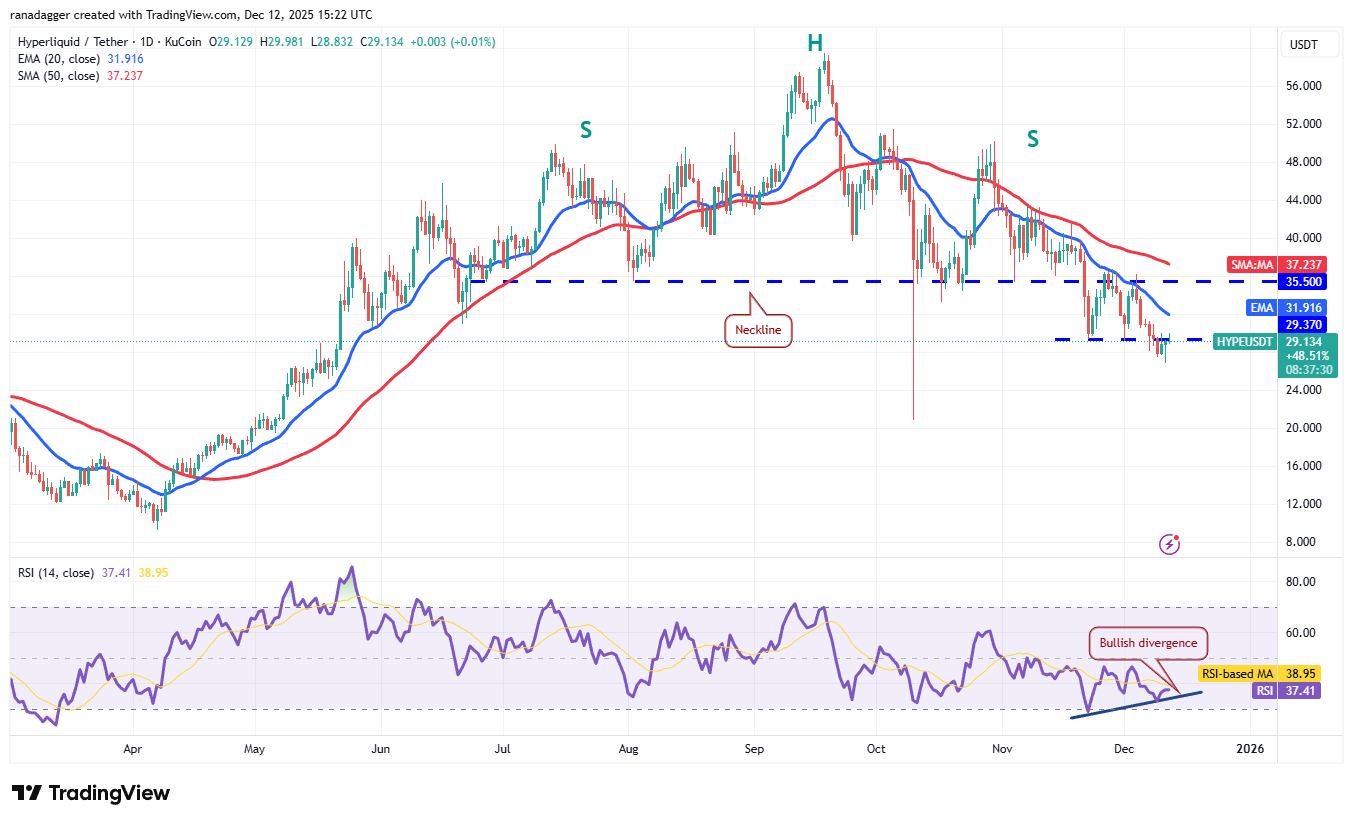 HYPE/USDT daily chart. Source: Cointelegraph/TradingView
The HYPE/USDT pair could reach the 20-day EMA ($31.91), a critical level. If the price sharply declines from this average, bears might try to enforce another downtrend. Conversely, a breakout above the 20-day EMA suggests diminishing selling pressure, allowing Hyperliquid prices to potentially rise to the 50-day SMA ($37.23). A closing above this average suggests the correction phase might be ending.
Chainlink Price Outlook
Chainlink (LINK) has been trading within moving averages for the last few days, denoting a balance in supply and demand.
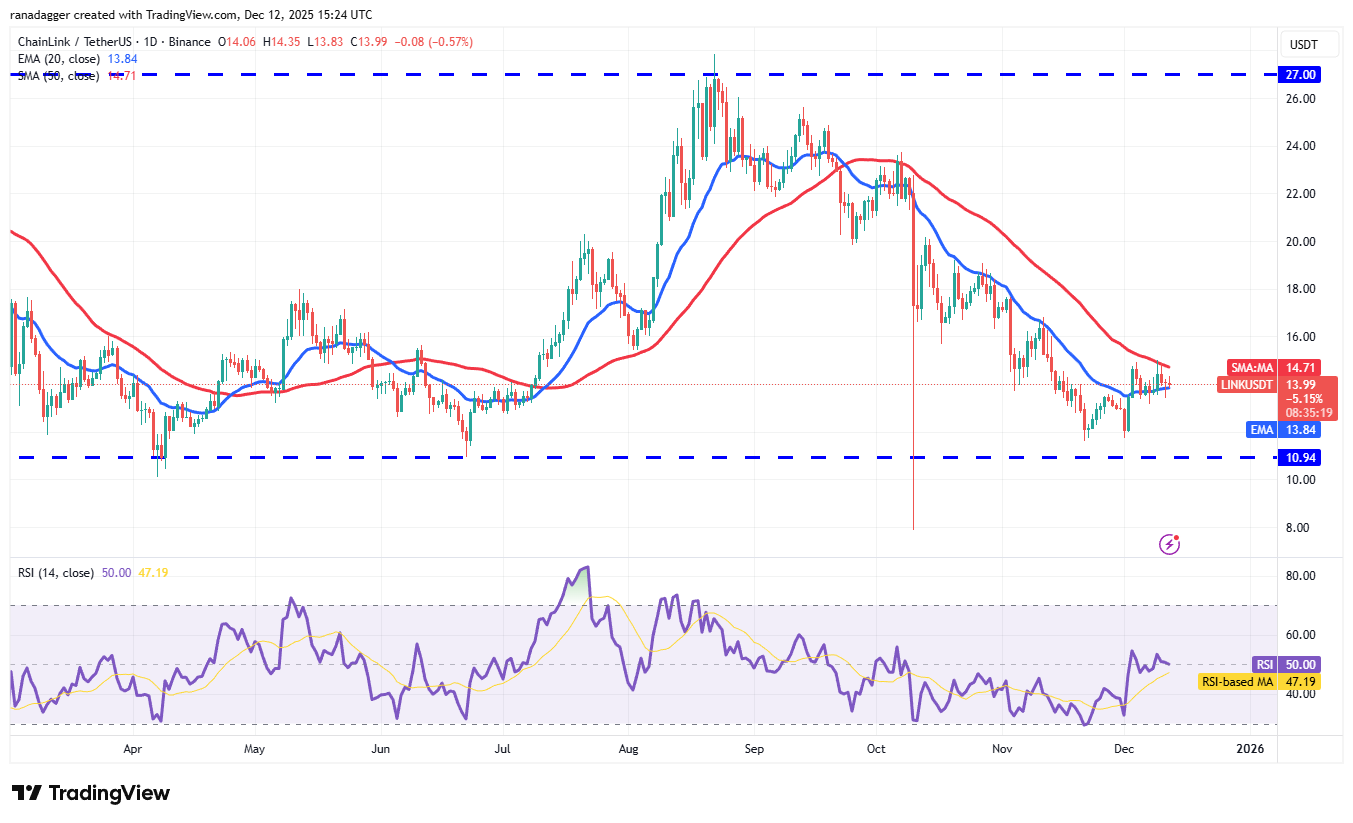 LINK/USDT daily chart. Source: Cointelegraph/TradingView
This tight range is likely to precede range expansion. If the price breaks and closes above the 50-day SMA ($14.71), it will indicate bulls have overpowered bears. This may allow the LINK/USDT pair to rise to $19.06. Alternatively, a significant dip below the 20-day EMA ($13.84) may indicate that bears are still in control, risking a drop to solid support at $10.94, where buyers are likely to step in.
This article does not contain investment advice or recommendations. Every investment involves risk, and readers should do their own research before making decisions.
