XRP Struggles: An Analysis of Ripple's Current Valuation Against USD and BTC
Ripple's XRP price shows weakness against both the US dollar and Bitcoin, with bearish signals prevailing in the market. This analysis explores the current trends and possible future scenarios.


XRP continues to experience a slow decline while the market’s focus remains on Bitcoin (BTC) and Ethereum (ETH). Despite fleeting recoveries, the overall trend remains bearish.
Technical Overview
The USDT Pair
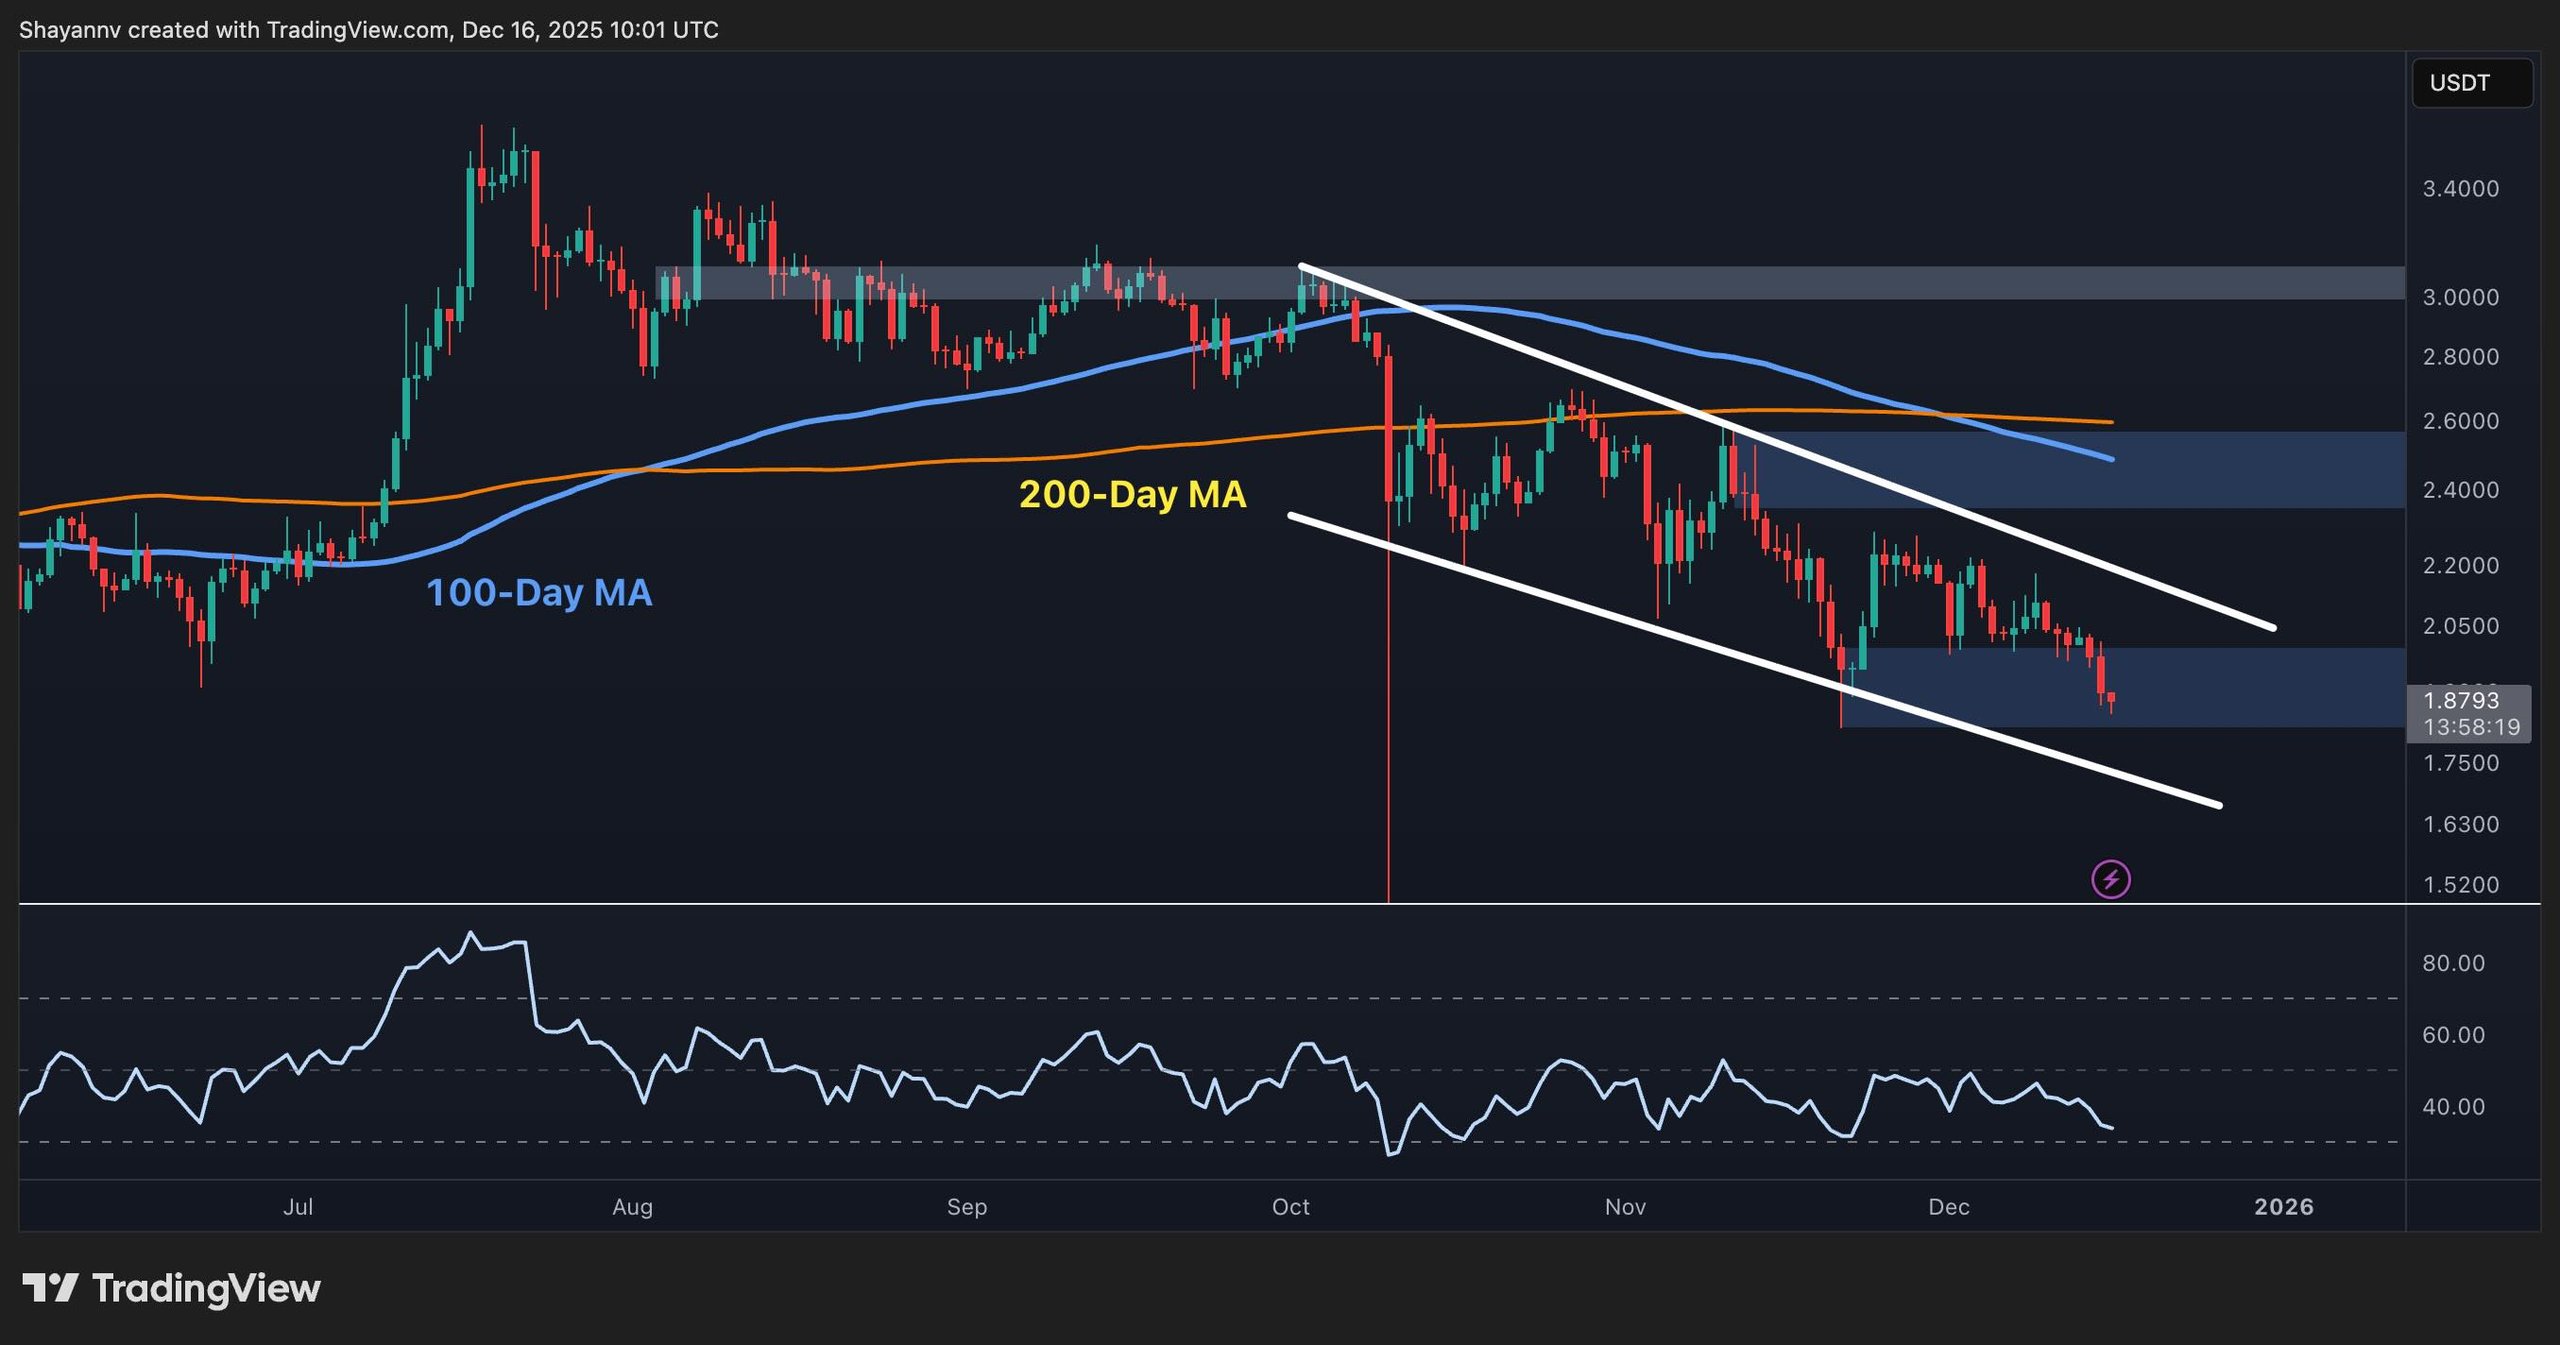
XRPUSDT is confined within a steep downward channel. The recent decrease has brought the price below $1.90, nearing the channel’s lower limit. The price pattern shows a succession of lower highs and lows, and there’s no bullish divergence observed on the RSI as of yet, indicating that momentum is lacking.
The 100-day and 200-day moving averages also slope downward, resting around $2.50, further confirming a persistent downtrend. Buyers must maintain the $1.75–$1.80 support range, or the next level to watch is approximately $1.50. Conversely, without reclaiming $2.20 and breaking through the channel, any upward movement will merely result in another lower high.
XRPUSDT
The BTC Pair
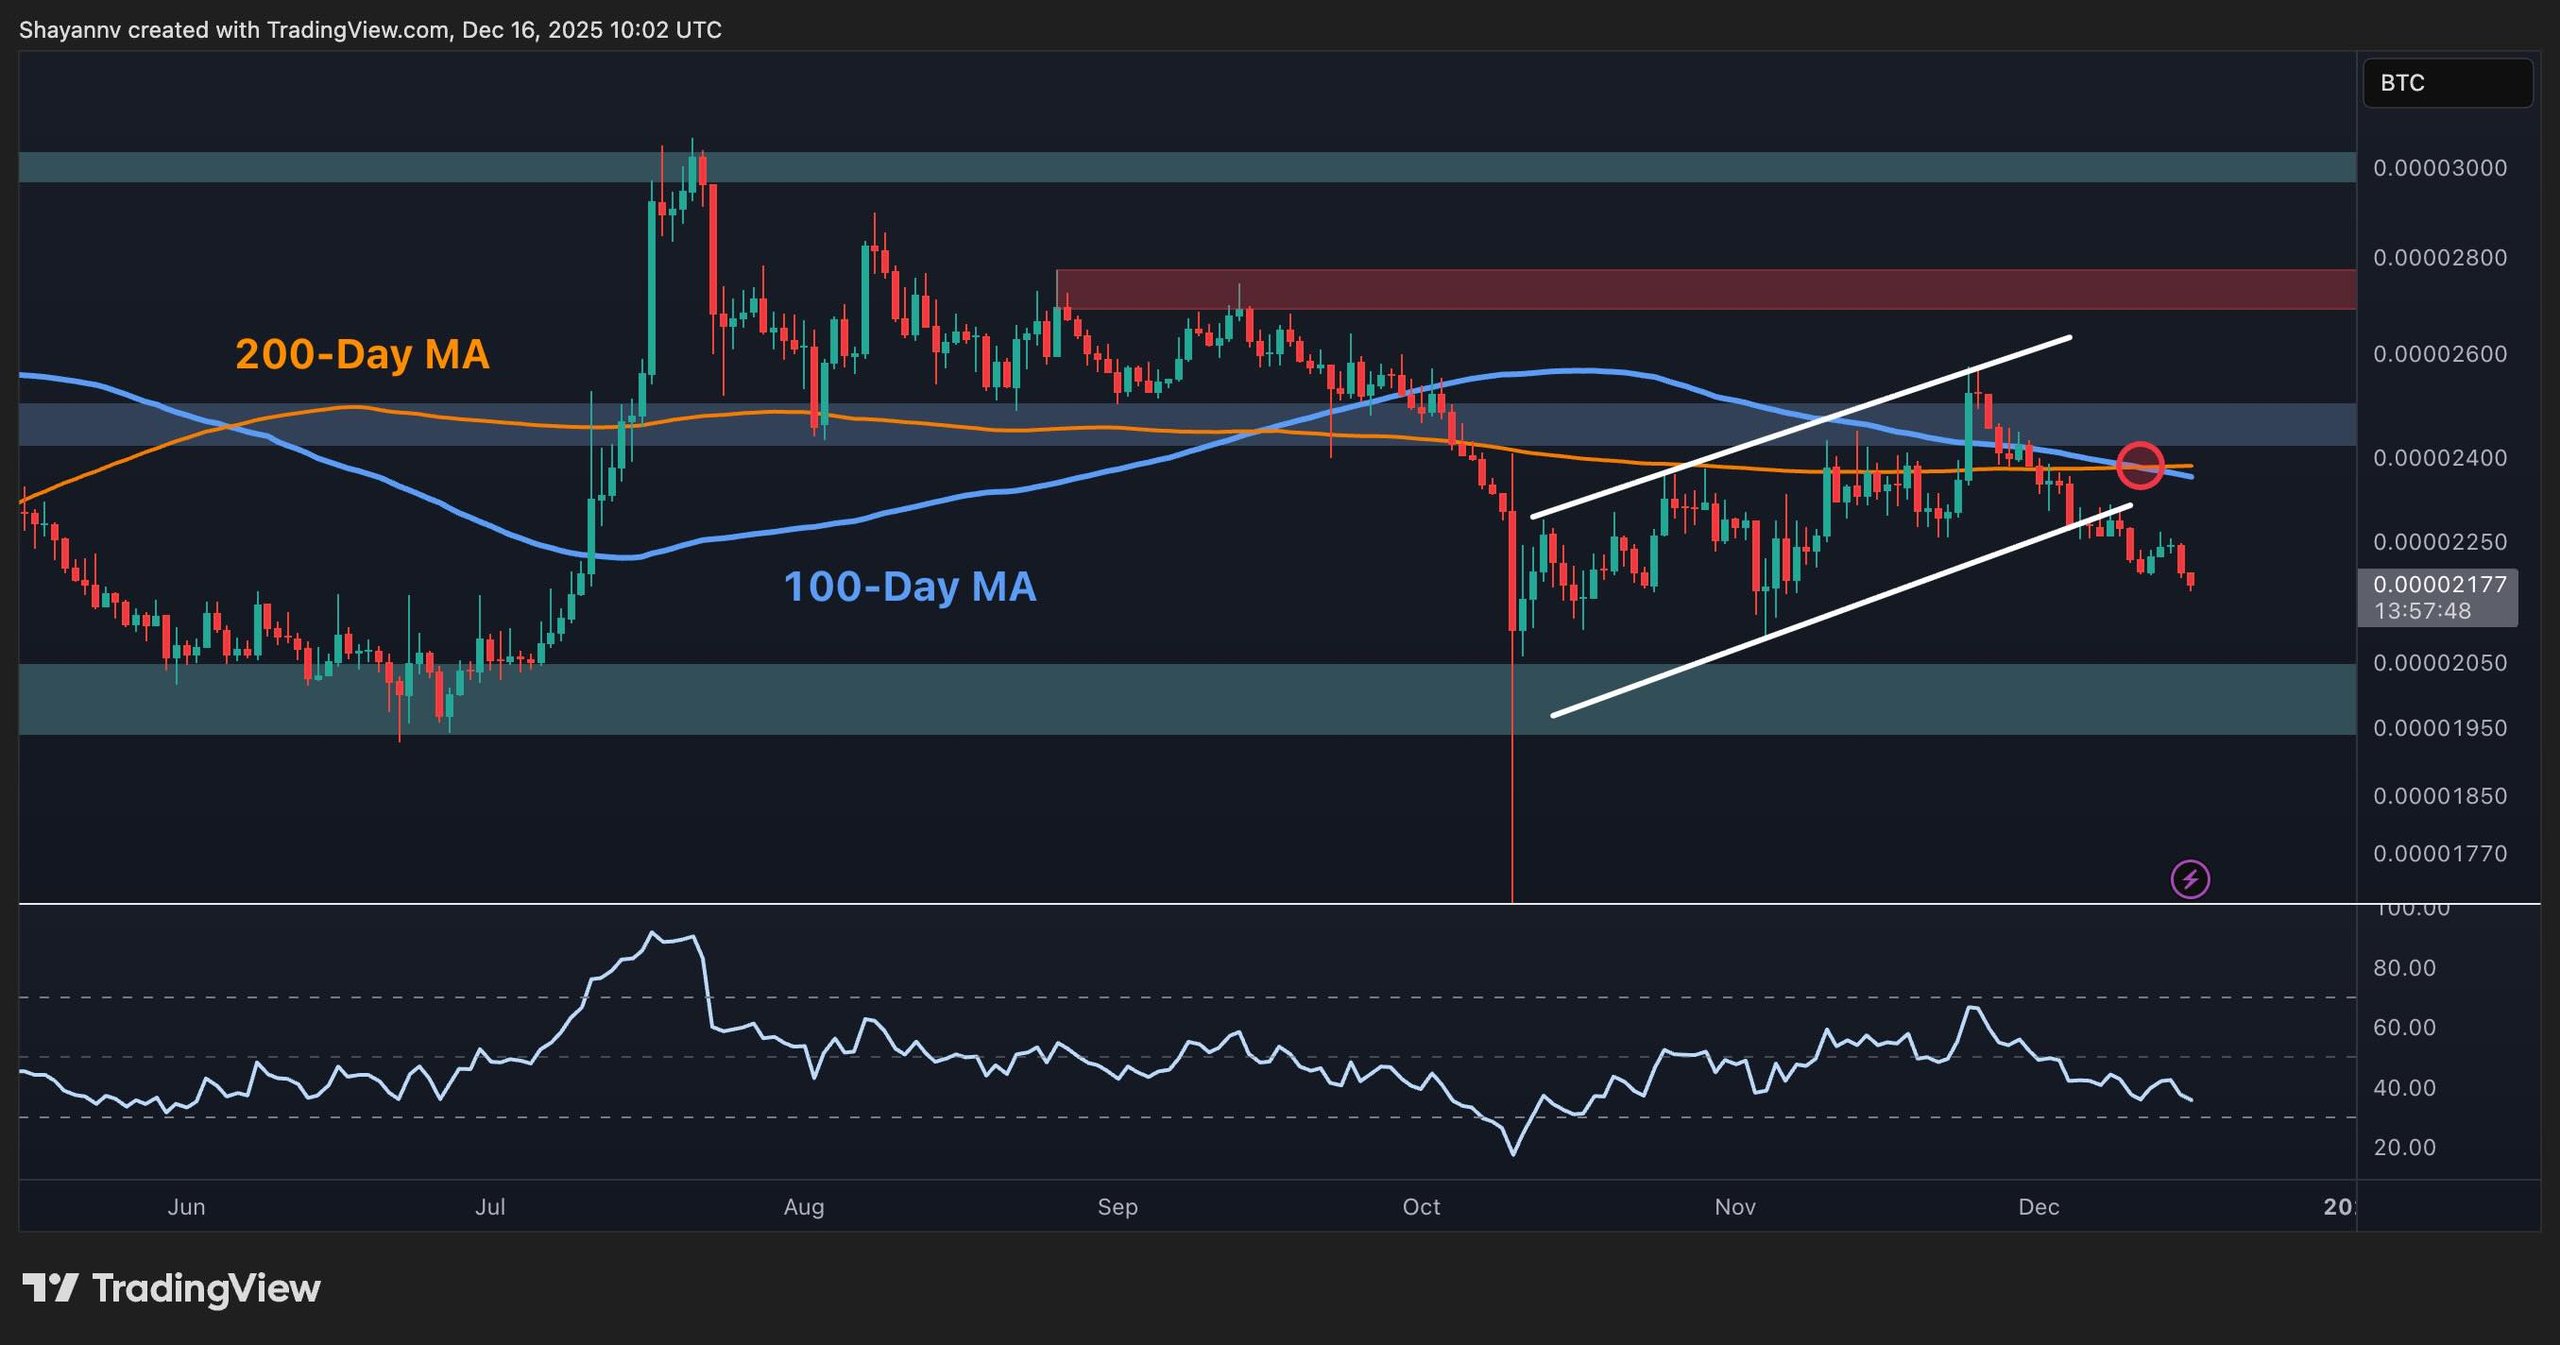
The XRPBTC pair portrays an even bleaker picture. After forming a rising wedge in previous months, it suffered a significant breakdown last week, currently trading at 2,170 sats, falling below both the 100 and 200-day moving averages, which are around 2,400 sats.
The RSI signals that the pair is approaching oversold conditions, but still shows no signs of divergence or reversal. If the downtrend continues, a critical demand zone looms around 2,000 sats, the same area where XRP found its previous low this year. Thus, if buyers fail to reclaim the 2,400 sats threshold soon, the asset is likely to lag against BTC as the year concludes.
 XRPBTC
Disclaimer: Information presented here reflects the views of the writers quoted and does not necessarily represent the opinions of CryptoPotato regarding investment decisions. Always conduct your own research before investing.
