Bitcoin Price Update: Are We Seeing a Quiet Period Before Volatility?
An analysis of Bitcoin's current market status, highlighting key resistance and support levels amid recent price movements.


Bitcoin is currently trading within a range, displaying signs of consolidation rather than following a distinct trend. Recent price actions indicate reduced momentum, as the market interacts with nearby liquidity and technical levels.
Technical Analysis
Daily Chart
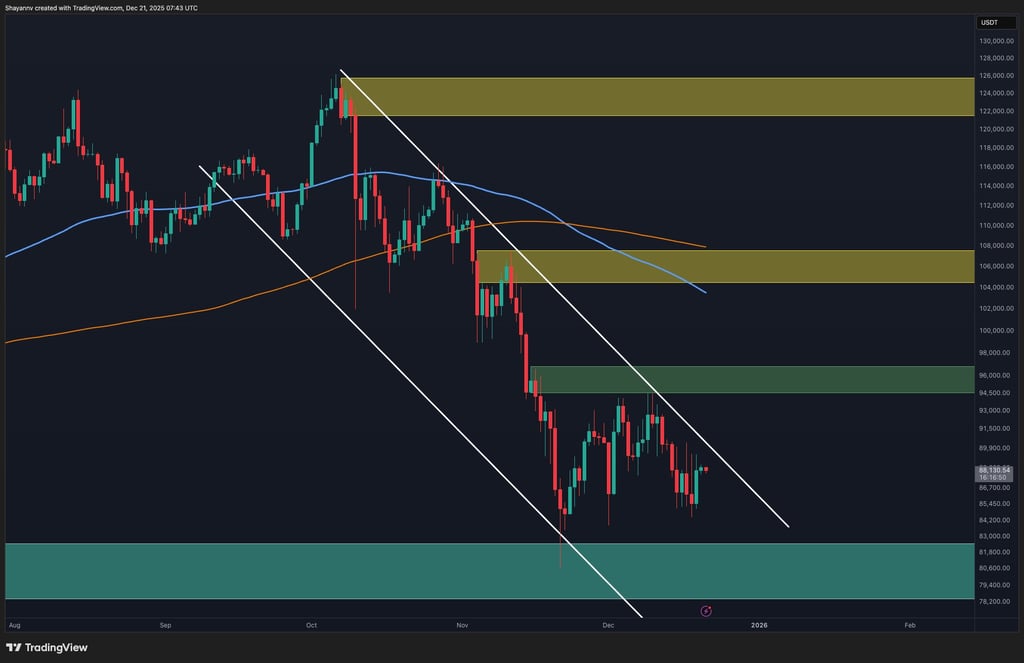
From the daily perspective, Bitcoin is still positioned below a clearly identified descending trendline that has acted as ongoing resistance during its recent downturn. Attempts to reclaim higher price points have consistently been thwarted by this trendline, validating that sellers remain active in fending off rallies.
Currently, prices are consolidating beneath a crucial supply zone around the $95K mark, a region where previous declines have taken place. This zone is critical due to its alignment with a decision point, emphasizing its role as a significant resistance area. As long as Bitcoin trades below this level, upward movements are likely to be corrective rather than impulsive.
On the downside, the principal daily support hovers around the $80K level. This price point has recently absorbed selling pressure, establishing itself as a temporary base that prevents a decline into deeper support. A daily close below this vicinity would compromise the current market structure, potentially leading to another downturn.
Overall, the daily chart illustrates a consolidating market beneath resistance, indicating that traders should exercise patience until a clear breakout or breakdown occurs.
Daily Chart
4-Hour Chart
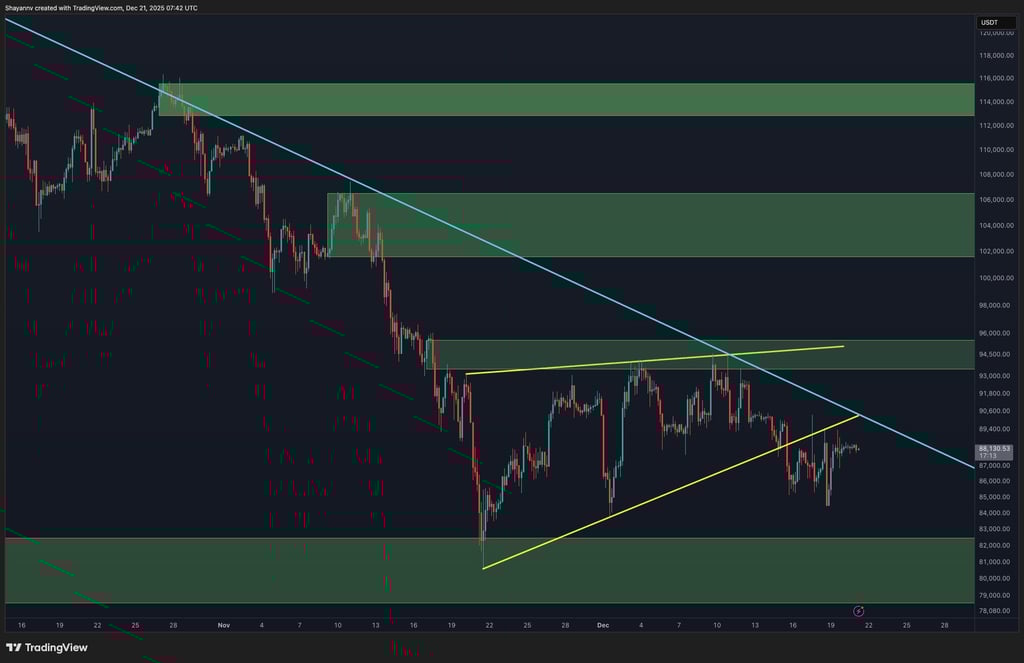
In the 4-hour timeframe, Bitcoin is caught in a compressed structure following a steep decline from its recent peaks. It has established a rising corrective pattern within the broader downward trend and has recently dipped below this structure.
Recent efforts to gain ground have faltered near the $90K level, where short-term sellers have intervened consistently. This resulted in a lack of momentum and a retention of sideways-to-downward price action. The failure to reclaim the descending trendline suggests that bullish momentum is currently weak.
If Bitcoin can’t maintain its position above the existing consolidation range and slips beneath $85K, the downward pressure might intensify towards lower daily support. Conversely, a solid reclaim and retention above $90K would be necessary to shift the short-term momentum and challenge higher resistance levels.
 4-Hour Chart
Sentiment Analysis
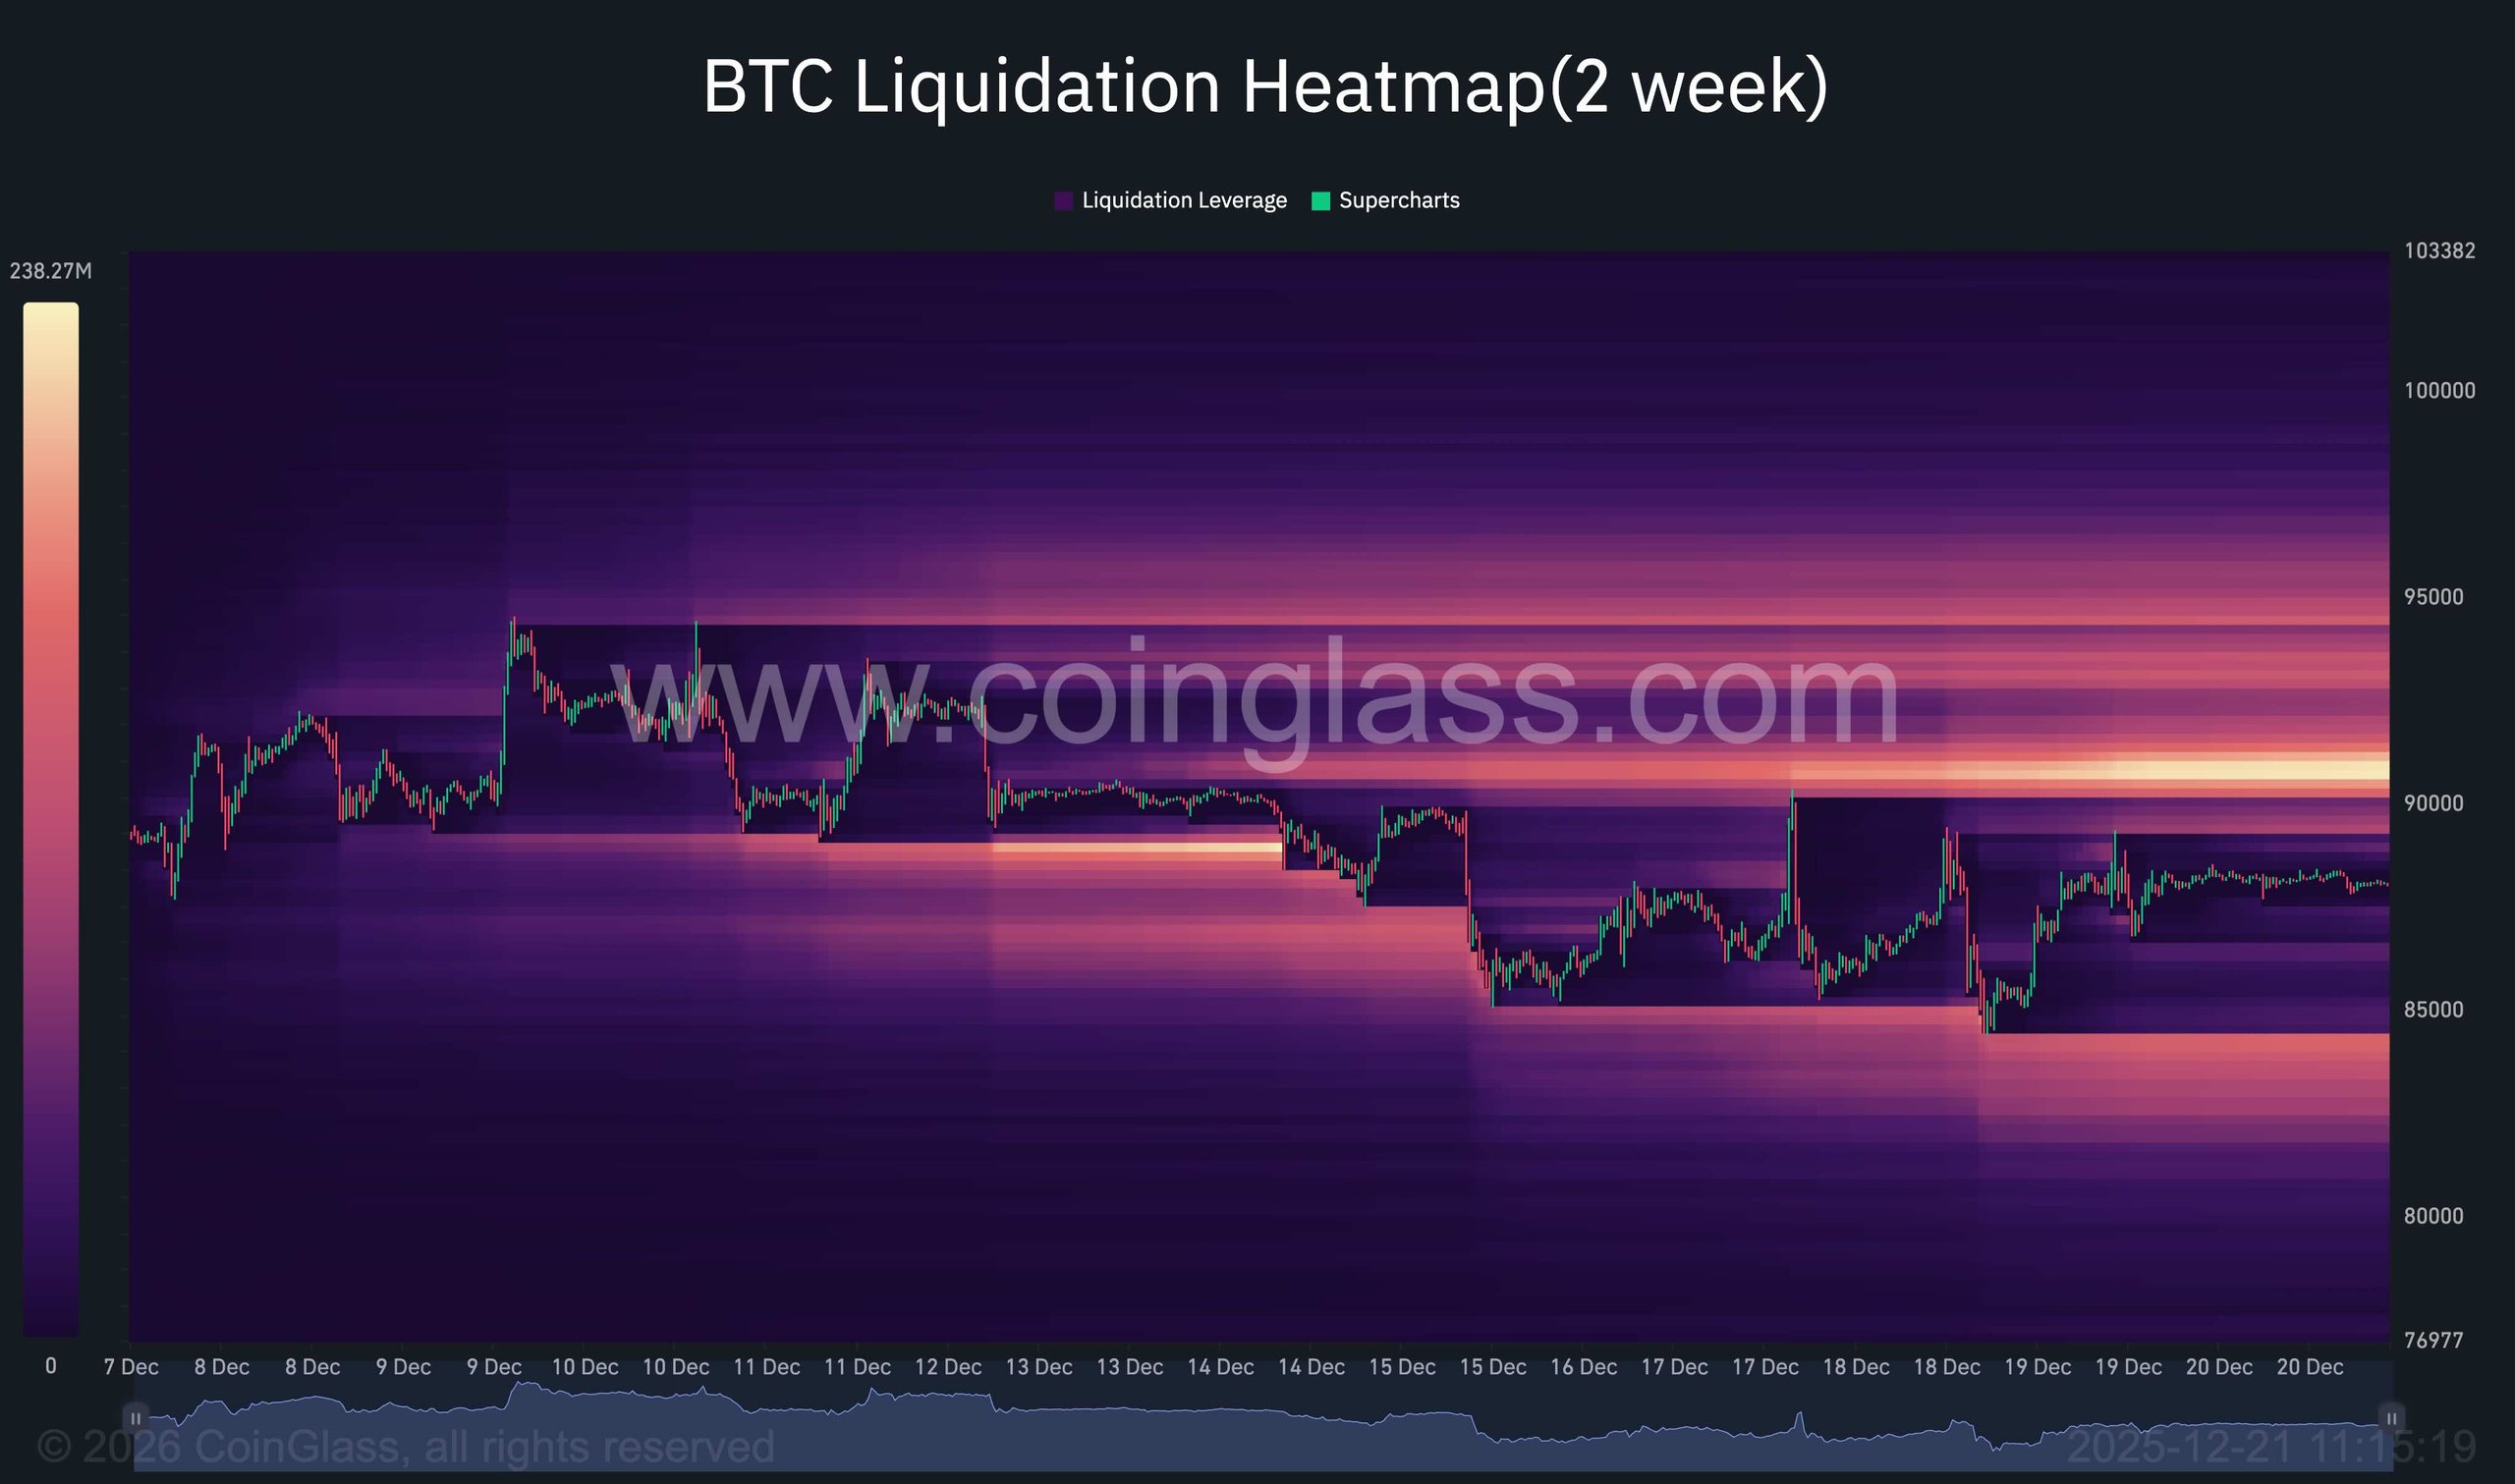
The two-week Bitcoin liquidation heatmap reveals a substantial liquidity cluster positioned just above the $90K level. This zone stands out as a heavy concentration of leveraged positions, indicating a heightened likelihood of price interaction within this area.
Rather than indicating an immediate upward continuation, this liquidity cluster implies a potential absorption area. When the asset approaches this zone, it may result in liquidations and forced closure of positions, allowing larger market players to absorb liquidity rather than facilitating a sustained breakout. Such activity aligns with range-bound or corrective market conditions rather than trend expansions.
Until the liquidity above $90K is significantly cleared and the price demonstrates strong acceptance above this zone, Bitcoin remains susceptible to further consolidation or potential renewed downturns. The presence of untested liquidity below the present price keeps the risk of a more profound sweep towards lower demand zones an ongoing concern.
In conclusion, Bitcoin is navigating between technical resistance and concentrated liquidity levels. Without a decisive structural change, the market appears to be in a neutral-to-bearish state, with price movements likely to respond to the immediate liquidity before any definitive directional move arises.
 Liquidity Heatmap
Download the latest trading strategies today!
