Analyzing Ethereum's Price Movement: Has ETH Emerged After Reaching the $3K Threshold?
A recent analysis discusses the current state of Ethereum's price and its potential movements in the market after hitting a crucial support level.


Ethereum remains below critical resistance levels following weeks of correction. Despite experiencing a short-term rebound, the market structure overall still appears unstable. Though the recent price movements indicate some recovery, there hasn’t been a definitive shift in momentum yet.
Technical Analysis
Daily Overview
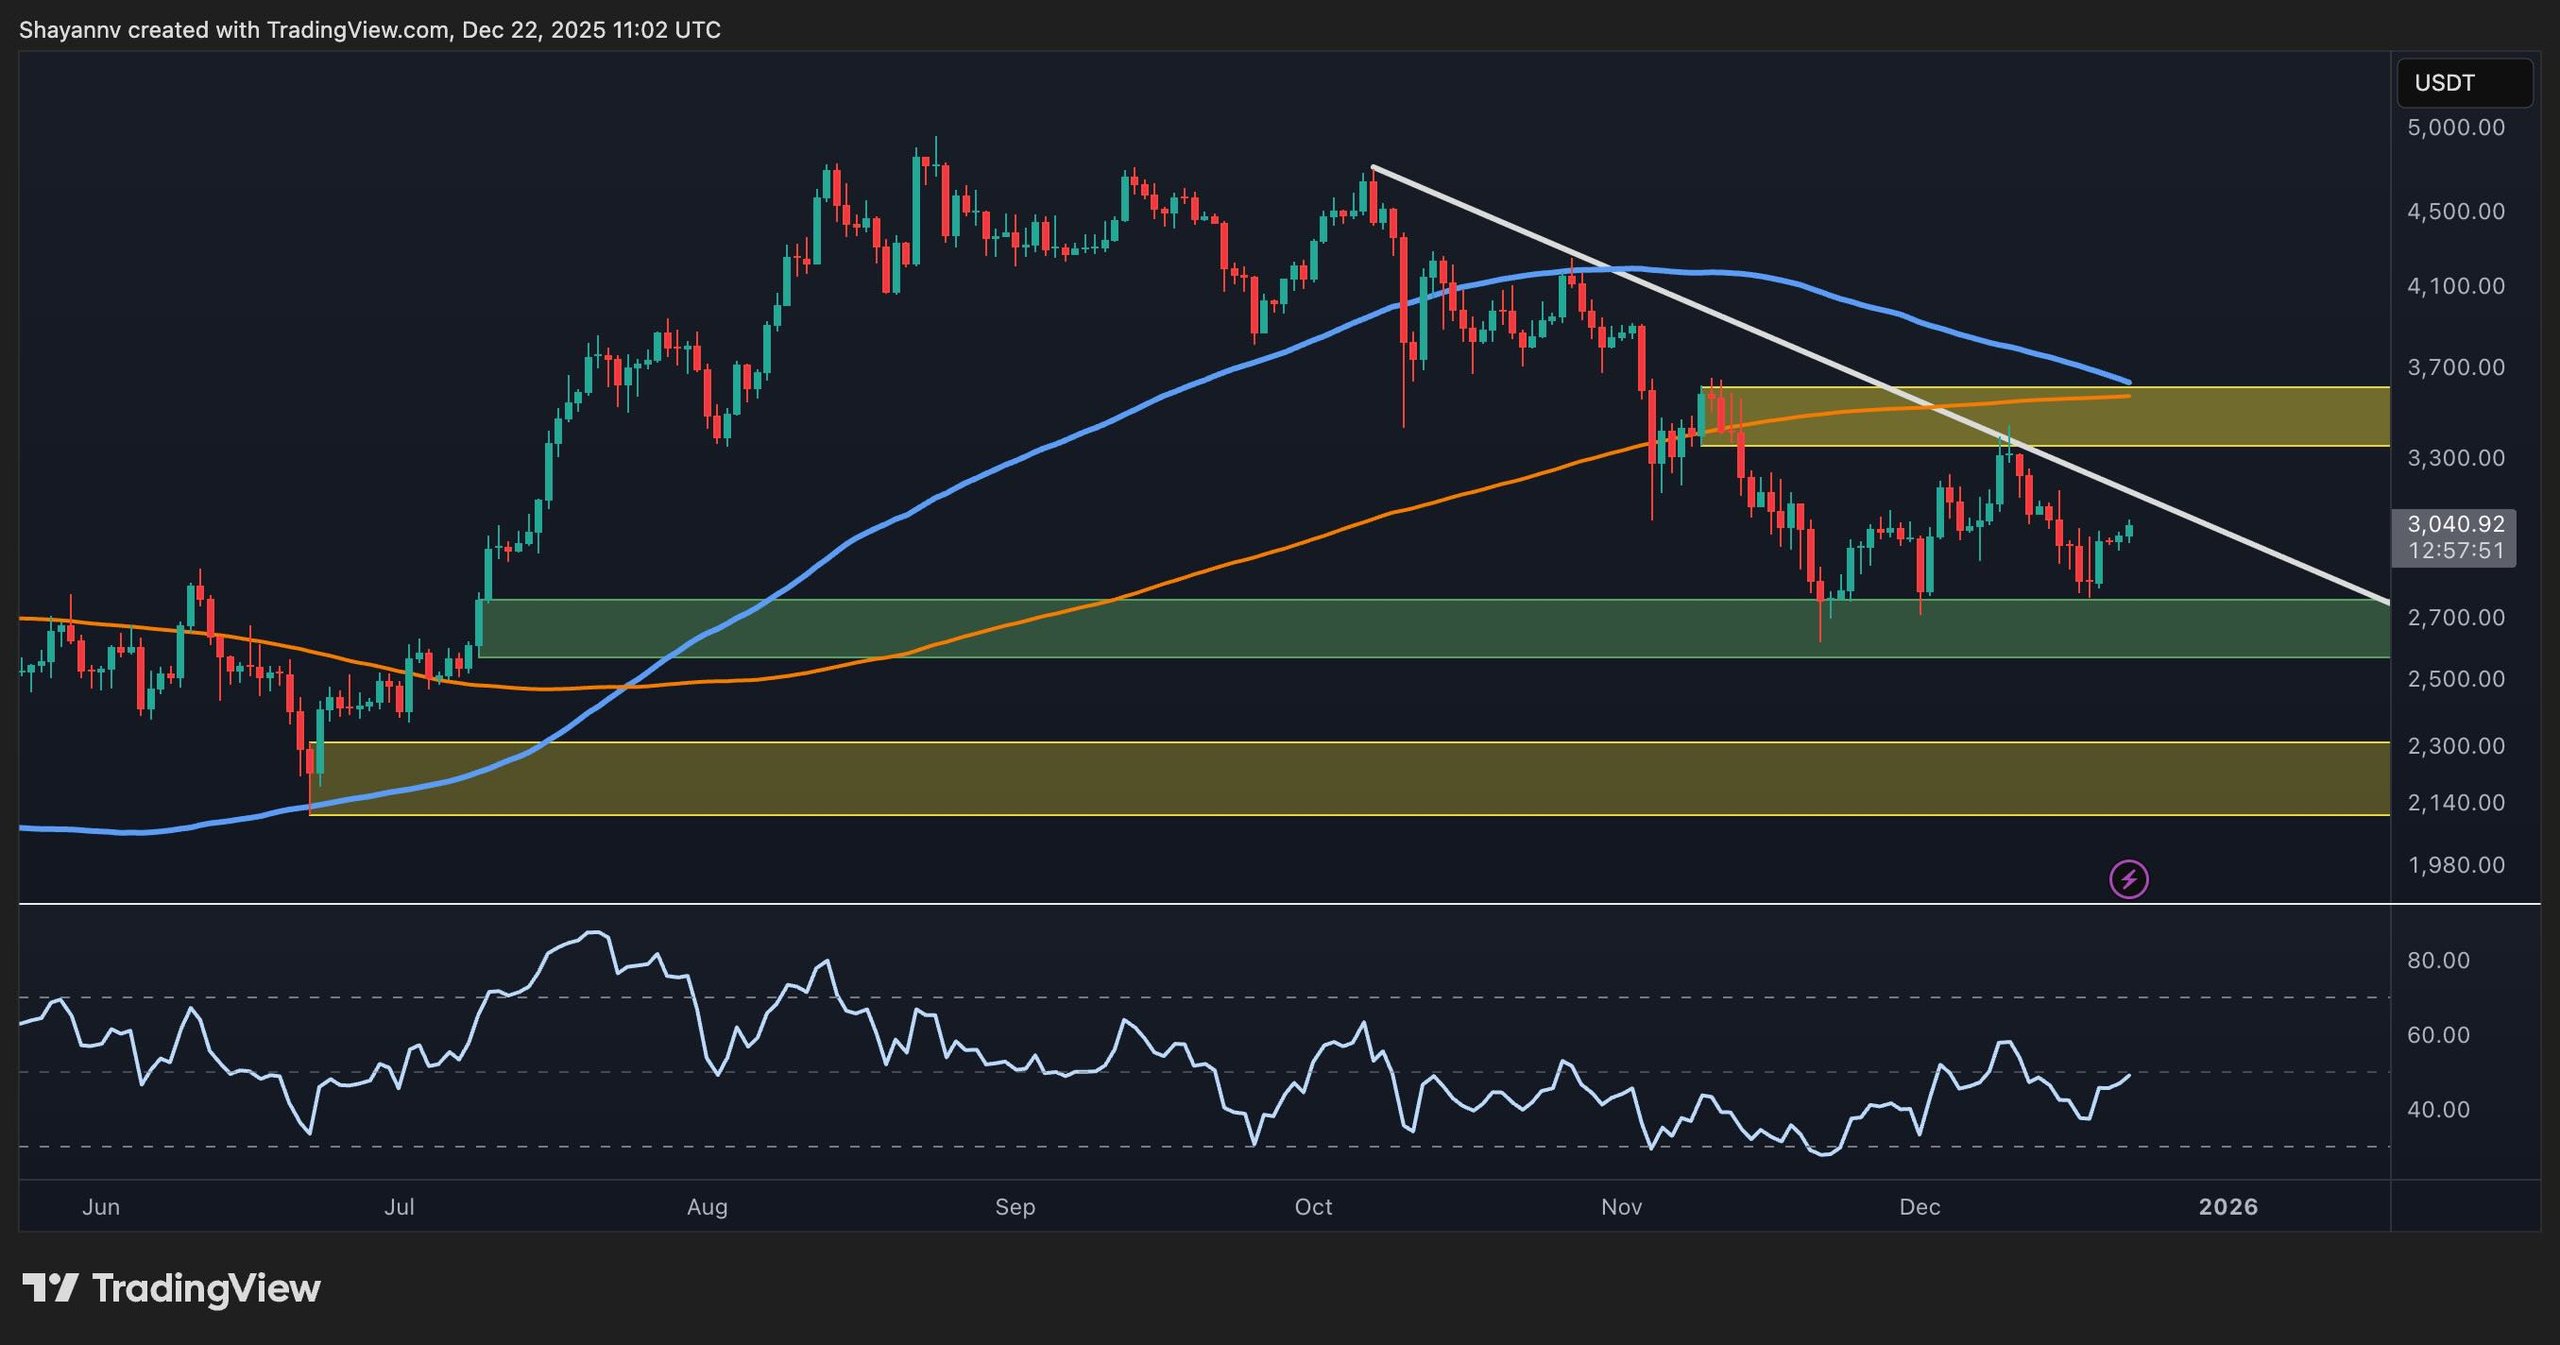
On the daily chart, ETH continues to trade beneath a significant descending trendline that has consistently served as resistance in recent weeks. The asset managed to bounce back from the $2,700 support zone, but the price hasn’t yet surpassed the wedge or the 100-day and 200-day moving averages, currently converging at about $3,600.
A potential bearish crossover between these moving averages looks likely in the near term, signaling a potential downturn in the weeks ahead. For buyers to regain footing, the price needs to clear the $3,500-$3,700 resistance area. However, this must start with a breakout from the declining trendline.
Daily Chart
Four-Hour Breakdown
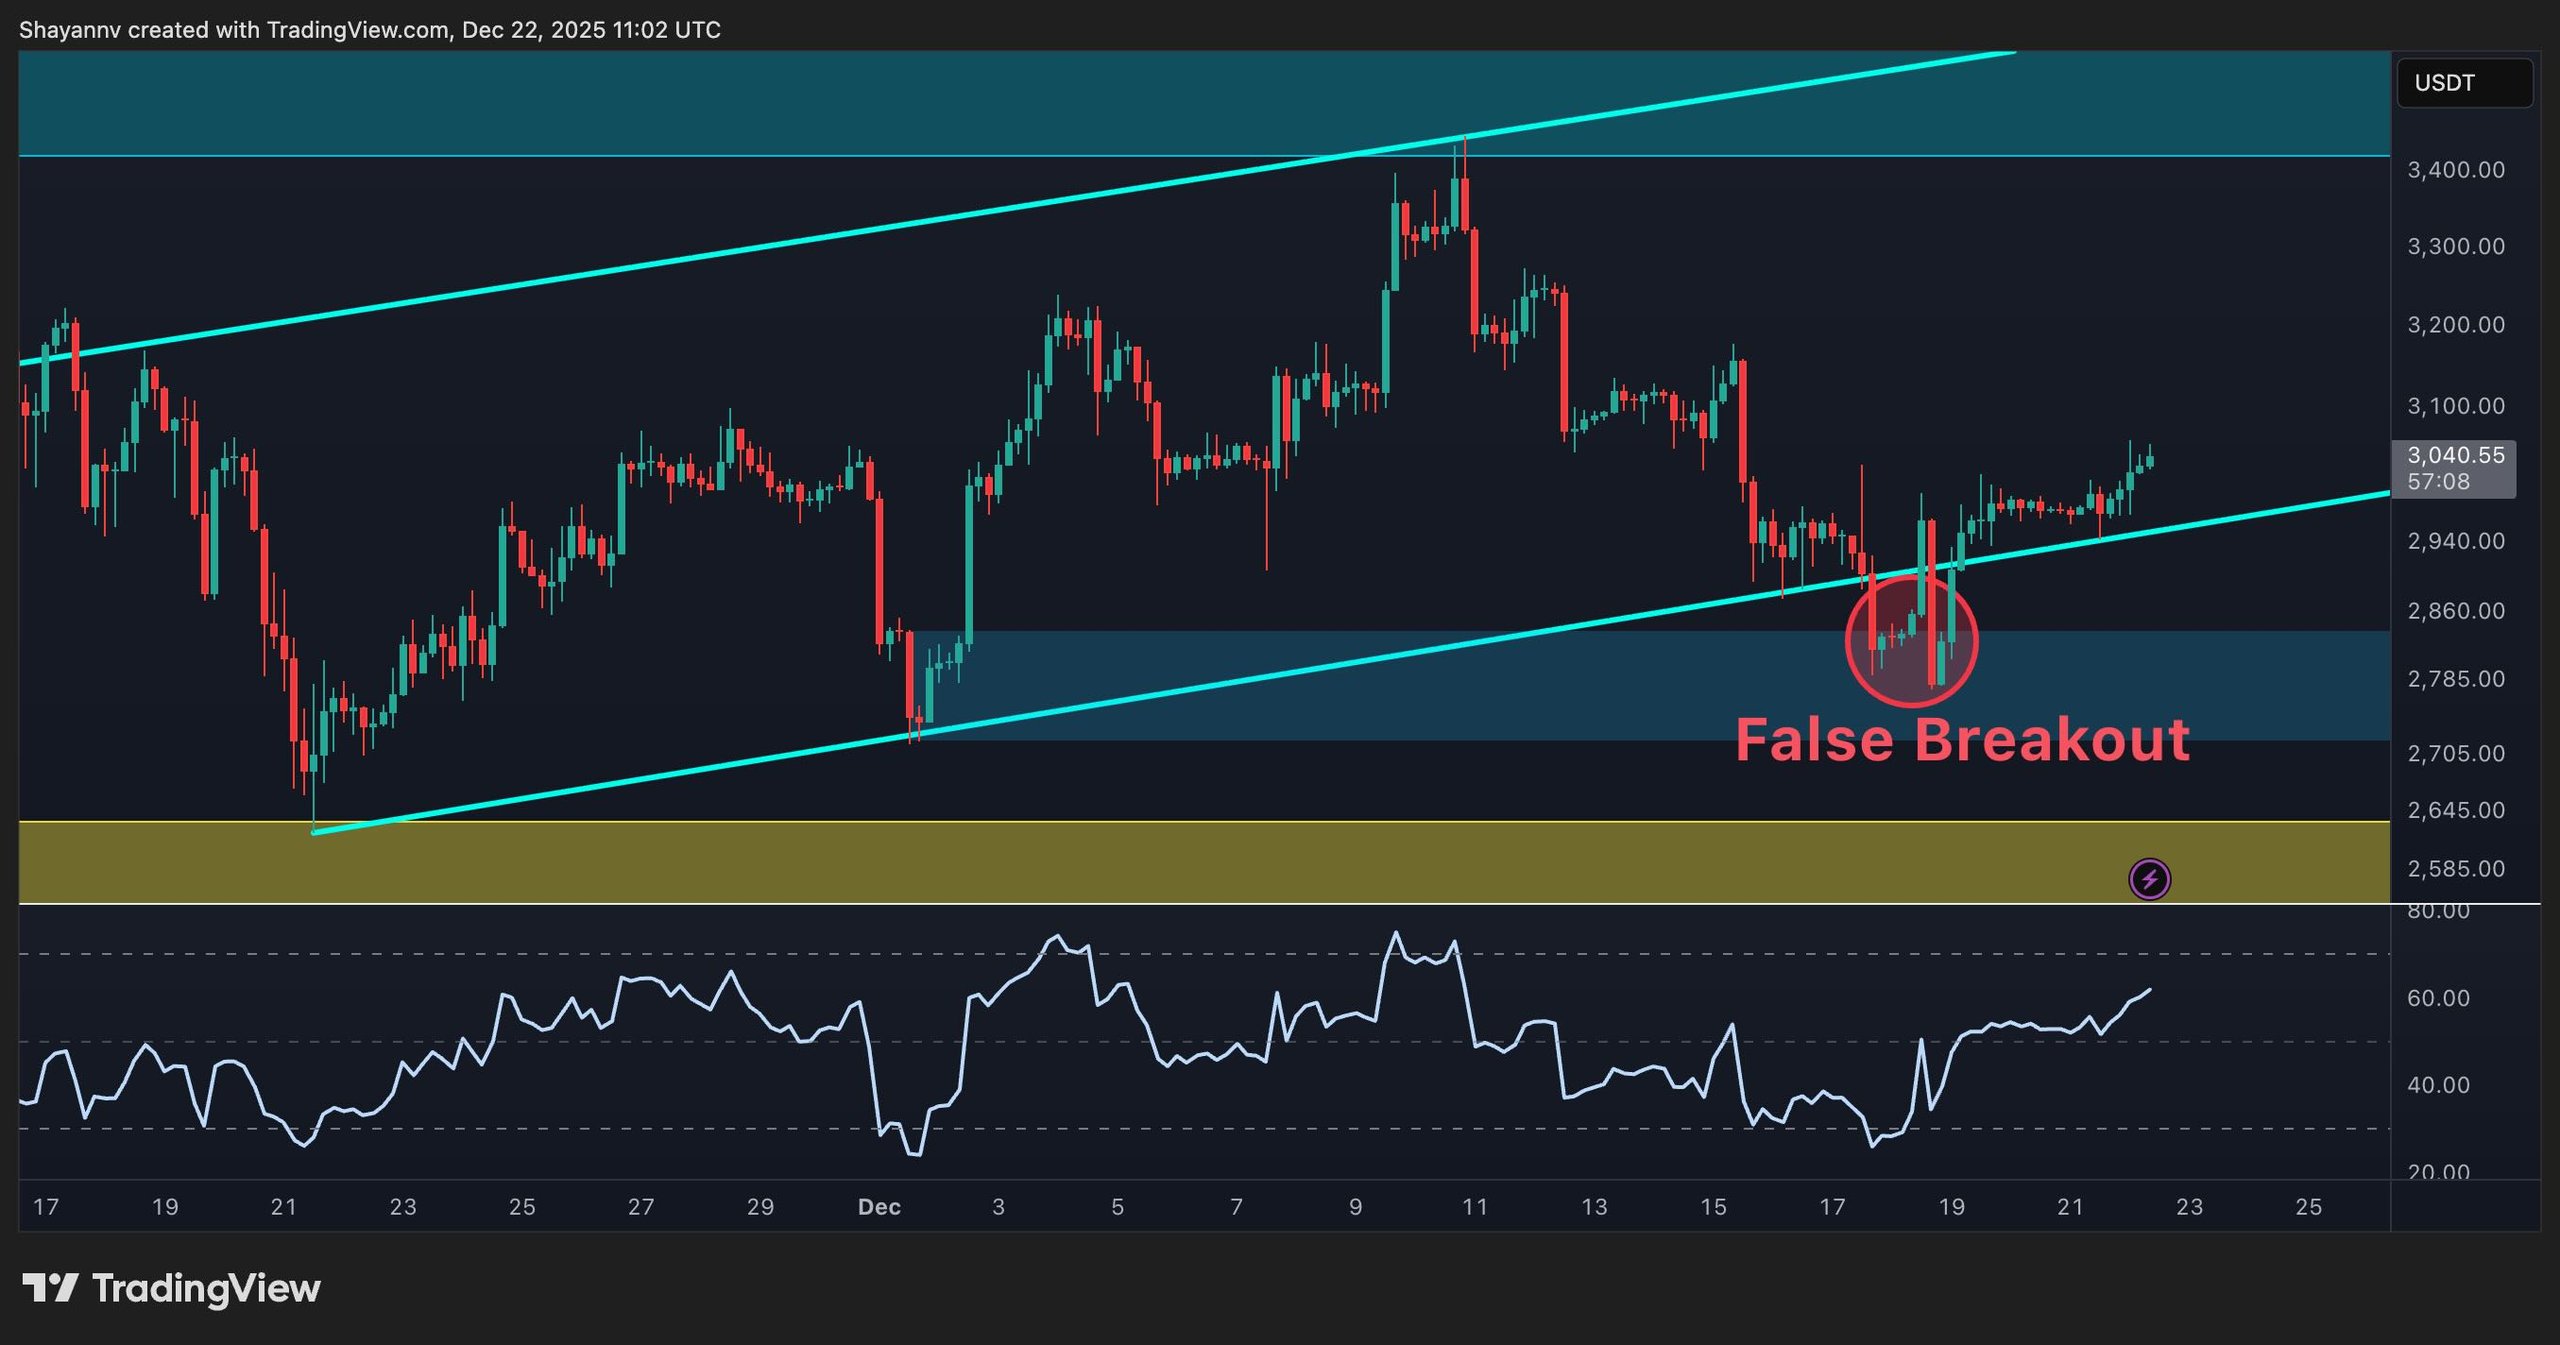
The 4-hour analysis reveals a clearer bounce situation following a false breakdown beneath the lower channel boundary near $2,750. The price quickly reclaimed this level, indicating a resumption of a short-term uptrend within the ascending channel.
The testing of the $3,000 level, which instigated the last sell-off, is ongoing. If buyers can transform this zone into support, further upward movement toward the $3,400-$3,500 range may be anticipated. On the contrary, failing to hold may push ETH back towards $2,900 and potentially below that channel again.
The RSI shows steady growth but hasn’t reached overbought conditions yet, implying momentum exists, although prices remain susceptible to resistance areas.
 4-Hour Chart
On-Chain Analysis
Exchange Reserves
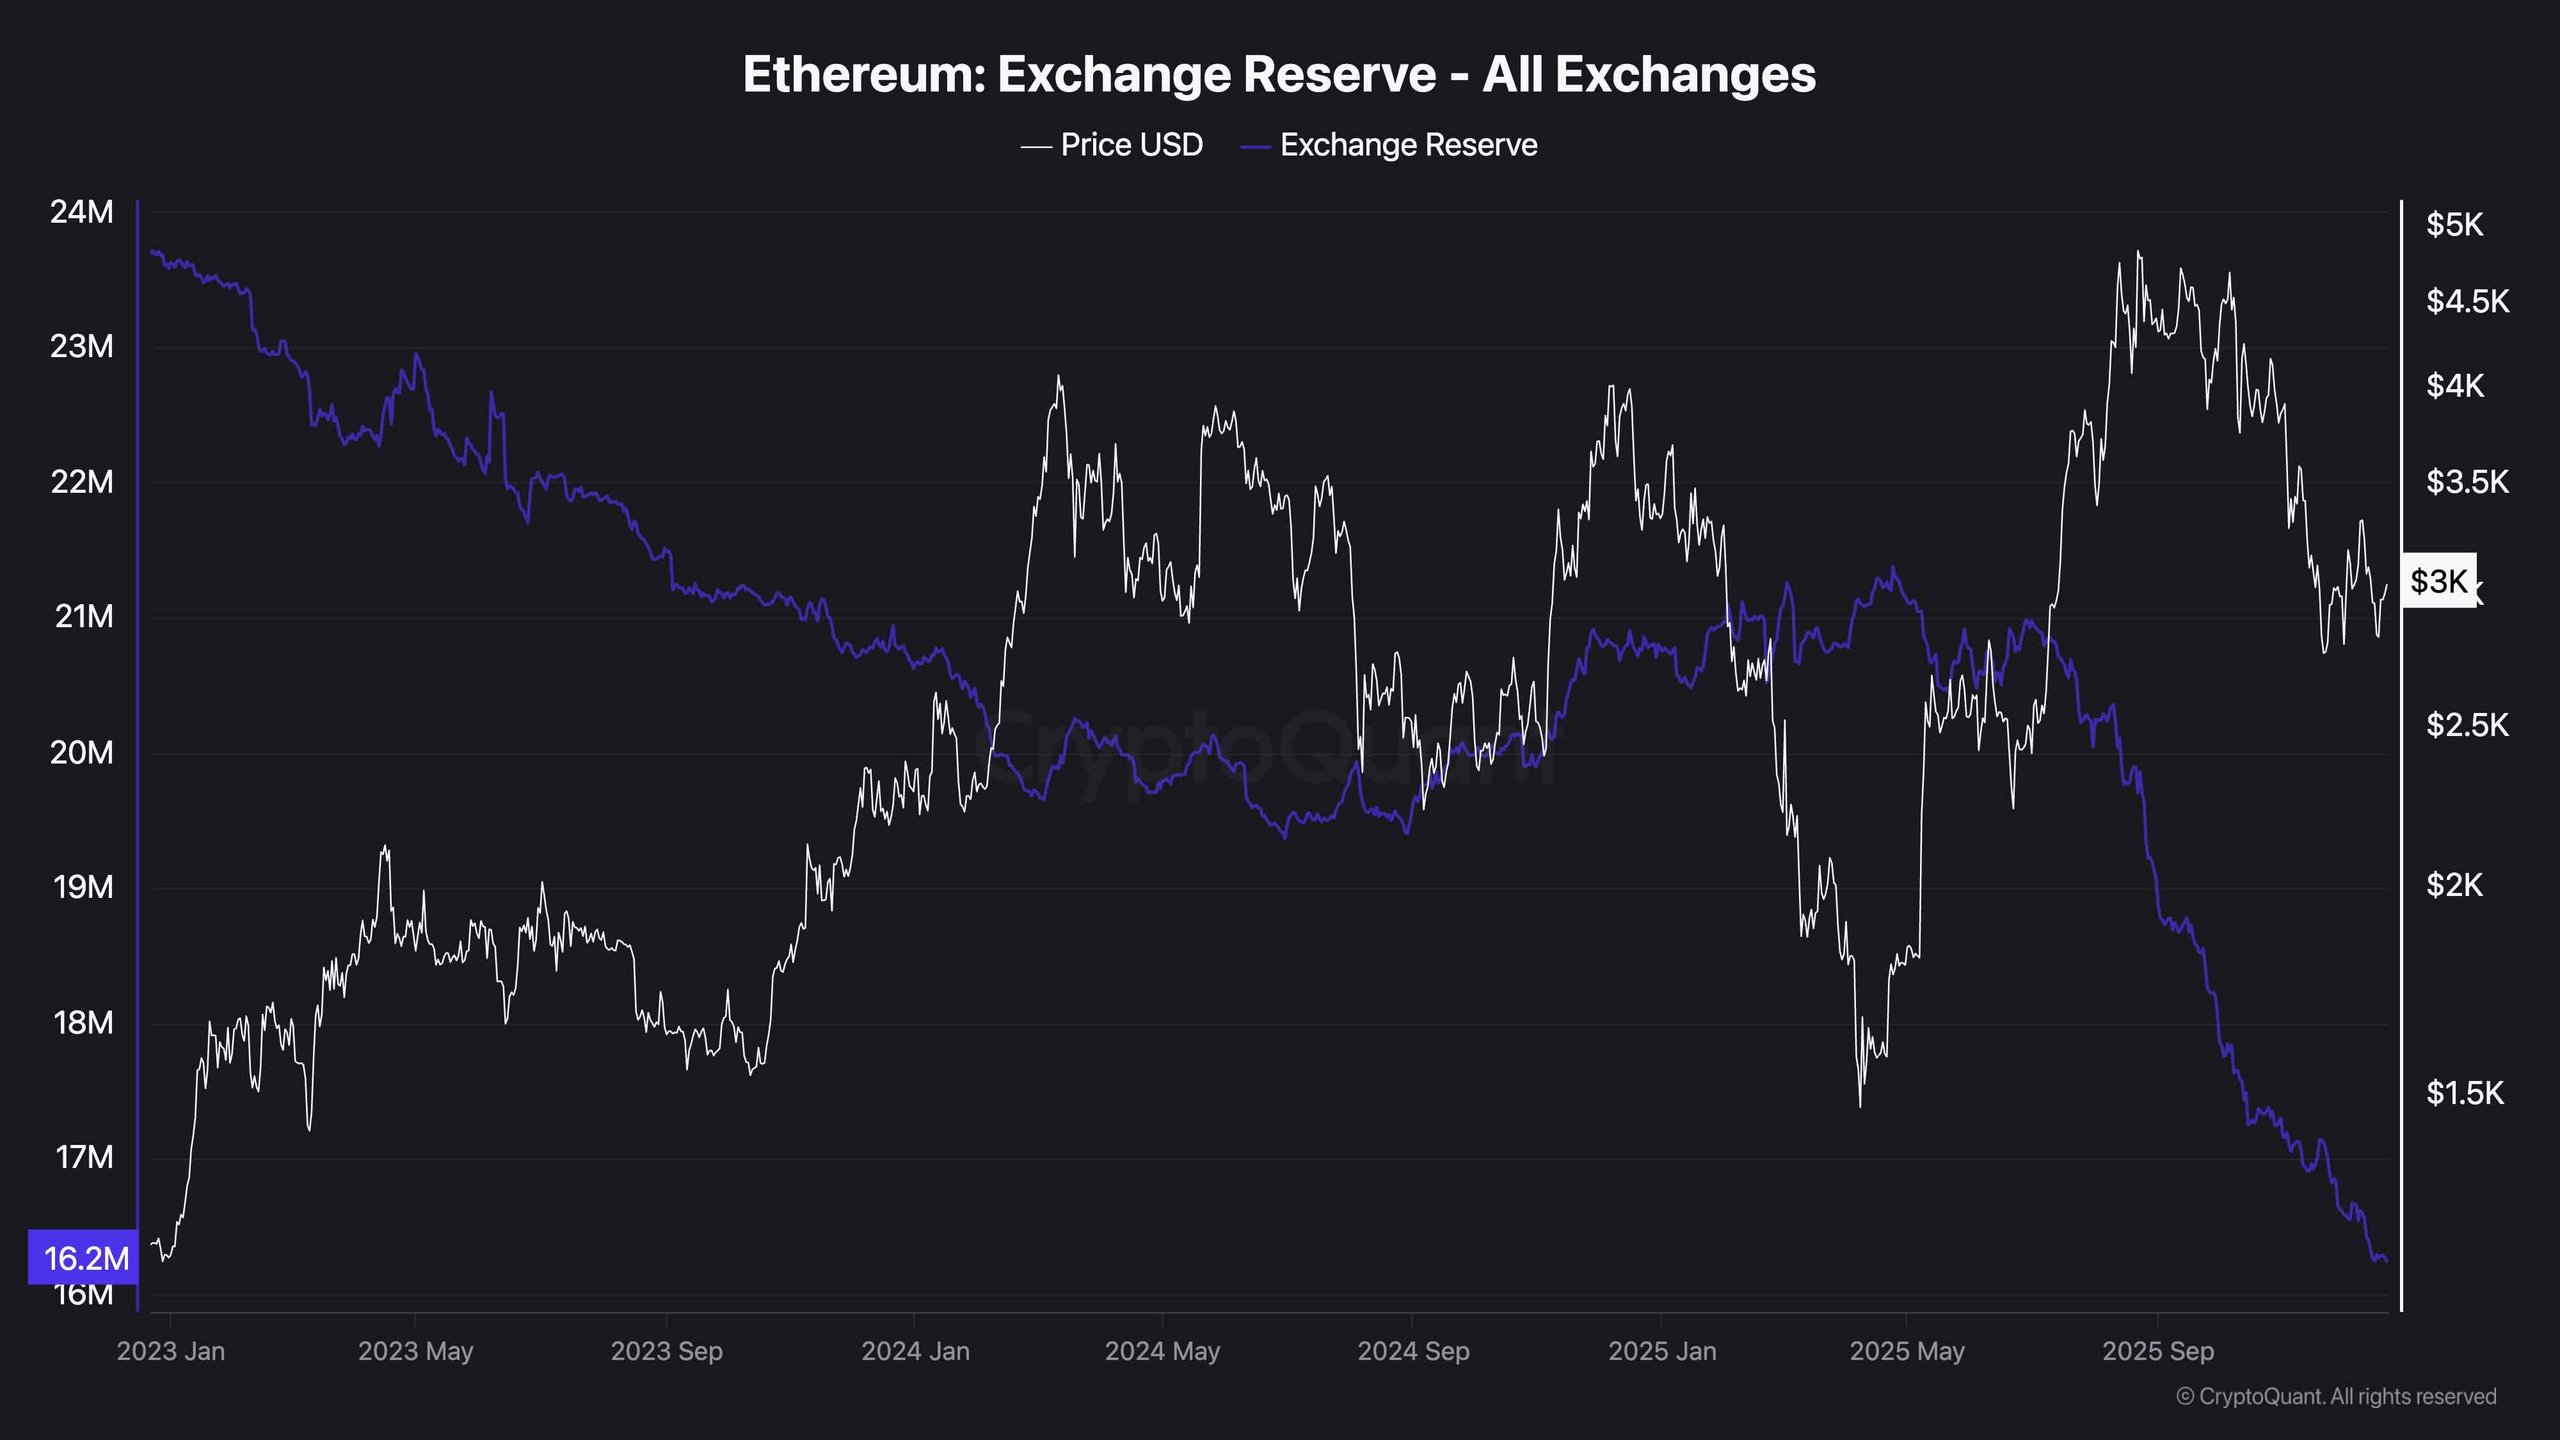
Ethereum’s reserves on exchanges are sharply declining, now at the lowest points in years (approximately 16.2 million ETH). This trend indicates long-term accumulation and diminished incentives to sell from holders.
In the past, a reduction in exchange reserves has typically been bullish in the medium term, suggesting that coins are being transferred off exchanges and into cold storage. However, the current prices do not reflect this trend, which could imply that market participants are still seeking broader confirmations or external factors before making aggressive purchases.
Thus, while on-chain data supports a long-term bullish outlook, short-term technical factors remain delicate.
 Exchange Reserve
Disclaimer: The information provided herein reflects the views of the authors mentioned and does not represent the opinions of CryptoPotato regarding the decision to invest. It is advisable to conduct thorough research before making any investment decisions and to utilize the provided information at your own risk.
