BTC Price Analysis: Is a $100K Breakthrough Close After a 7% Surge?
Bitcoin's price analysis shows a potential breakout towards $100K following a significant weekly increase amid geopolitical uncertainties.


Bitcoin has shown a remarkable recovery, surging above $93,000 even within a backdrop of heightened geopolitical tensions. This resilience demonstrates Bitcoin’s growing recognition as a hedge or alternative asset.
As liquidation pressures ease up, the technical indicators suggest the emergence of renewed bullish momentum. Presently, the price is nearing a pivotal resistance zone that could determine the continuation or halt of this rally.
Bitcoin Price Analysis: Daily Chart
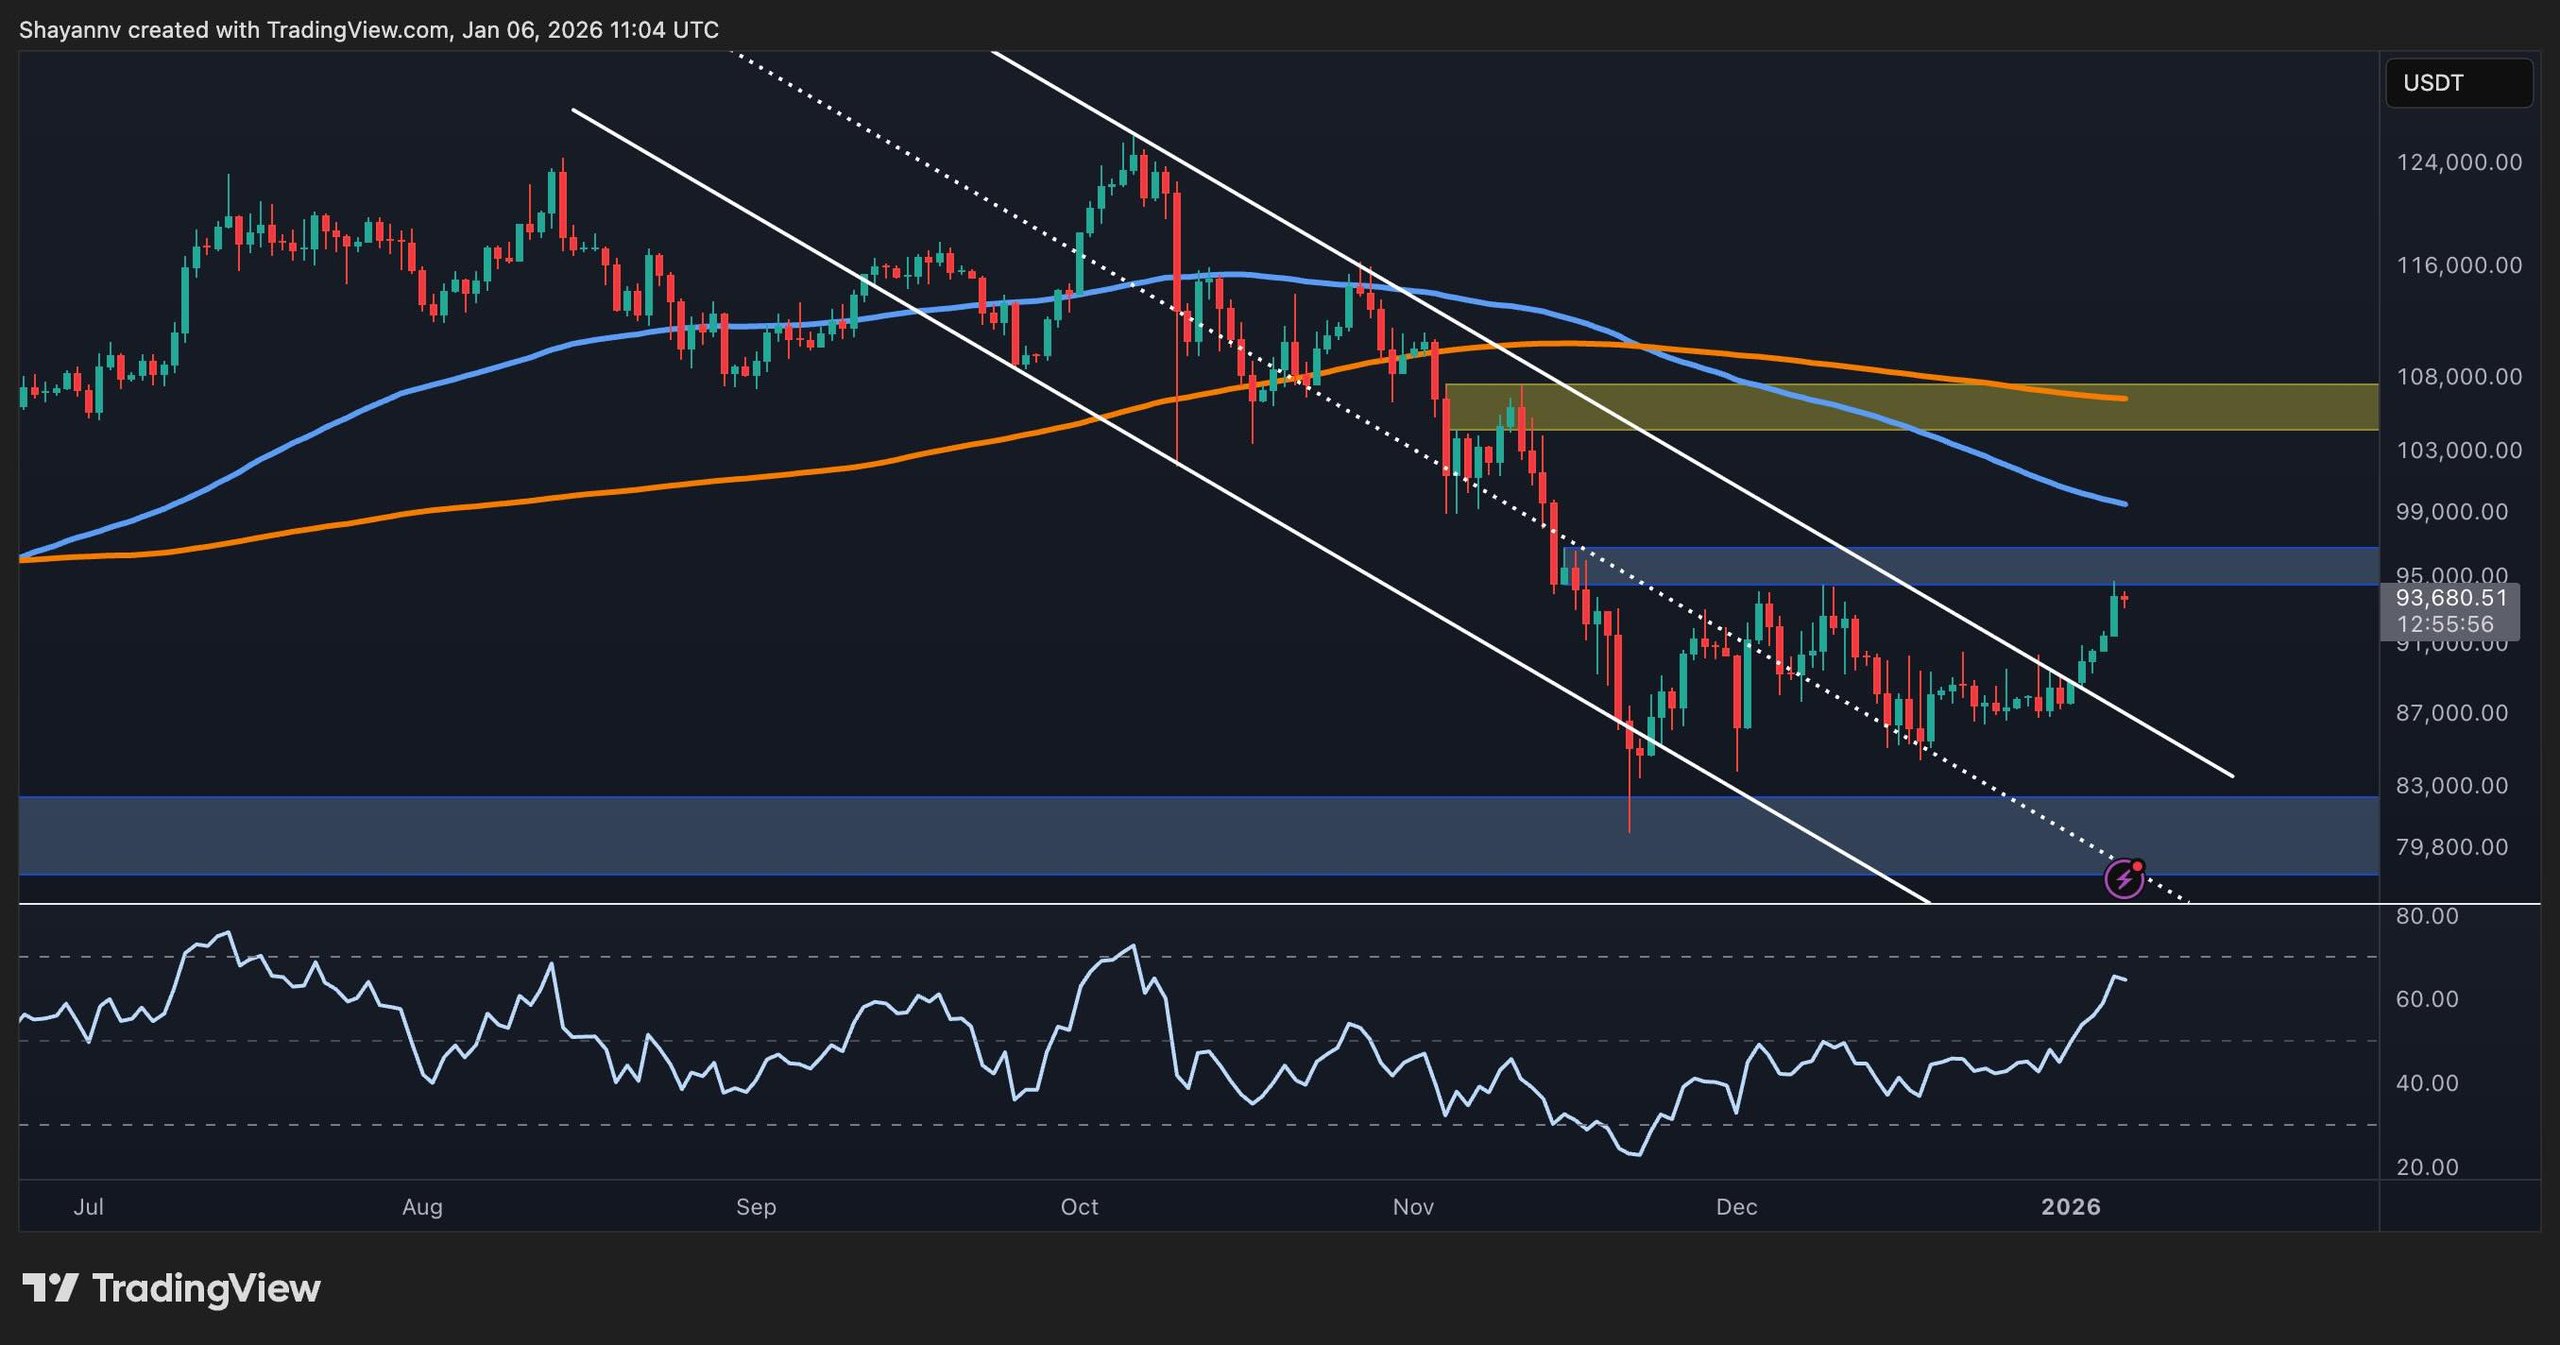
Analyzing the daily chart, Bitcoin has overcome the downward channel that characterized its price movement since October. Following a strong bounce from the $80,000 demand zone, Bitcoin is now trading just below the critical resistance area around $95,000. This price point is a historical support-turned-resistance level, now presenting a major obstacle for the bulls.
Indicators such as the 100-day and 200-day moving averages remain above the current price, suggesting sustained long-term pressure. In contrast, the short-term momentum has turned positive, with the RSI surpassing 60, indicating buyer dominance. However, caution is warranted as reaching the overbought territory could signal a potential exhaustion. A daily close above $95,000 would lay the groundwork for retesting the $100,000 and $105,000 resistance levels.
Daily BTC Chart
BTC/USDT 4-Hour Chart
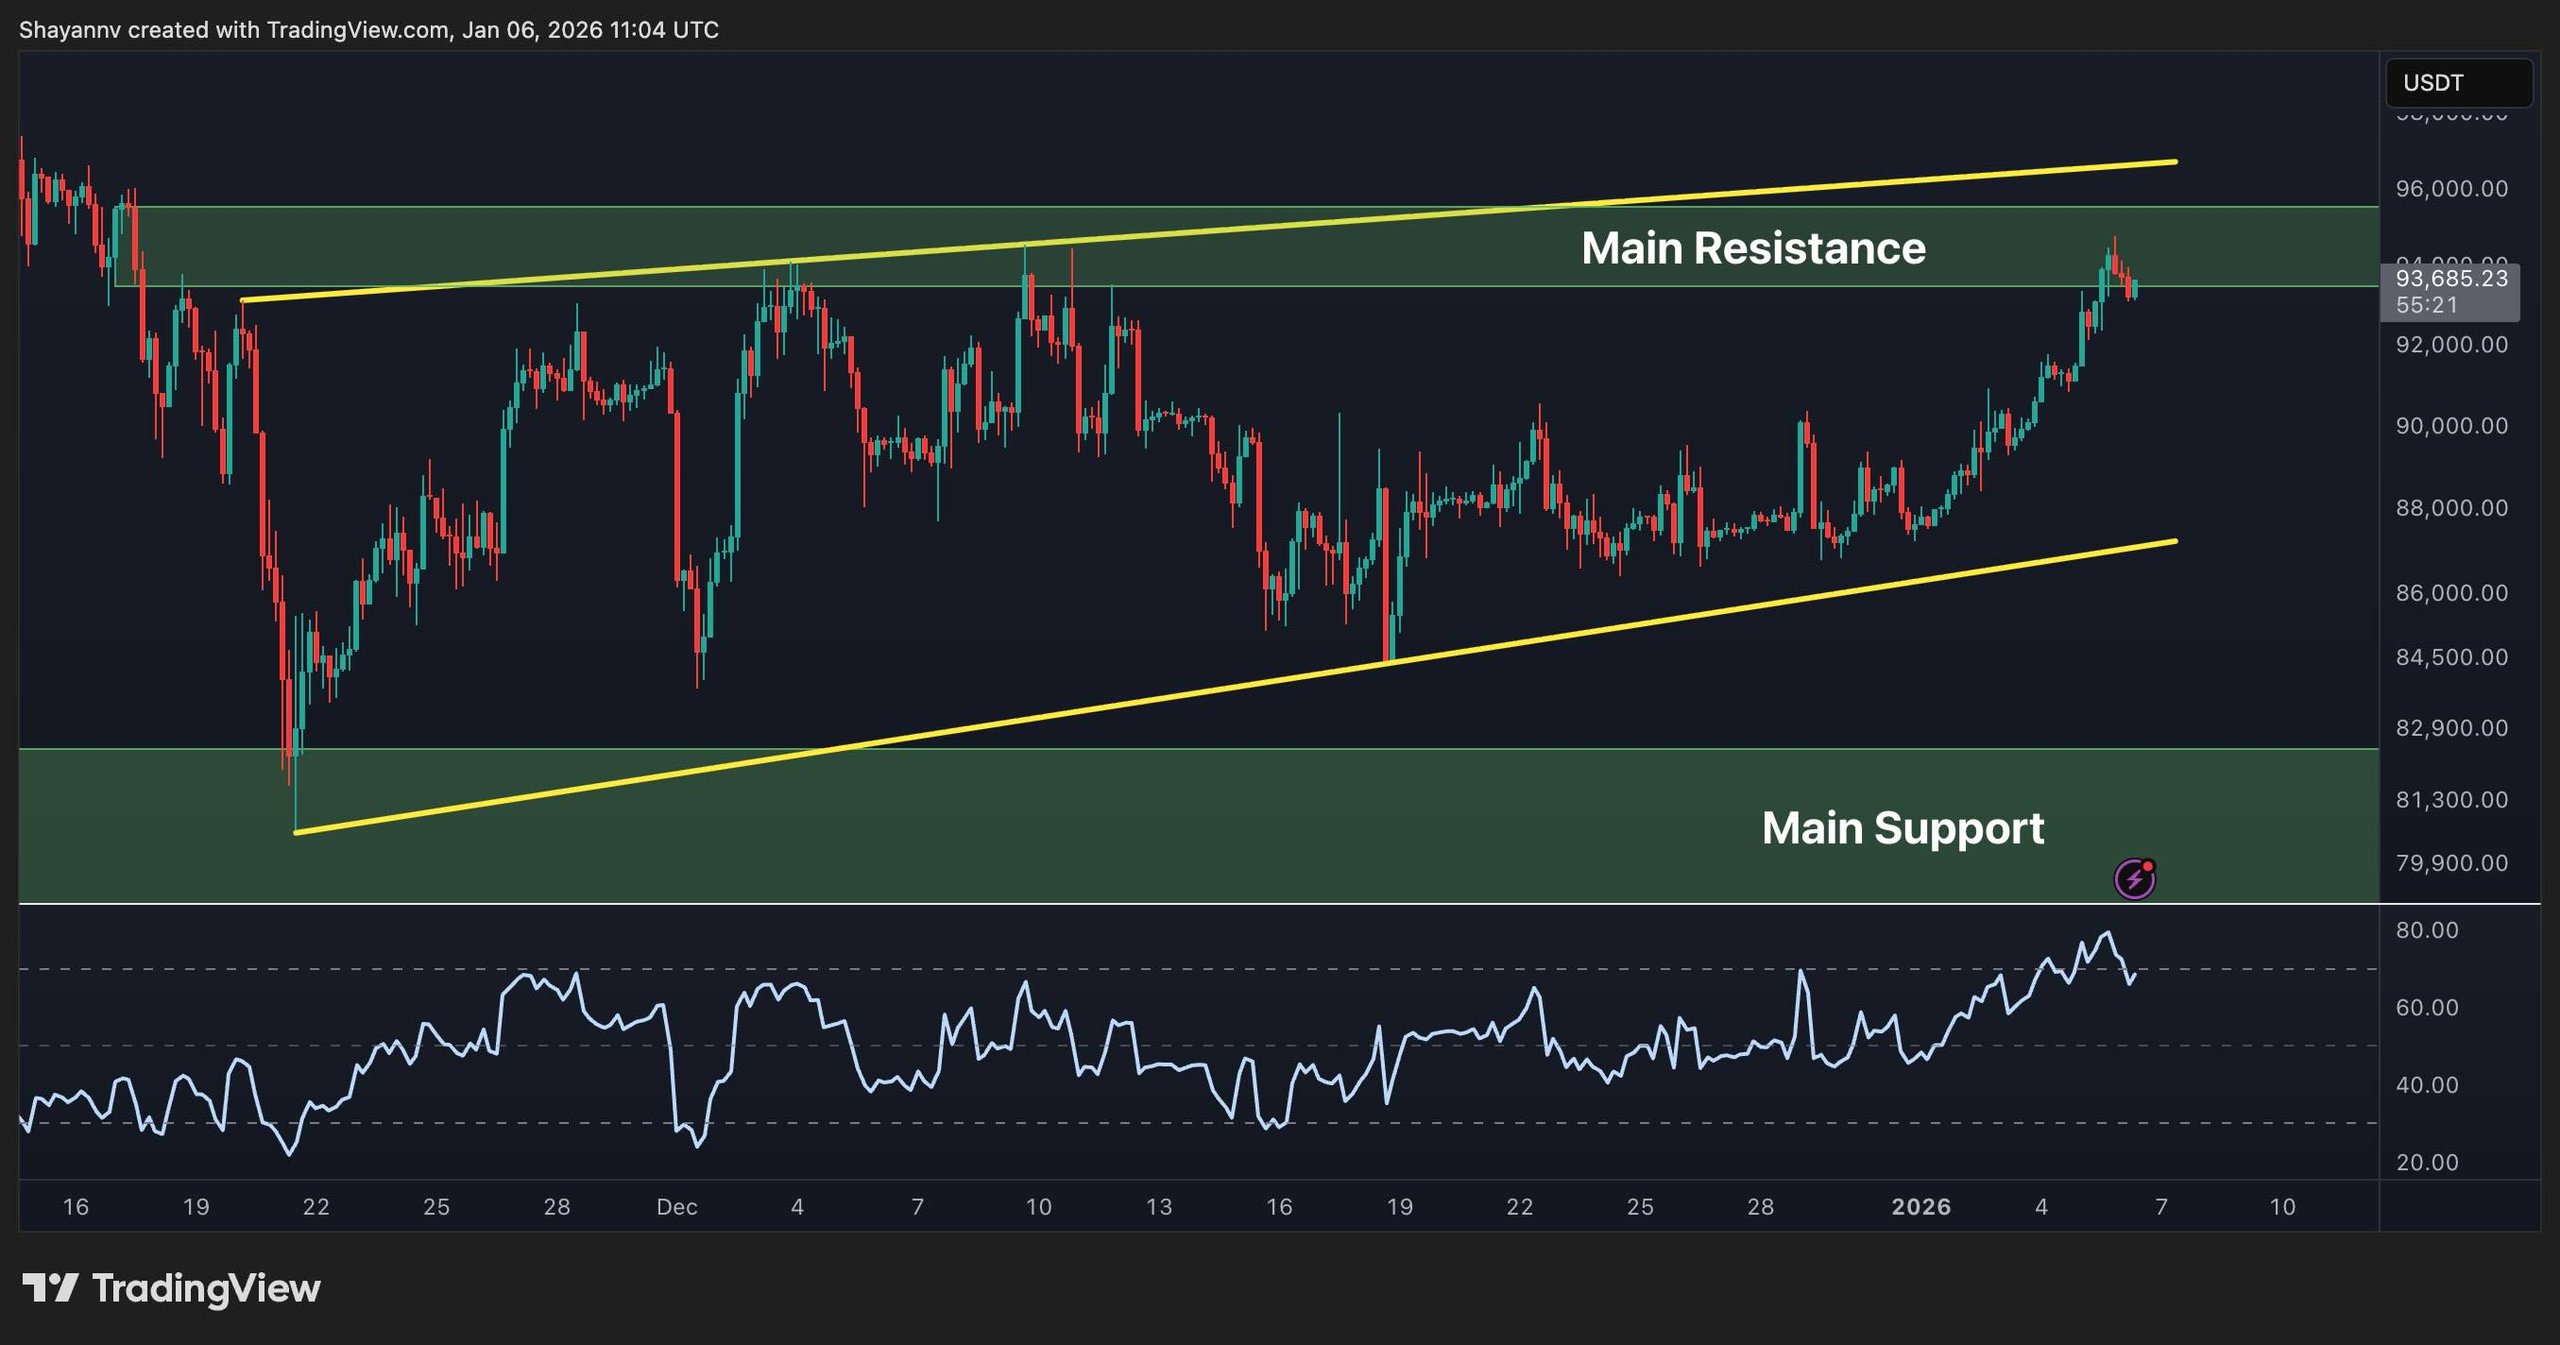
The 4-hour chart reveals a clear upward channel, with Bitcoin consistently achieving higher lows since mid-December. The price currently approaches the upper boundary of this channel, coinciding with the same $93,000 to $95,000 resistance noted in the daily analysis. This intersection might provoke a short-term price rejection or consolidation.
The support is found around $87,000, close to several short-term lows. Maintaining this level ensures that buyers retain their grip on market dynamics. A breakout above the $95,000 resistance could attract momentum buyers targeting the psychological $100,000 level as the next goal.
 4-Hour BTC Chart
Sentiment Analysis
Recent futures market data indicates a significant reduction in long liquidations since the drastic upheaval in December, providing a stable foundation for the current rally. This cooling off in the futures sector diminishes the chances of another abrupt market downturn shortly.
With open interest beginning to rise again and funding rates remaining relatively neutral, there is potential for upward movement provided that macroeconomic conditions do not instigate further forced selling. A crucial question remains: Can Bitcoin sustain its strength amid ongoing global volatility and looming pressures from traditional financial markets?
