Analyzing Ethereum's Price: Key Level for a Bullish Reversal
A comprehensive examination of Ethereum's current price dynamics and key resistance levels that could indicate a reversal from a bearish trend.


Ethereum is presently navigating through a corrective phase; however, recent price movements suggest that market participants are trying to find stability after an extended downturn. The current activities are occurring at critical technical levels, which makes the next price direction crucial.
Ethereum Price Overview: Daily Chart
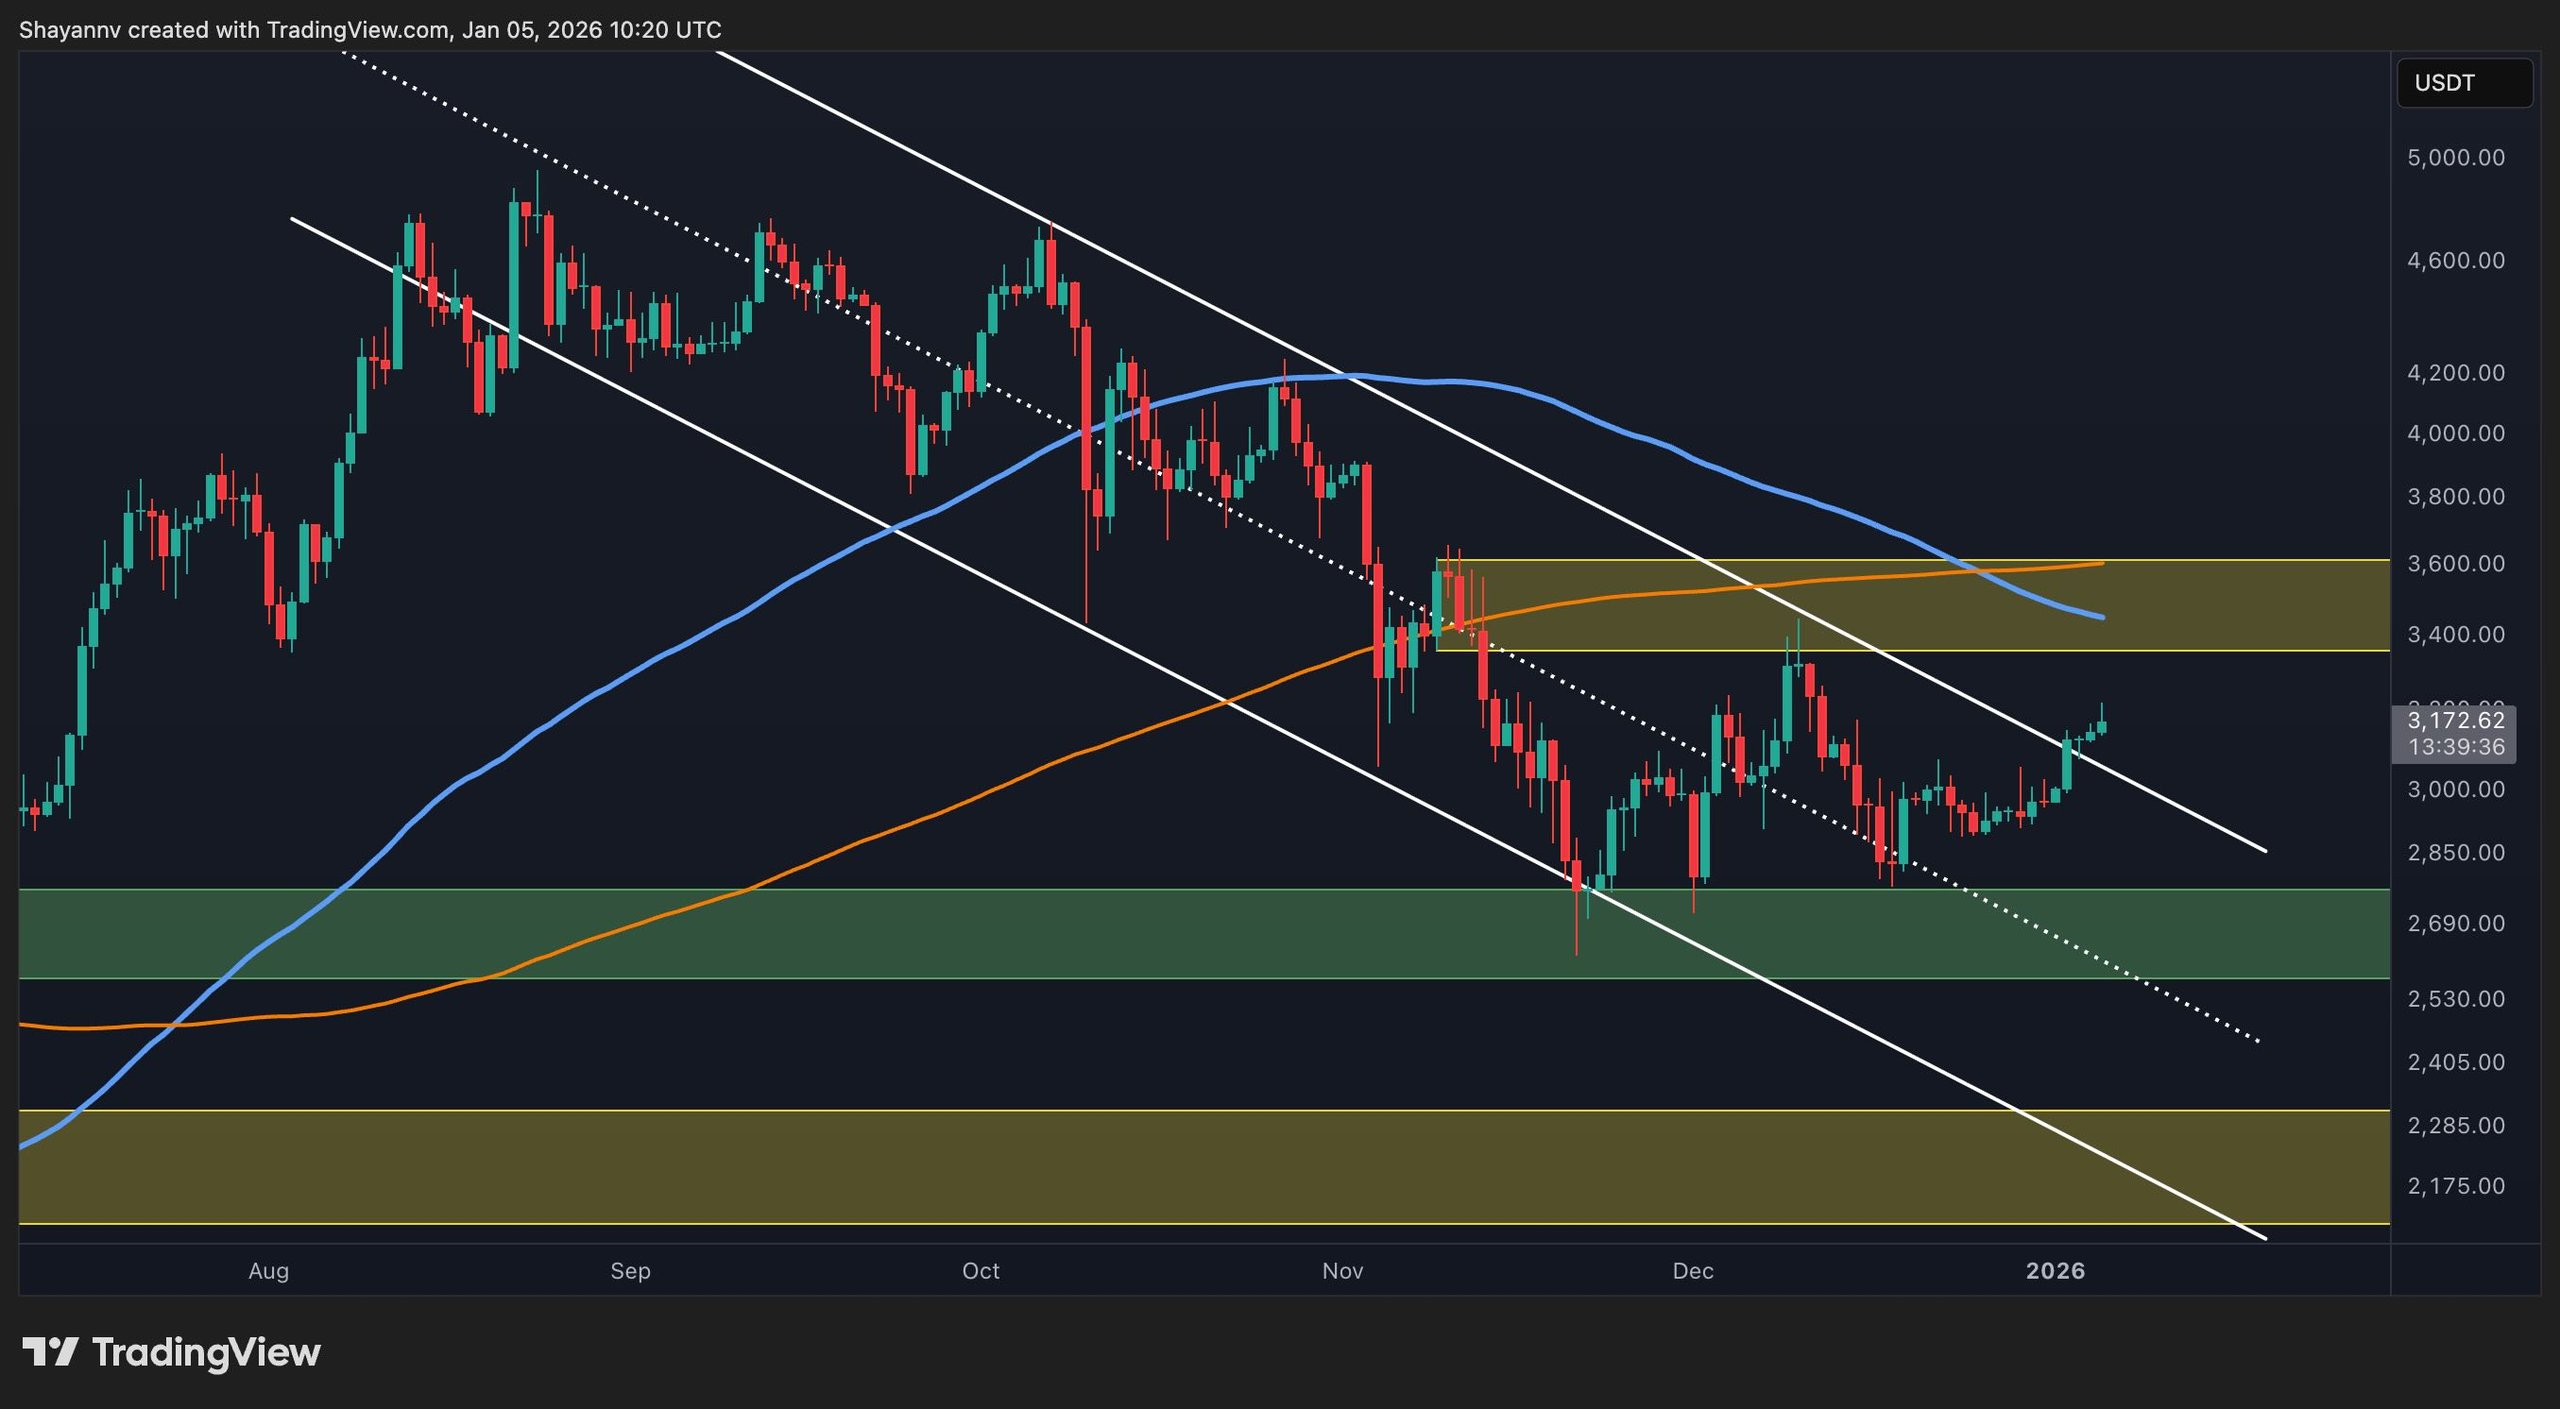
In the daily analysis, ETH has marginally broken out above a wider descending channel that has been defining its price behavior for several months. The recent upswing has taken the asset close to the upper limit of this structure, leading to a local attempt at a bullish breakout above short-term channel indicators. Yet, this breakout is lacking robust momentum, casting doubt on whether it signifies a genuine trend change.
ETH is currently facing resistance under a significant supply area at around the $3,500 mark, coinciding with moving average resistance that has been capping upward price movements and triggering selling pressure. Until Ethereum can establish itself above this level, the overall daily structure is likely to remain neutral to bearish, with any upward movements better categorized as brief retracements rather than signs of a trend reversal.
ETH Daily Chart
ETH/USDT Four-Hour Chart
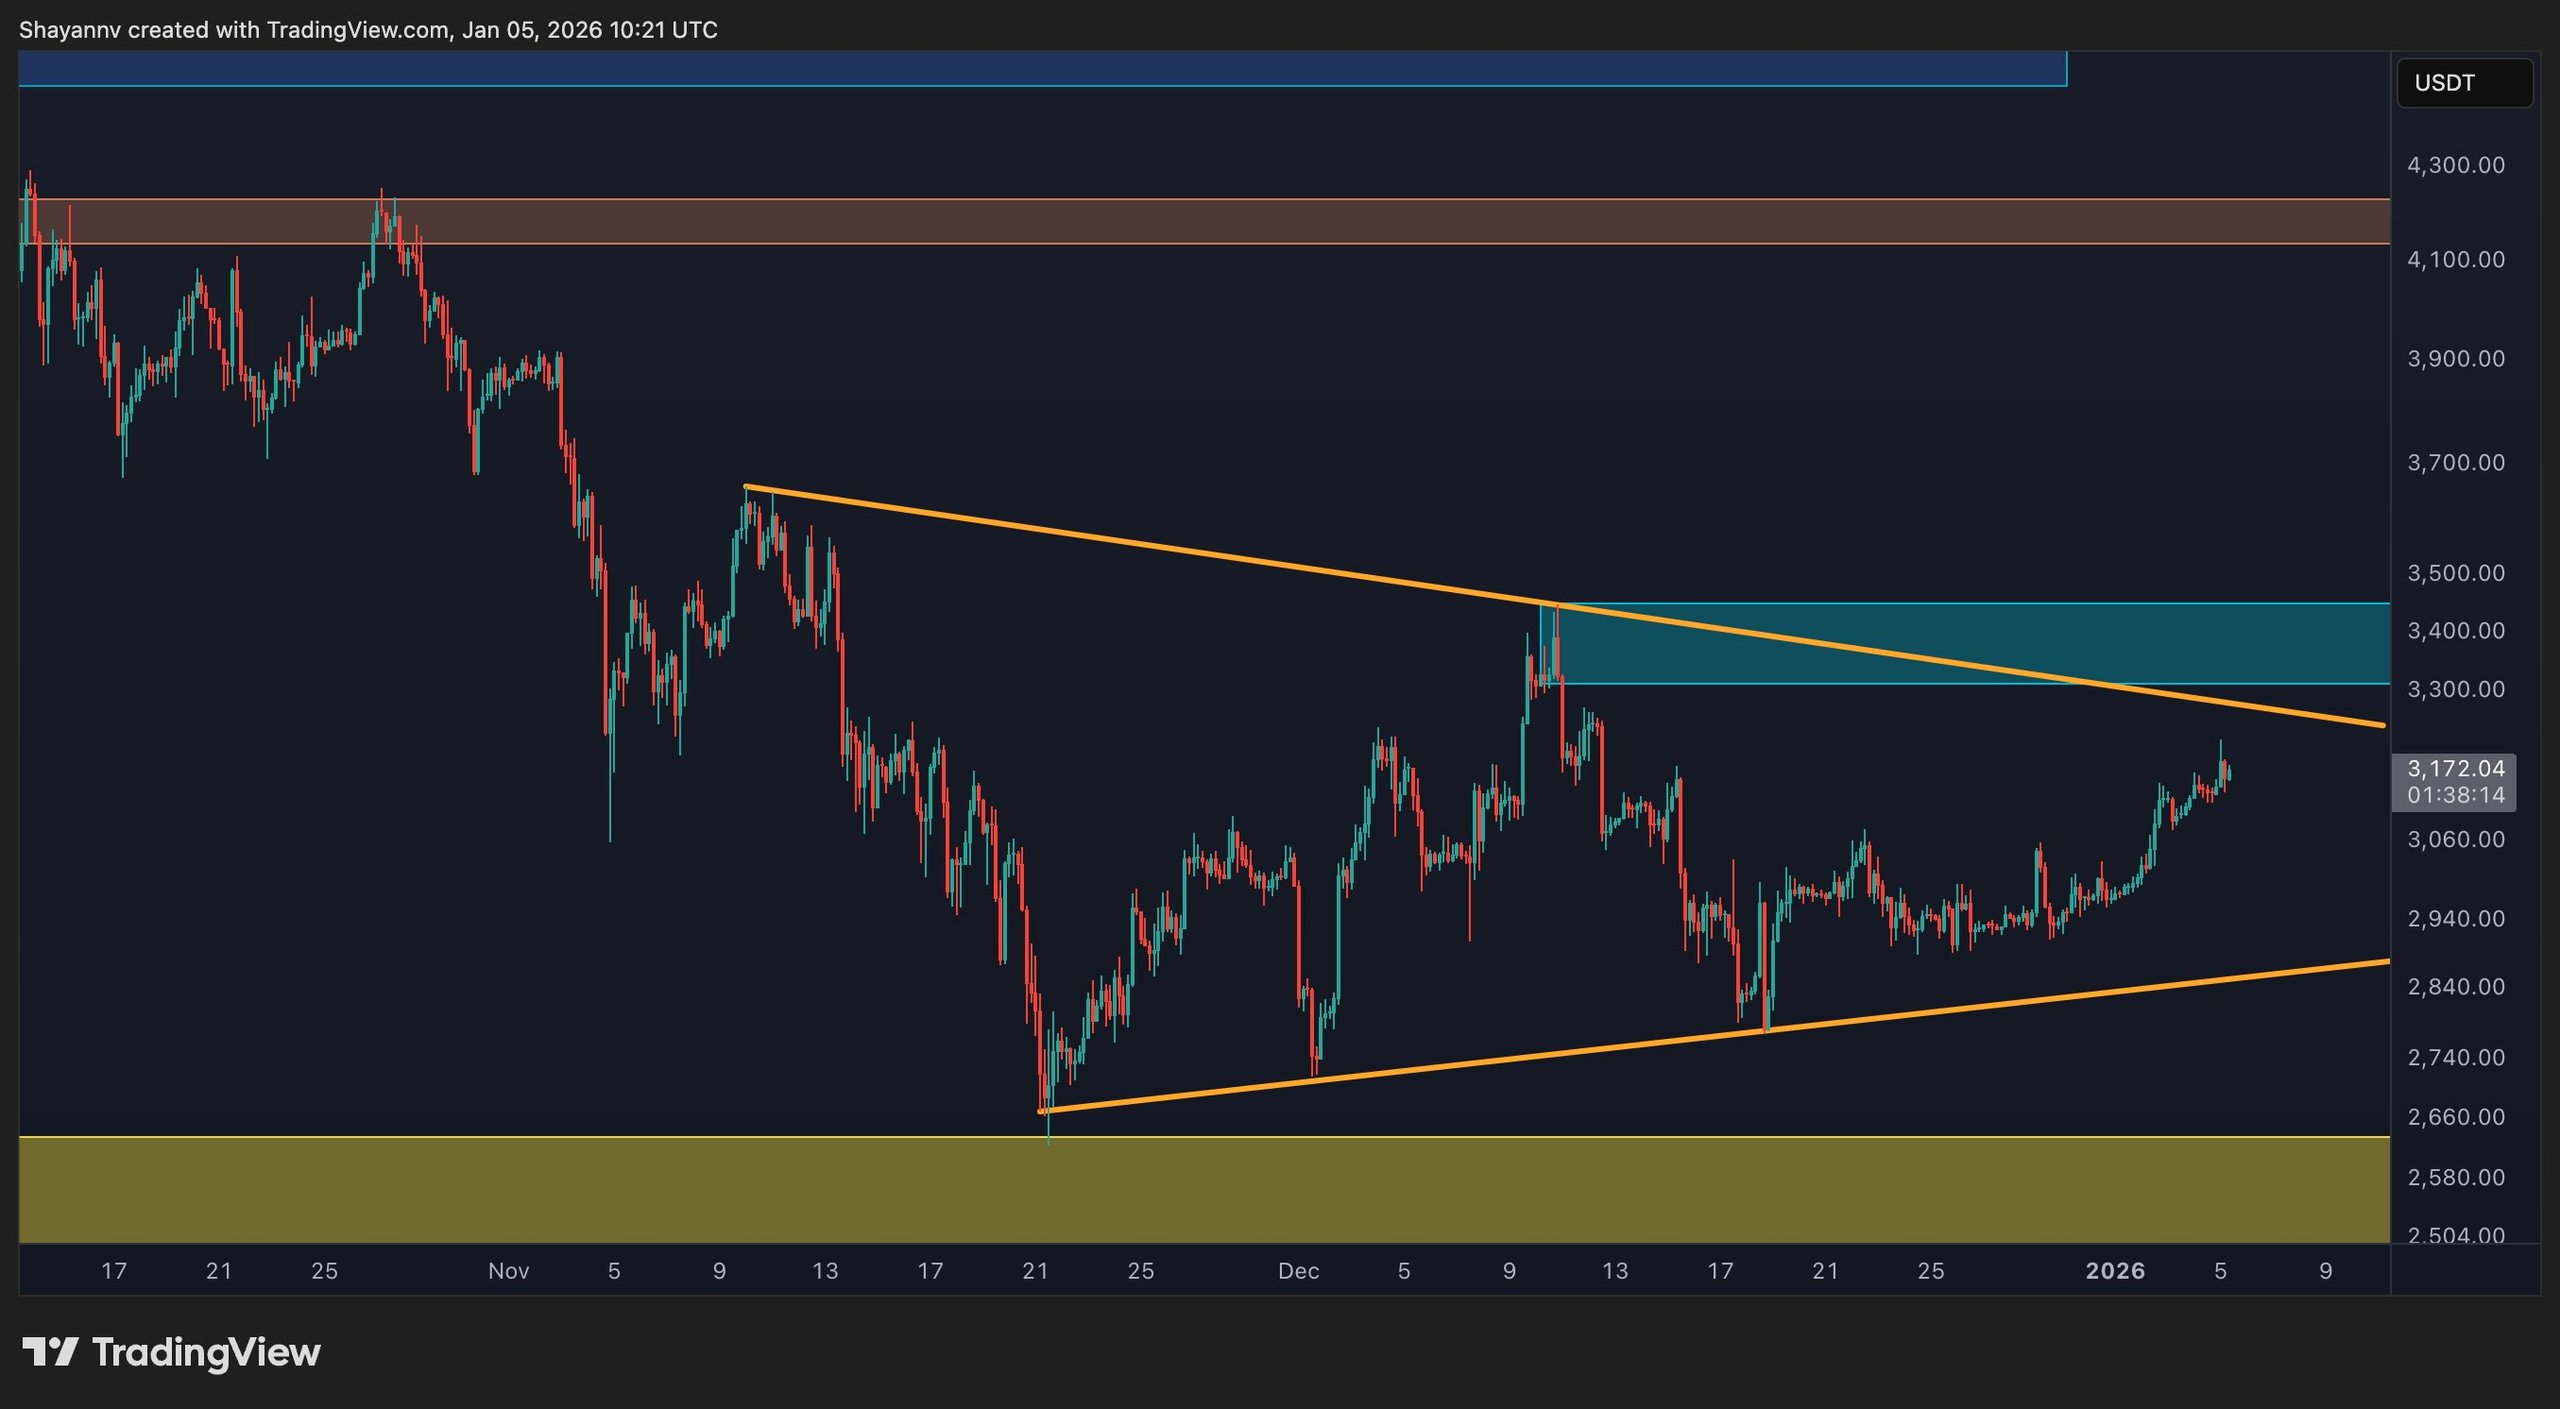
On a four-hour timeframe, Ethereum is consolidating within a narrowing wedge structure, reflecting reduced volatility and a balance between buying and selling activity following previous strong selloffs. Price movements are currently pending a catalyst for the next directional commitment.
Simply consolidating is insufficient to indicate a bullish continuation. A clear breakout above the wedge at $3,400, ideally with strong movement and acceptance, is required to affirm renewed bullish momentum. Until this happens, the current price movement should be viewed as corrective within a narrow range, with heightened risk of another rejection if resistance holds.
 ETH 4-Hour Chart
Onchain Metrics
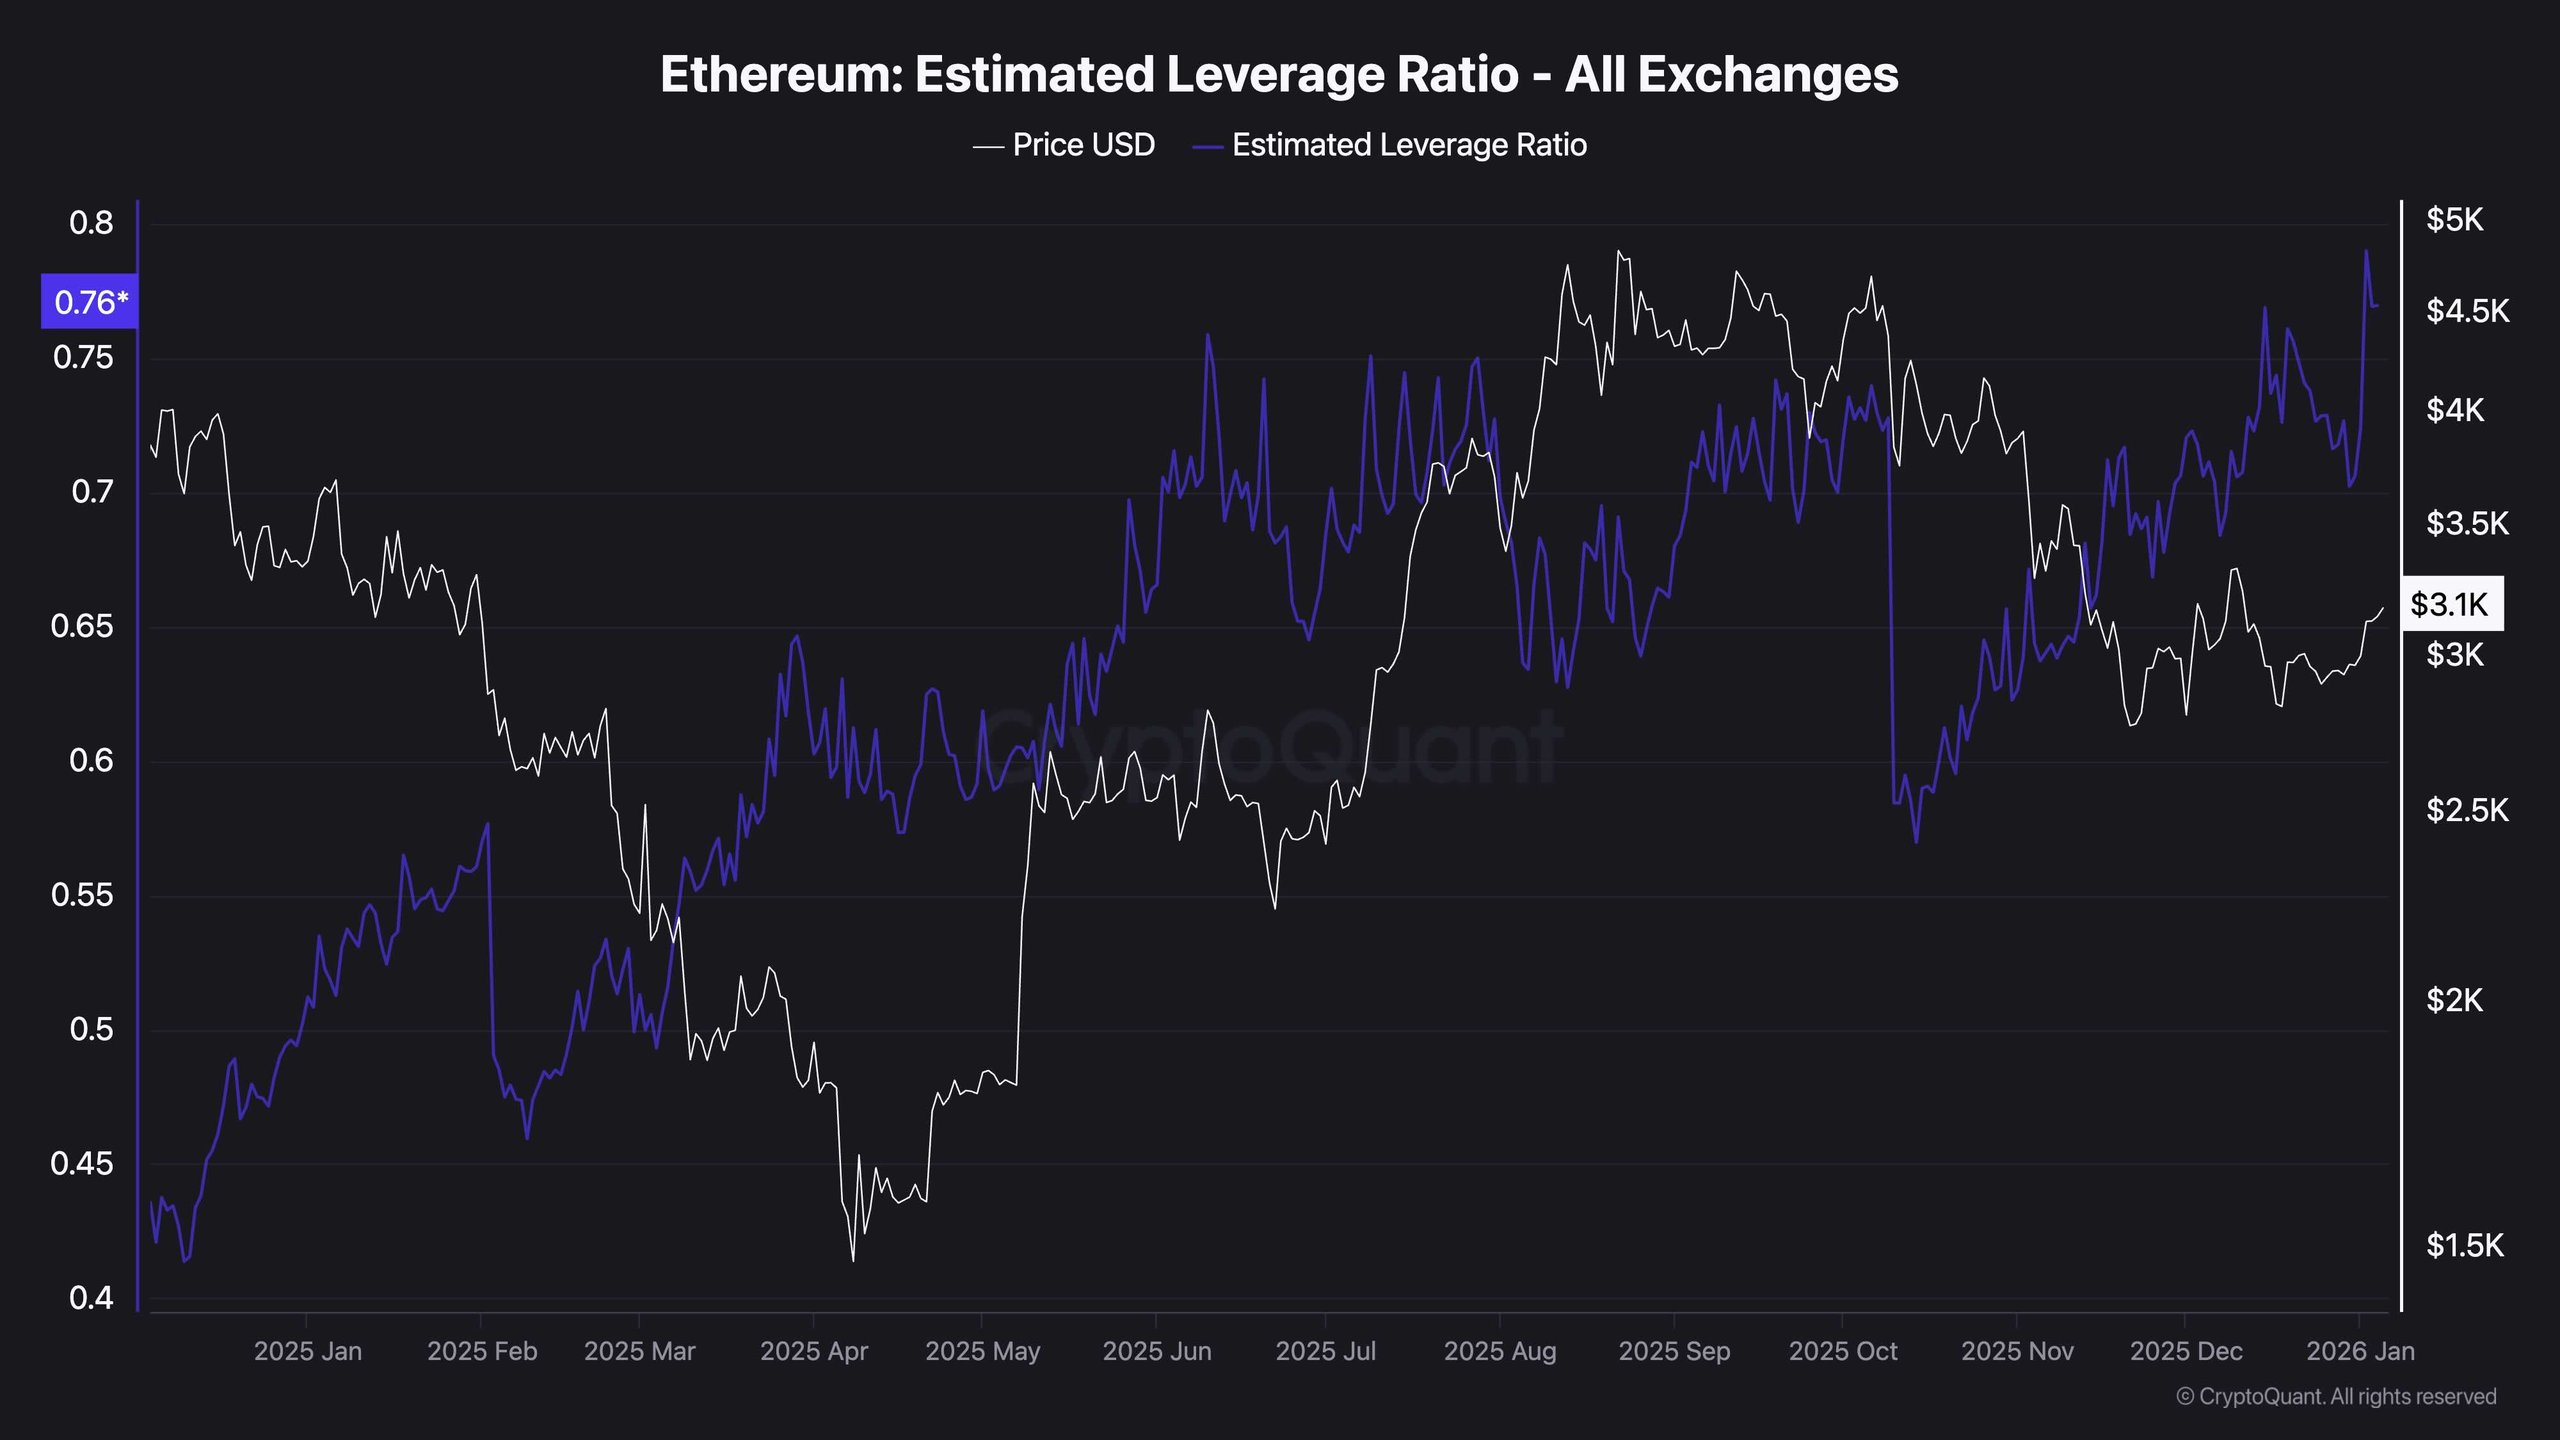
Ethereum’s leverage ratio on Binance has hit record highs at 0.8, surpassing previous peaks from December. This rise indicates increased confidence among traders and vulnerabilities in the market.
This metric shows how extensively market participants are using leveraged funds relative to their collateral. High levels signal the presence of highly leveraged positions, which can trigger forced liquidations, heightening volatility.
Ethereum is currently trading around $3,100, suggesting a positive momentum from liquidity in the futures market. However, while rising prices and increasing leverage often indicate a strong risk appetite, they also create instability. Elevated leverage can quickly turn into downward pressure if market sentiment shifts or price movements become stagnant.
Historically, when leverage ratios reach these levels, sharp volatility spikes typically follow due to market corrections or aggressive price shifts to curb excessive leverage. While the current increased leverage ratio does not serve as an outright bearish signal, it raises caution, especially for short-term traders operating in a crowded and highly leveraged market environment.
 Ethereum Leverage Ratio
