


Ethereum’s price curve suggests a promising ascent following a 10% increase in January, with emphasis on its potential to reach $3,900 if certain key trends are met.
Highlights:
- Price Influences: Ethereum is nearing a double bottom formation that points to a $3,900 target.
- Key Trend: The 200-period EMA needs to be overcome for sustained growth.
- Market Dynamics: Retail interest is rising while large holders show signs of reducing positions.
Formation of the Double Bottom
As observed on the daily chart, a double bottom pattern forms throughout Q4 2025, showcasing a resilient demand zone. If validated, a breakout toward around $3,900, about 20% above, is aimed.
Source: Cointelegraph/TradingView
However, the primary barrier remains the 200-period EMA. Following a bearish trend shift in November, Ethereum has been unable to surpass this threshold, facing setbacks each time.
An ongoing daily close above this EMA would indicate market acceptance over long-term resistance. A robust close above $3,300 could validate a positive structural change in the daily framework as well.
For further details, refer to this related article.
Market Trends Observation
- The Cumulative Volume Delta (CVD) demonstrates a recent uptick in market activity with buyer dominance; this trend is reflected across multiple markets, indicating active demand.
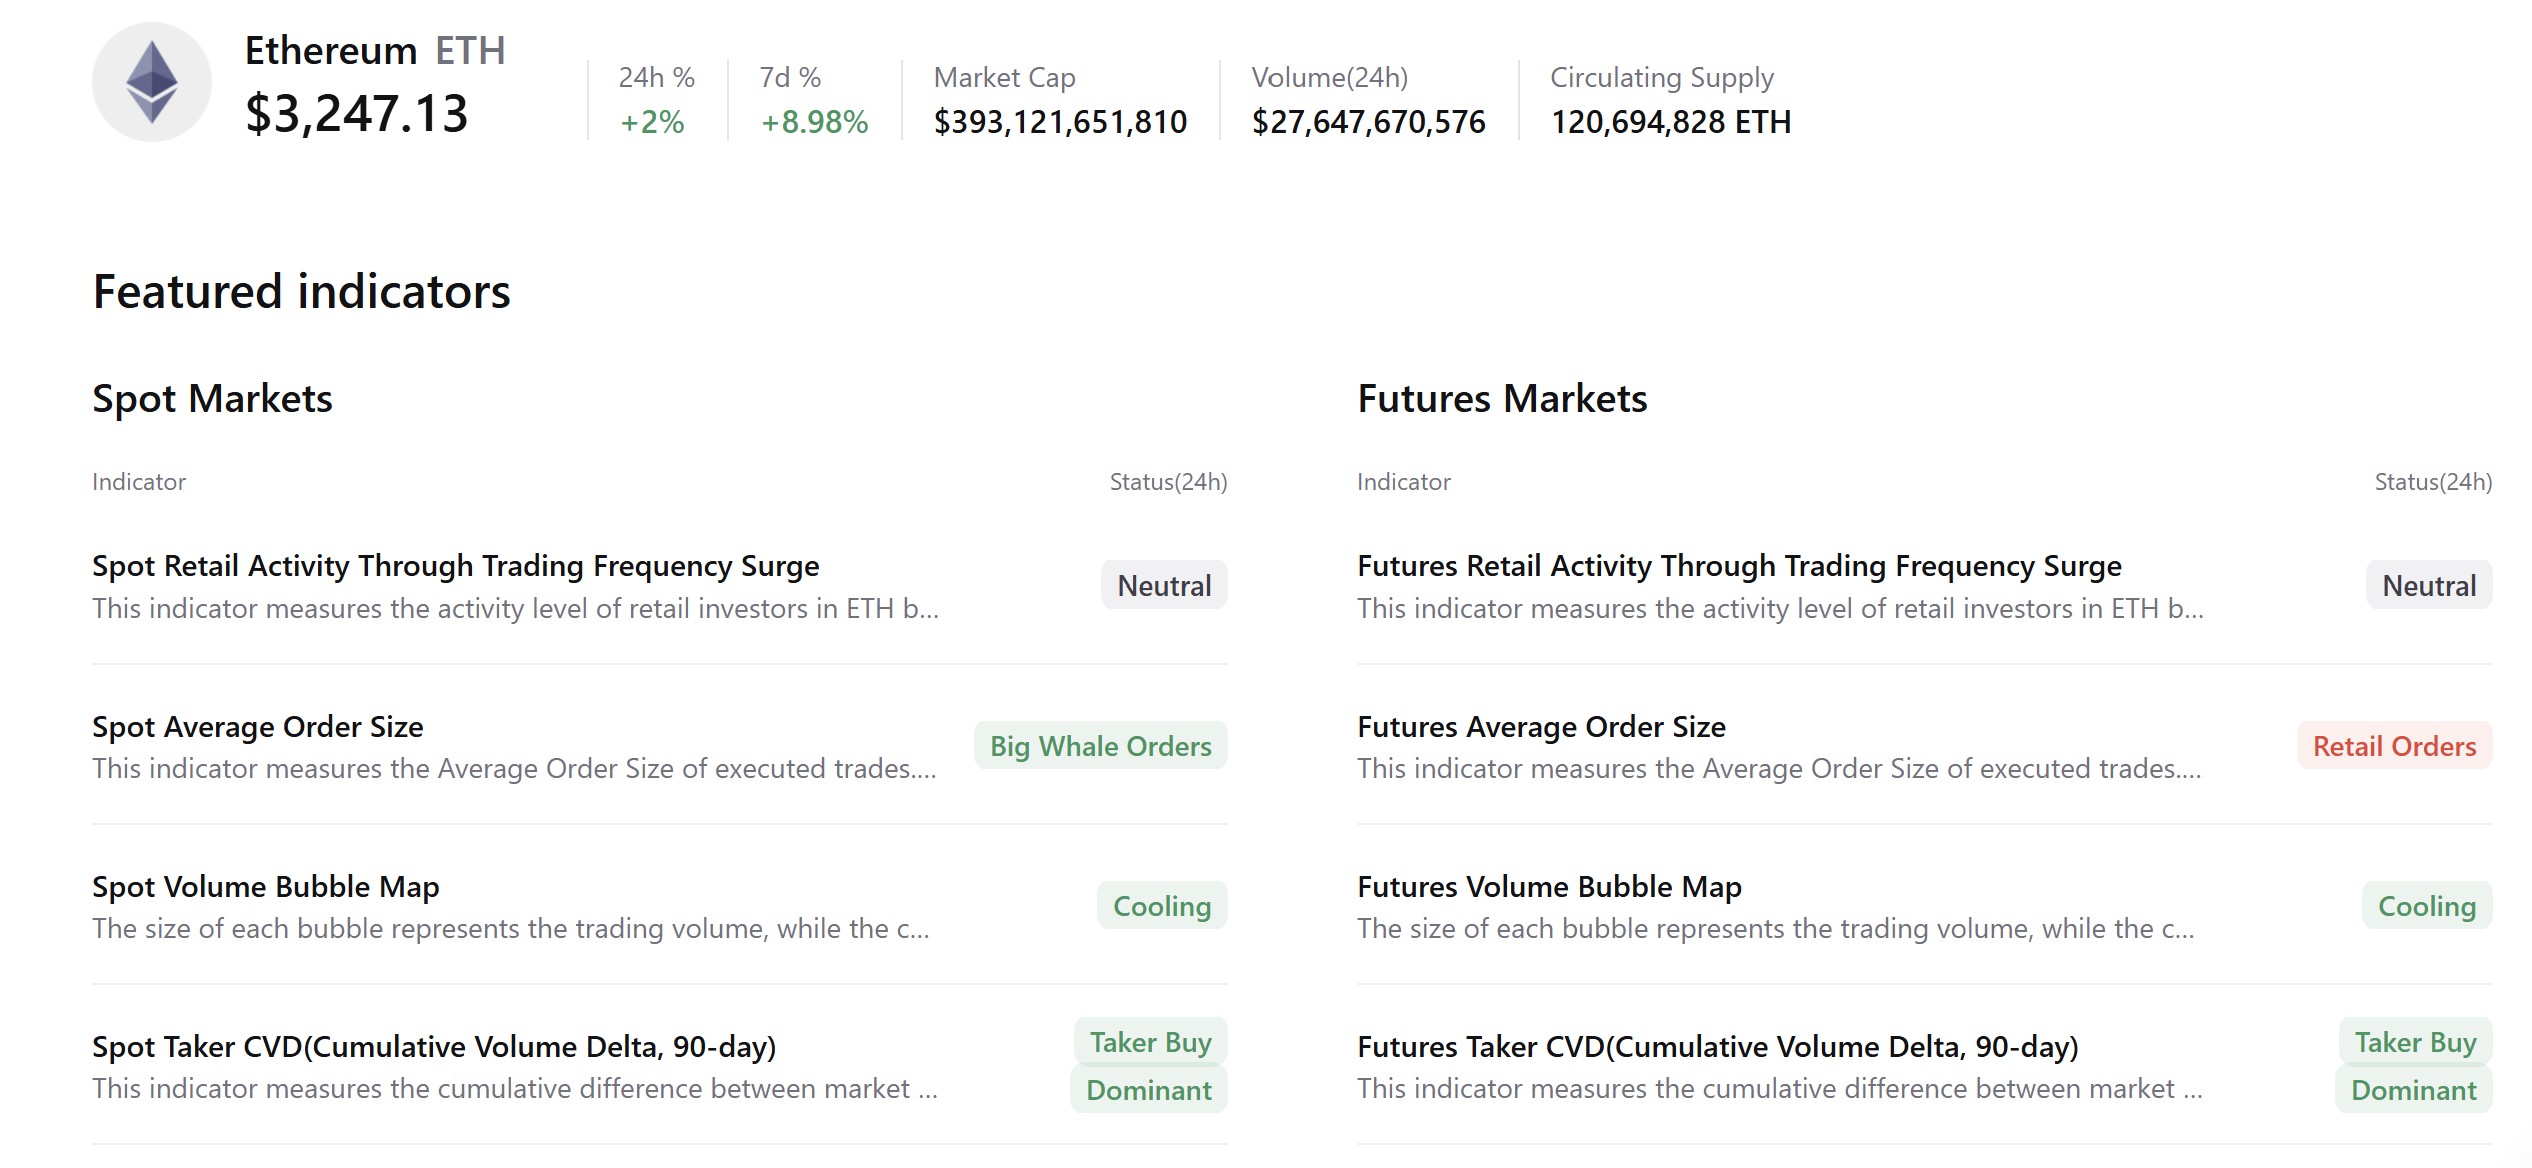 Ethereum CVD Data
Source: CryptoQuant
Ethereum CVD Data
Source: CryptoQuant
Over recent weeks, significant demand has been recorded, yet larger wallets show signs of consolidation selling, presenting a divided market sentiment.
Consequently, smaller traders appear to be pivotal in driving Ethereum’s recent recovery. The ability for ETH to surpass the 200-EMA could determine further institutional re-engagement or continued price stagnation.
Disclaimer: This article does not serve as investment advice. Trading involves risks, and readers are urged to conduct personal due diligence before making any financial decisions.
