
Bitcoin's RSI Points to Potential $105K Price Surge as Bullish Indicators Increase
Market analysis suggests Bitcoin could reach $105,000 in the coming weeks based on the relative strength index (RSI) showing bullish signals.


Bitcoin’s relative strength index (RSI) is showing bullish signals across various timeframes, which has led a trader to predict a potential price of $105,000 for Bitcoin in just three to four weeks.
Key Highlights:
- Bitcoin has experienced bullish RSI signals as prices consolidate.
- A significant breakout on the weekly RSI was noted in December and continues to hold.
- Despite the optimism, some traders still believe the price may dip to new lows.
RSI Indicates Potential Price Surge
In a recent X post, trader BitBull highlighted the ongoing breakout in Bitcoin’s weekly RSI. While the price action seems rangebound, this crucial RSI trend shift has been in effect since December.
“The weekly RSI for $BTC indicates further upward momentum. It broke out from its three-month downtrend and is currently above the breakout level,” BitBull remarked.
BitBull also shared a chart linking this recent breakout with one from the previous year, which led to substantial price gains after April’s lows of $75,000.
“I predict BTC could reach between $103K and $105K in three to four weeks,” he stated.
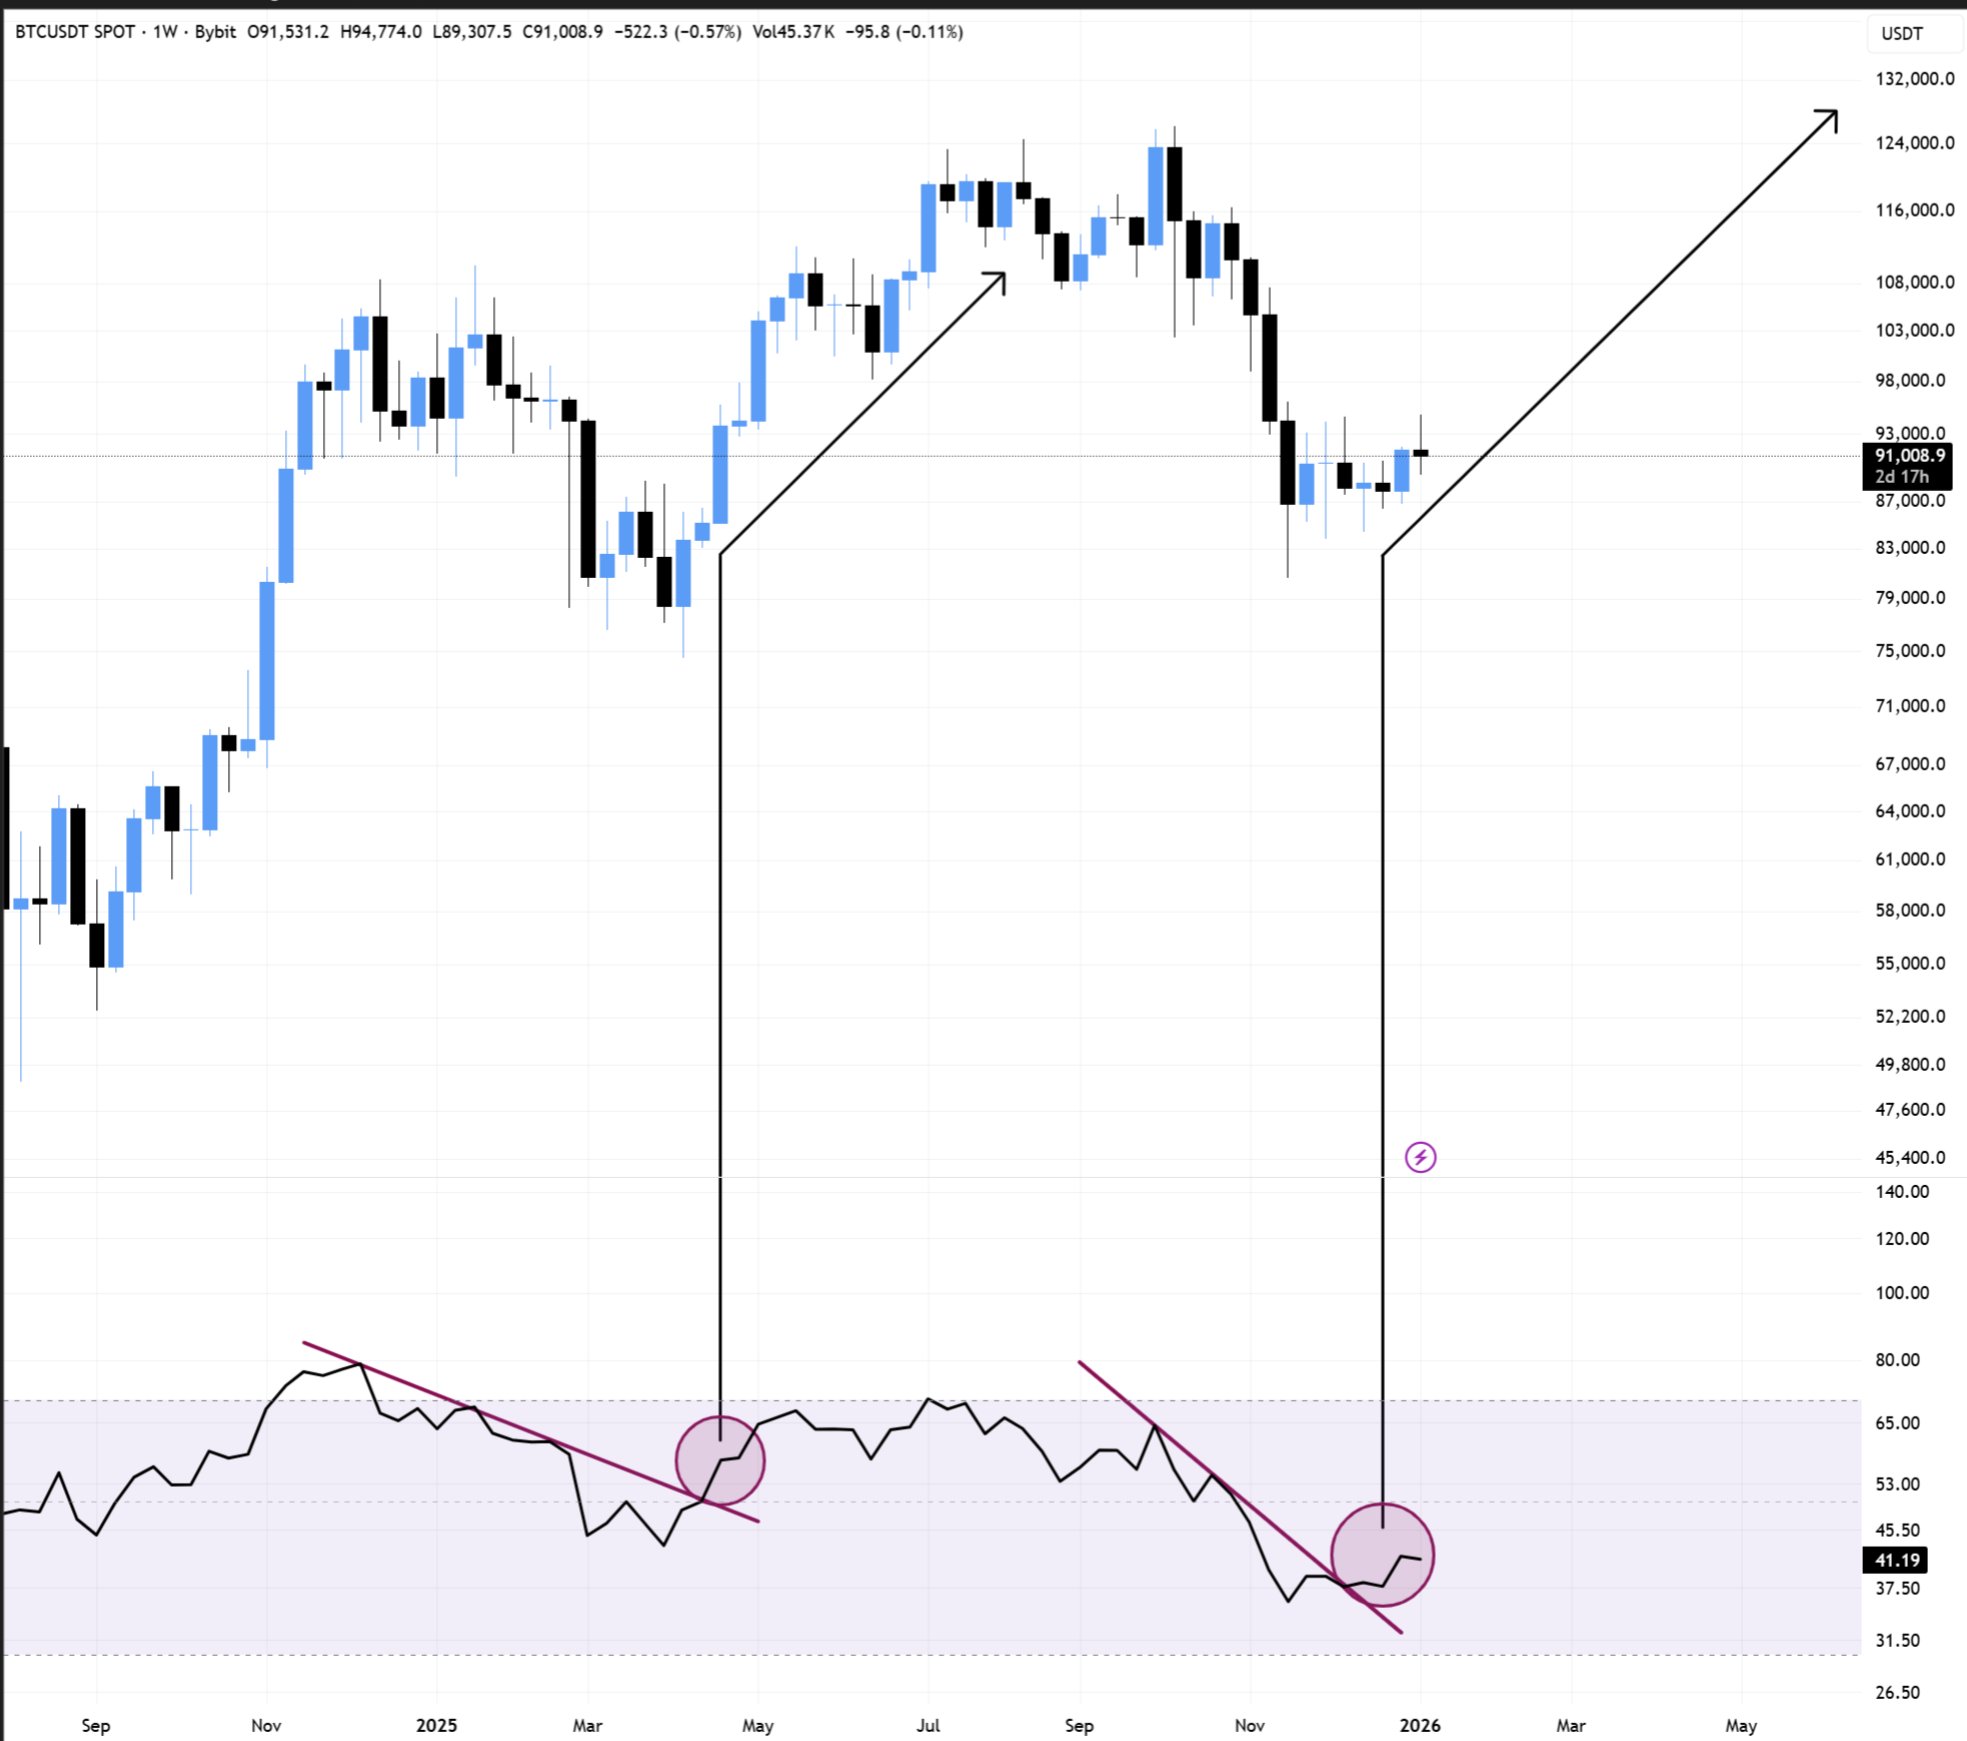 Bitcoin Weekly RSI
BTC/USDT one-week chart with RSI data. Source: BitBull/X
Bitcoin Weekly RSI
BTC/USDT one-week chart with RSI data. Source: BitBull/X
This week, James Easton, host of the DeCRYPTion podcast, noted positive RSI developments on the two-week chart, showing levels lower than during Bitcoin’s last full bear market in late 2022. He stated, “It has recently turned bullish. Prepare for volatility.”
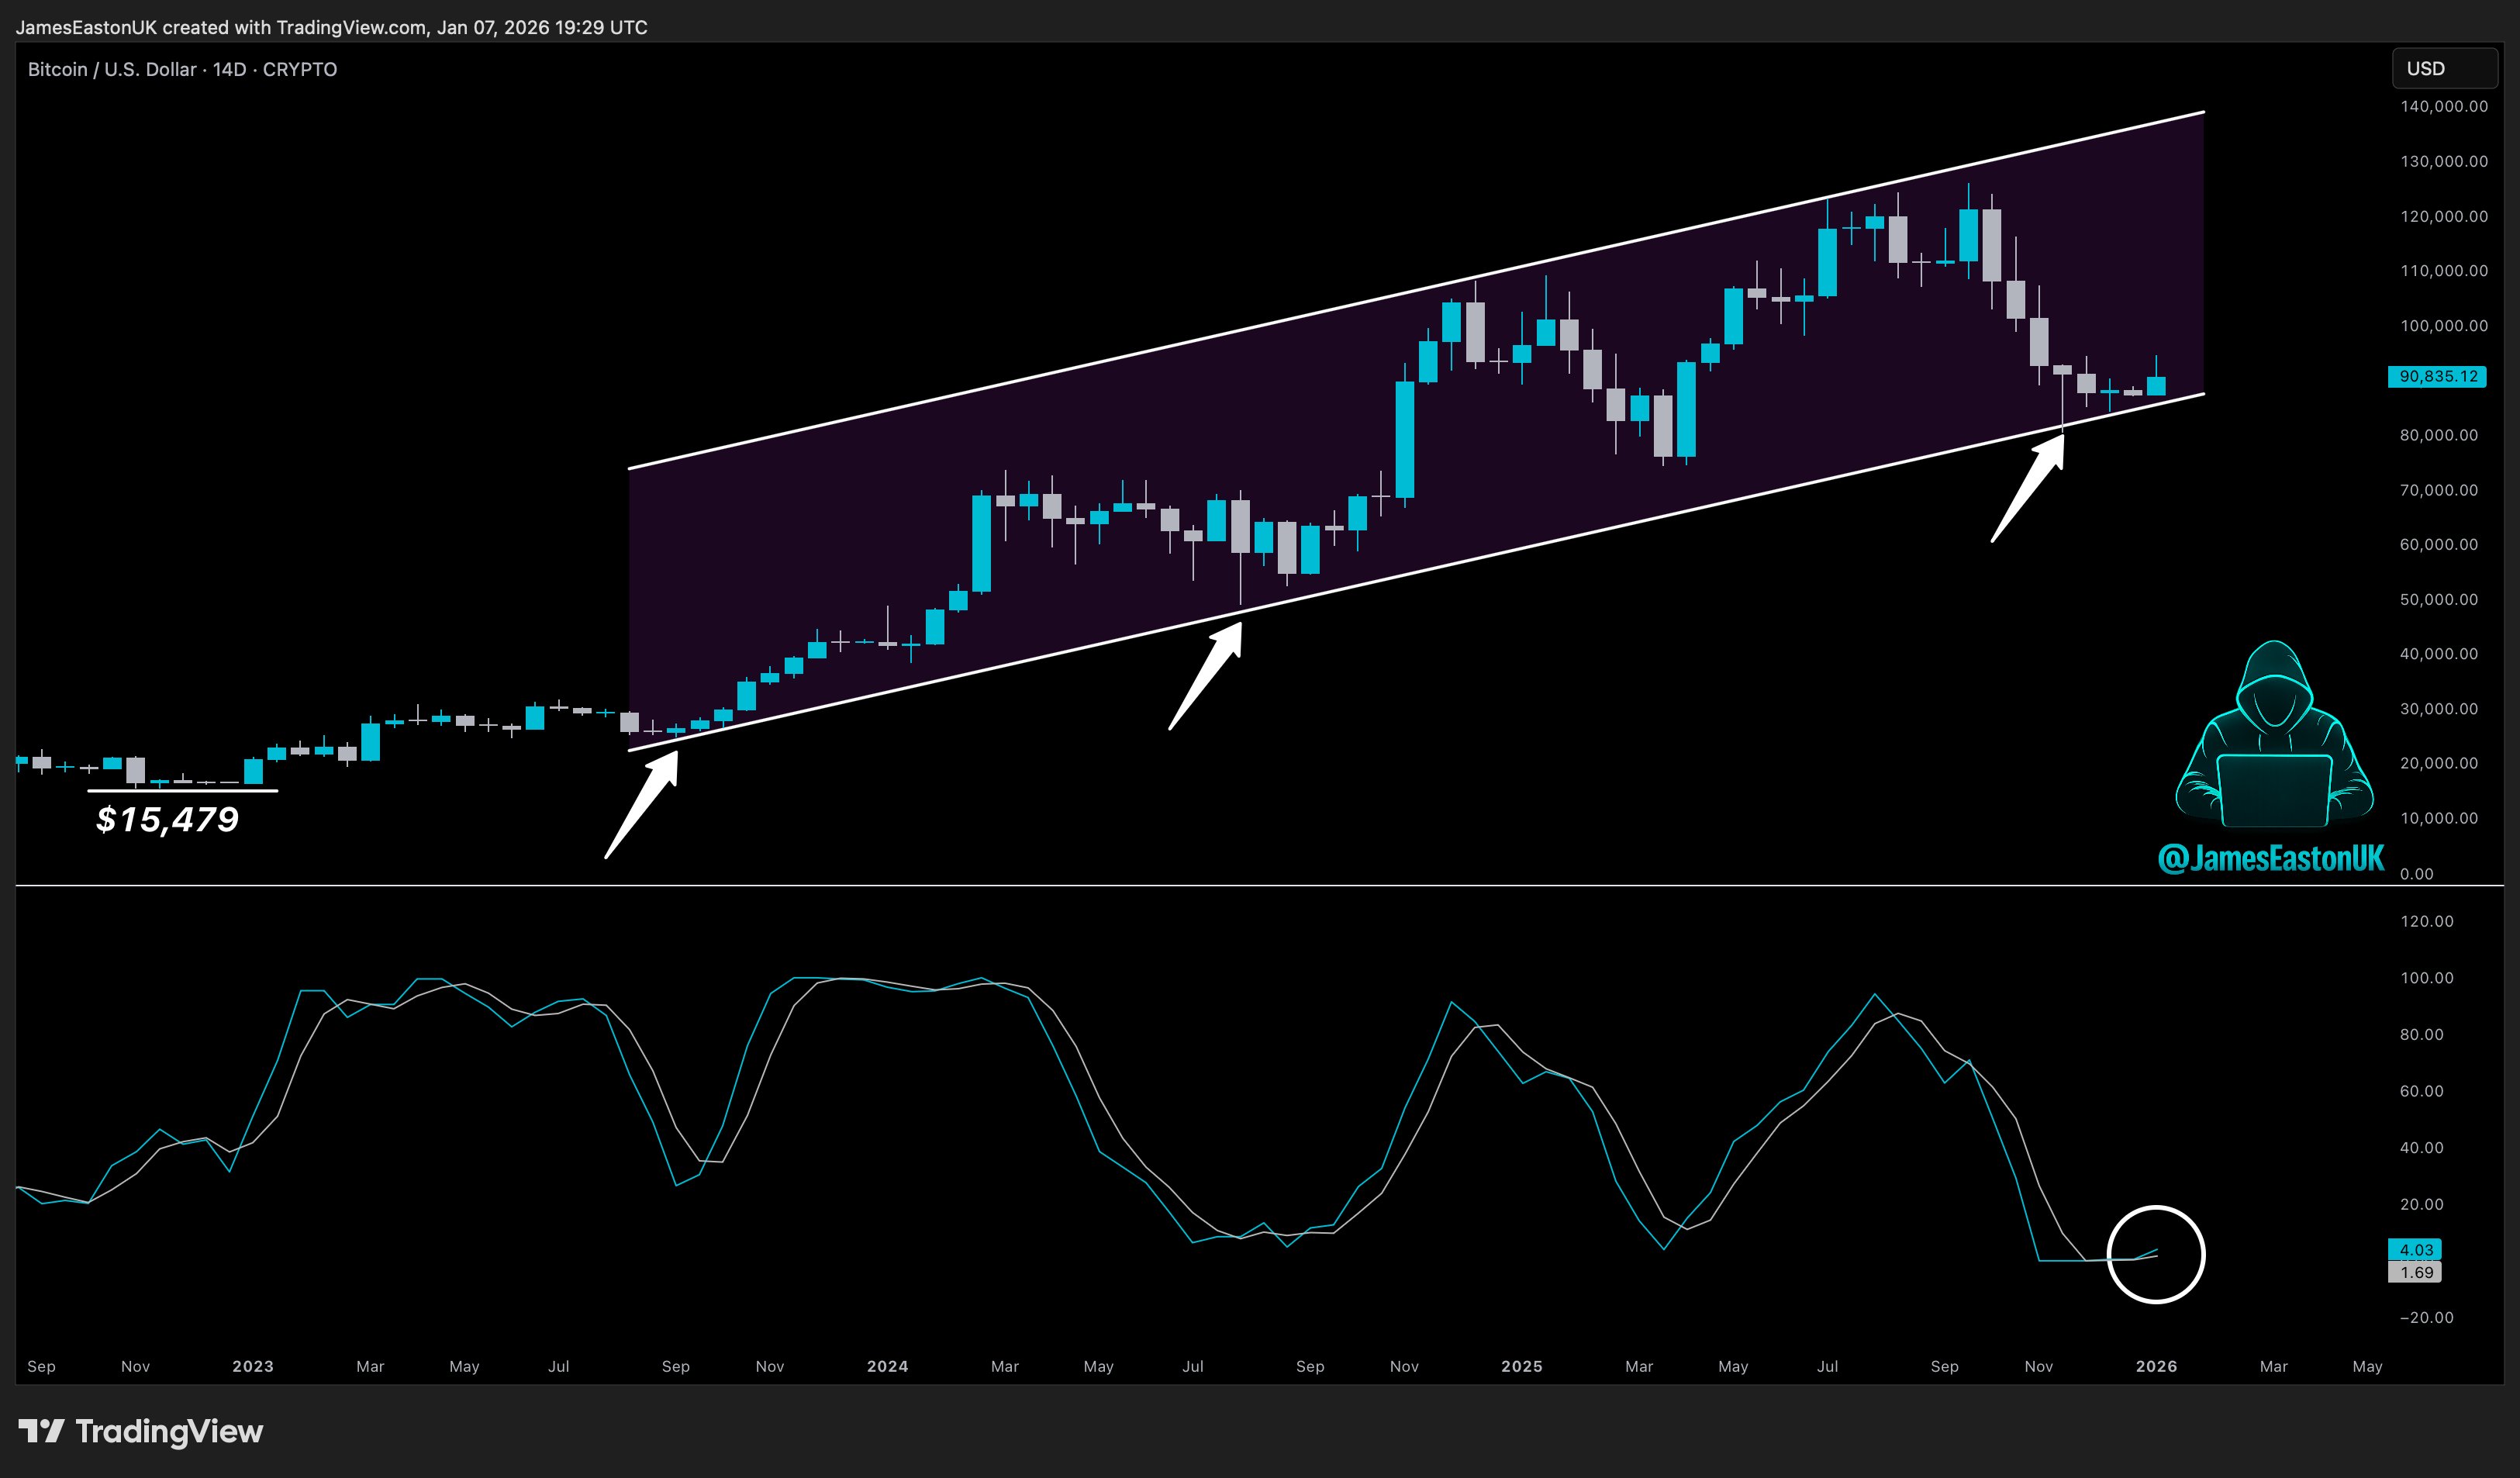 Bitcoin Two-Week RSI
BTC/USD two-week chart with RSI data. Source: James Easton/X
Bitcoin Two-Week RSI
BTC/USD two-week chart with RSI data. Source: James Easton/X
Lower timeframe RSI signals are also encouraging. Data from TradingView reveals a potential hidden bullish divergence, suggesting that sell-side pressure may weaken as Bitcoin aims to establish $90,000 as a support zone.
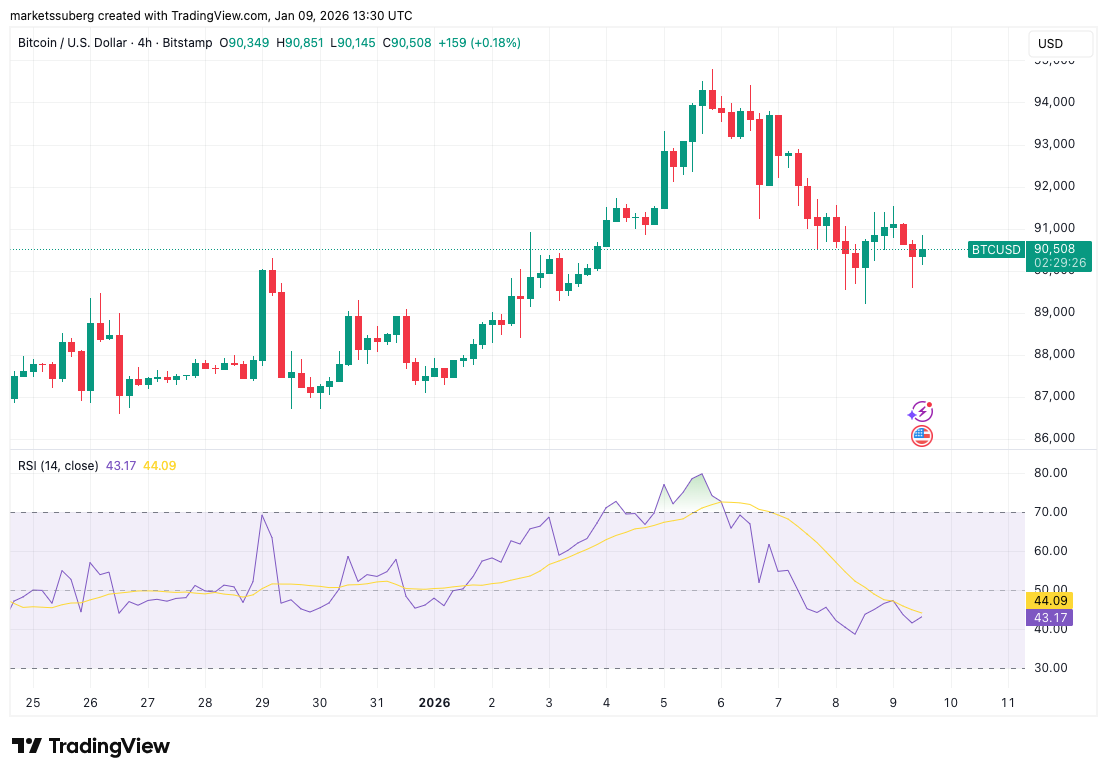 Bitcoin Four-Hour RSI
BTC/USD four-hour chart with RSI data. Source: Cointelegraph/TradingView
Bitcoin Four-Hour RSI
BTC/USD four-hour chart with RSI data. Source: Cointelegraph/TradingView
“Clear US Buyer” Countering Bitcoin Sell Pressure
As previously reported by Cointelegraph, traders expect market corrections as the search for a long-term support base continues.
Among bearish sentiments, there are predictions that the price may revisit April’s lows around $75,000, with some suggesting a possible decline below the 2026 yearly open.
“Failure to turn resistance into support soon could lead to another sweep of these lows for $BTC,” warned Johnny, a trader. Tweet.
Trader Skew also noted market behaviors, identifying a passive seller at $91,500 as suppressing price movements. He concluded that the buy pressure seen during the US trading session seemed linked to a determined US buyer.
