Trouble Ahead for Bitcoin After $95K Rejection: An Analysis
An in-depth look at Bitcoin's current trading patterns after being rejected at a critical resistance level.


Bitcoin has entered a consolidation phase following a considerable sell-off in November of last year. Although the overarching trend continues to be under pressure, the short-term price movements are confined within a narrowing range. There are indications of diminishing demand from U.S. spot buyers, marking prices that remain below major moving averages. BTC traders must monitor support levels and assess if buyers can regain their momentum from this point onward.
Bitcoin Price Analysis: Daily Overview
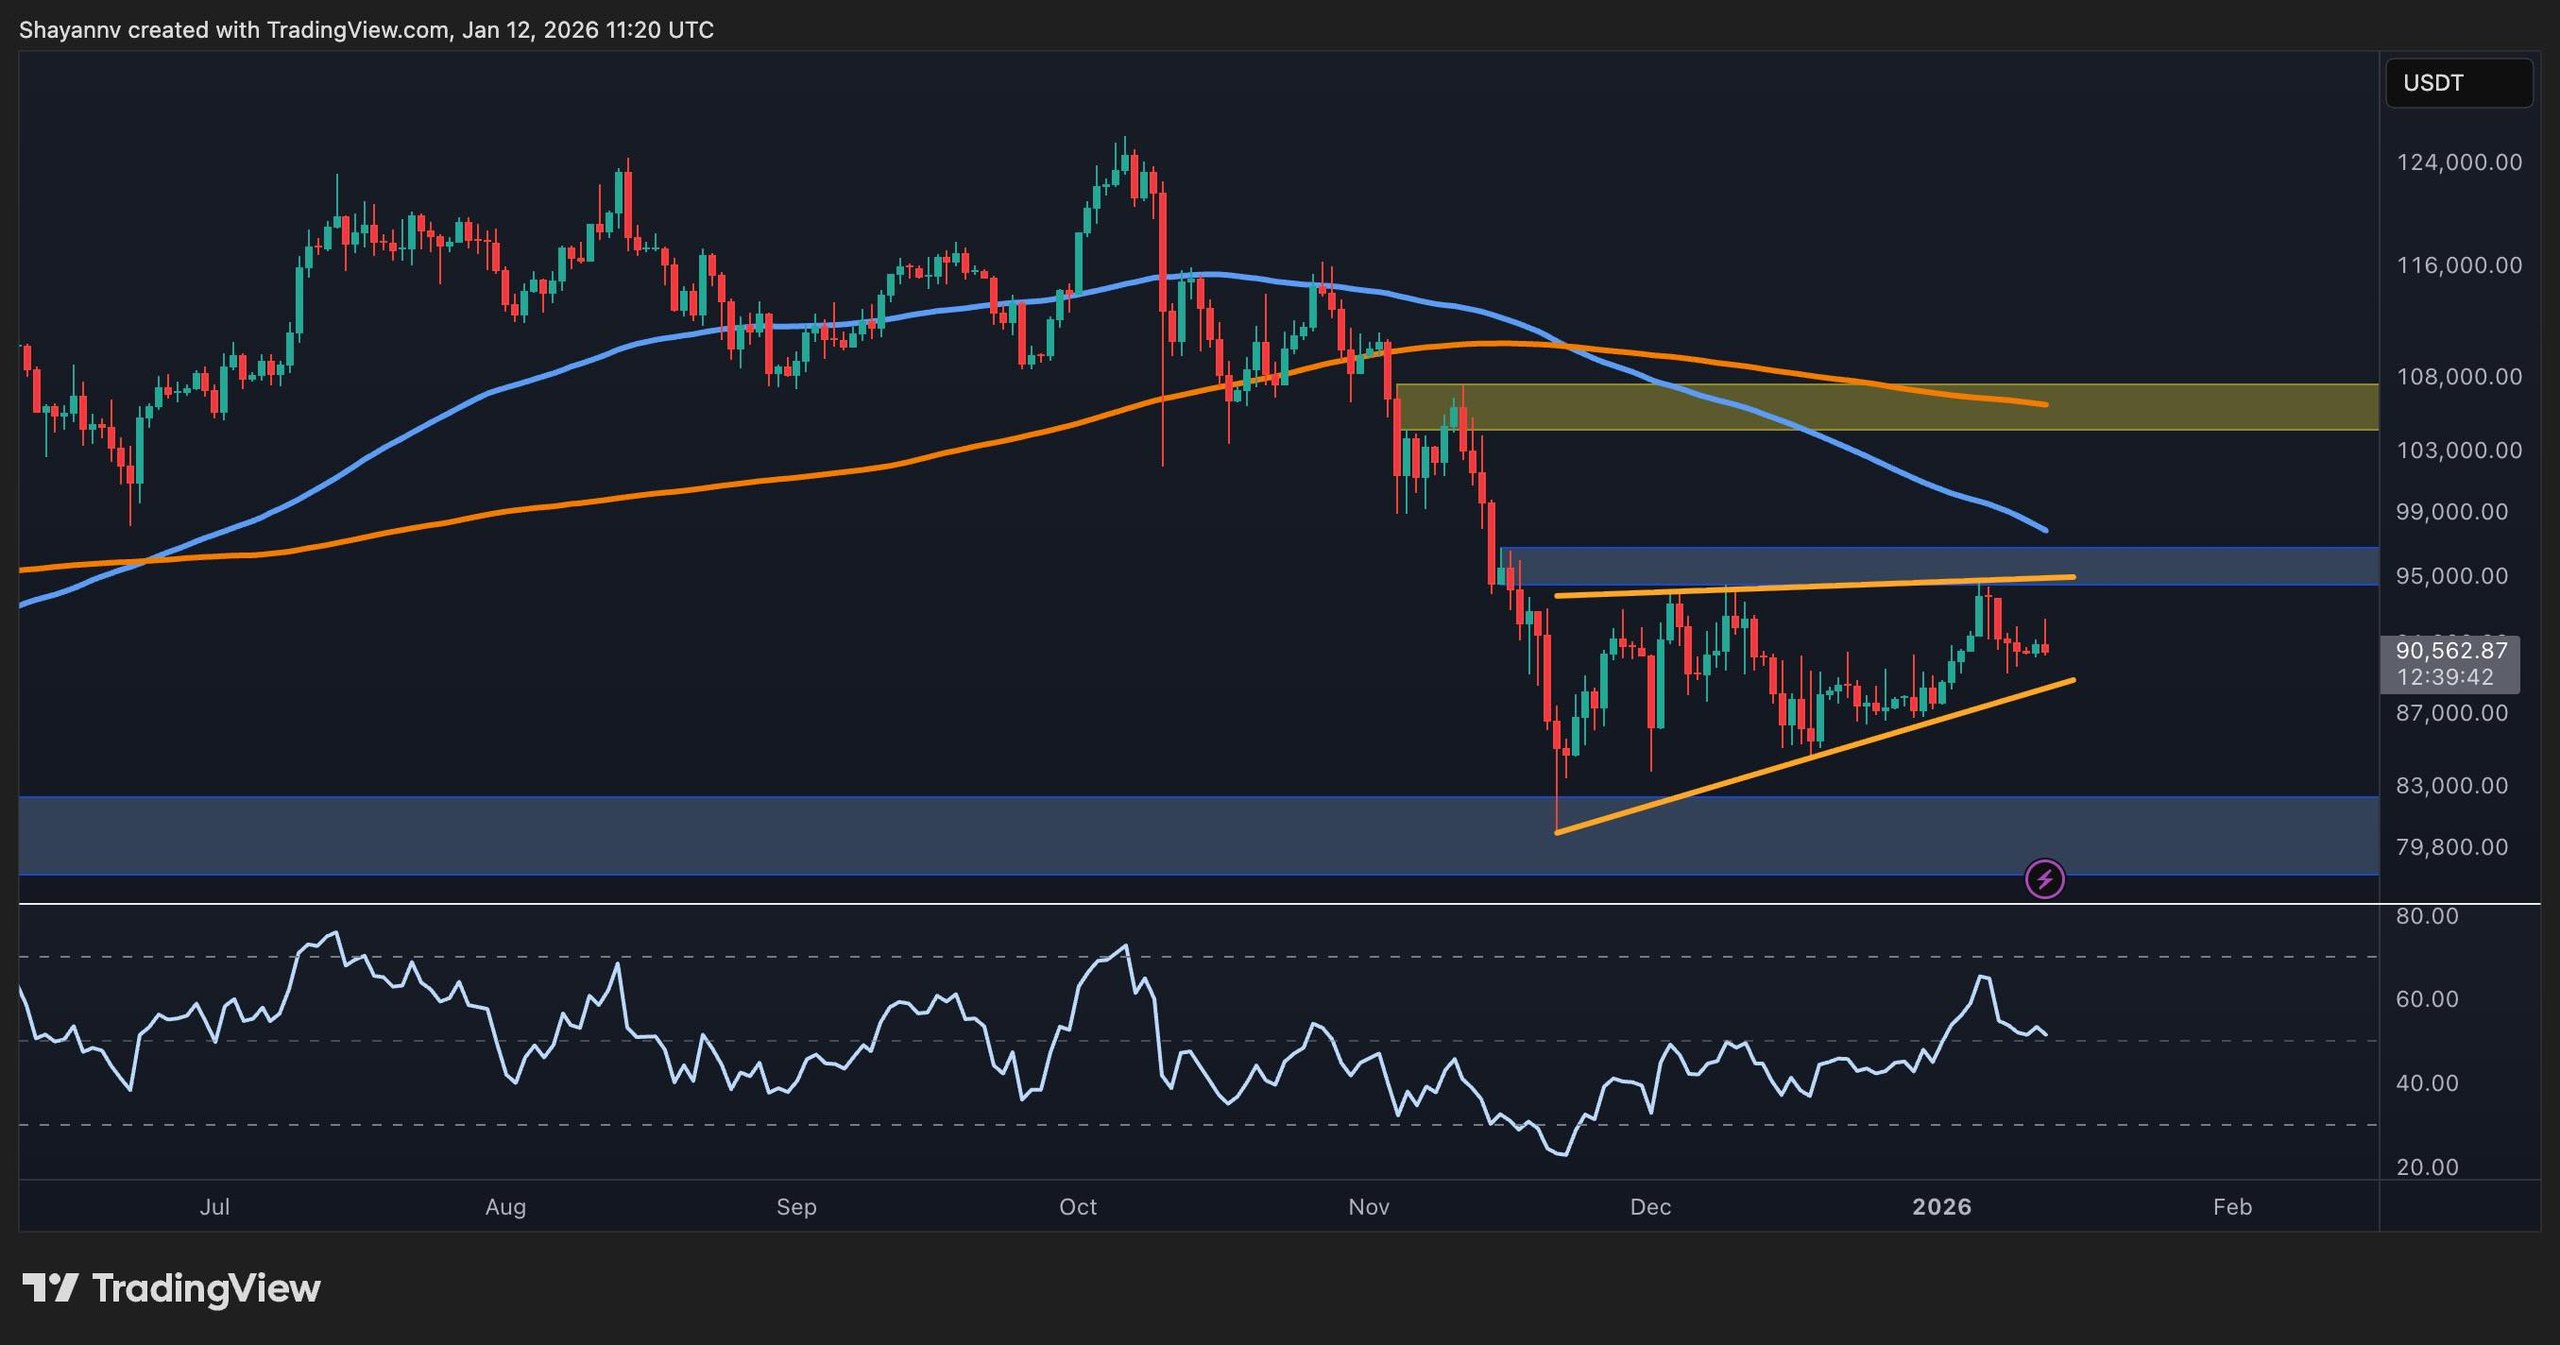
On the daily timeframe, BTC is forming a distinct rising wedge pattern after its recent upturn halted just below the $95K resistance zone. The configuration is tightening, with both the upper and lower limits tested multiple times, suggesting that a breakout may be imminent. The dynamic resistance levels set by the 100-day and 200-day moving averages loom above the current price, presenting obstacles around $98K and $105K accordingly.
Bitcoin was recently rejected from the $95K supply zone, which aligns with the wedge pattern’s upper boundary. The RSI has diminished from overbought levels and is now around the 50 mark, signifying a lack of bullish momentum while still allowing for a potential upward movement if buyers return.
In the event of a downward breakout from the wedge, the next crucial support lies near the $80K region. Conversely, a bullish breakout would require the price to claw back above $95K and navigate beyond the stated moving averages to be deemed a genuine signal of a new rally.
Daily Bitcoin Chart
BTC/USDT 4-Hour Chart Analysis
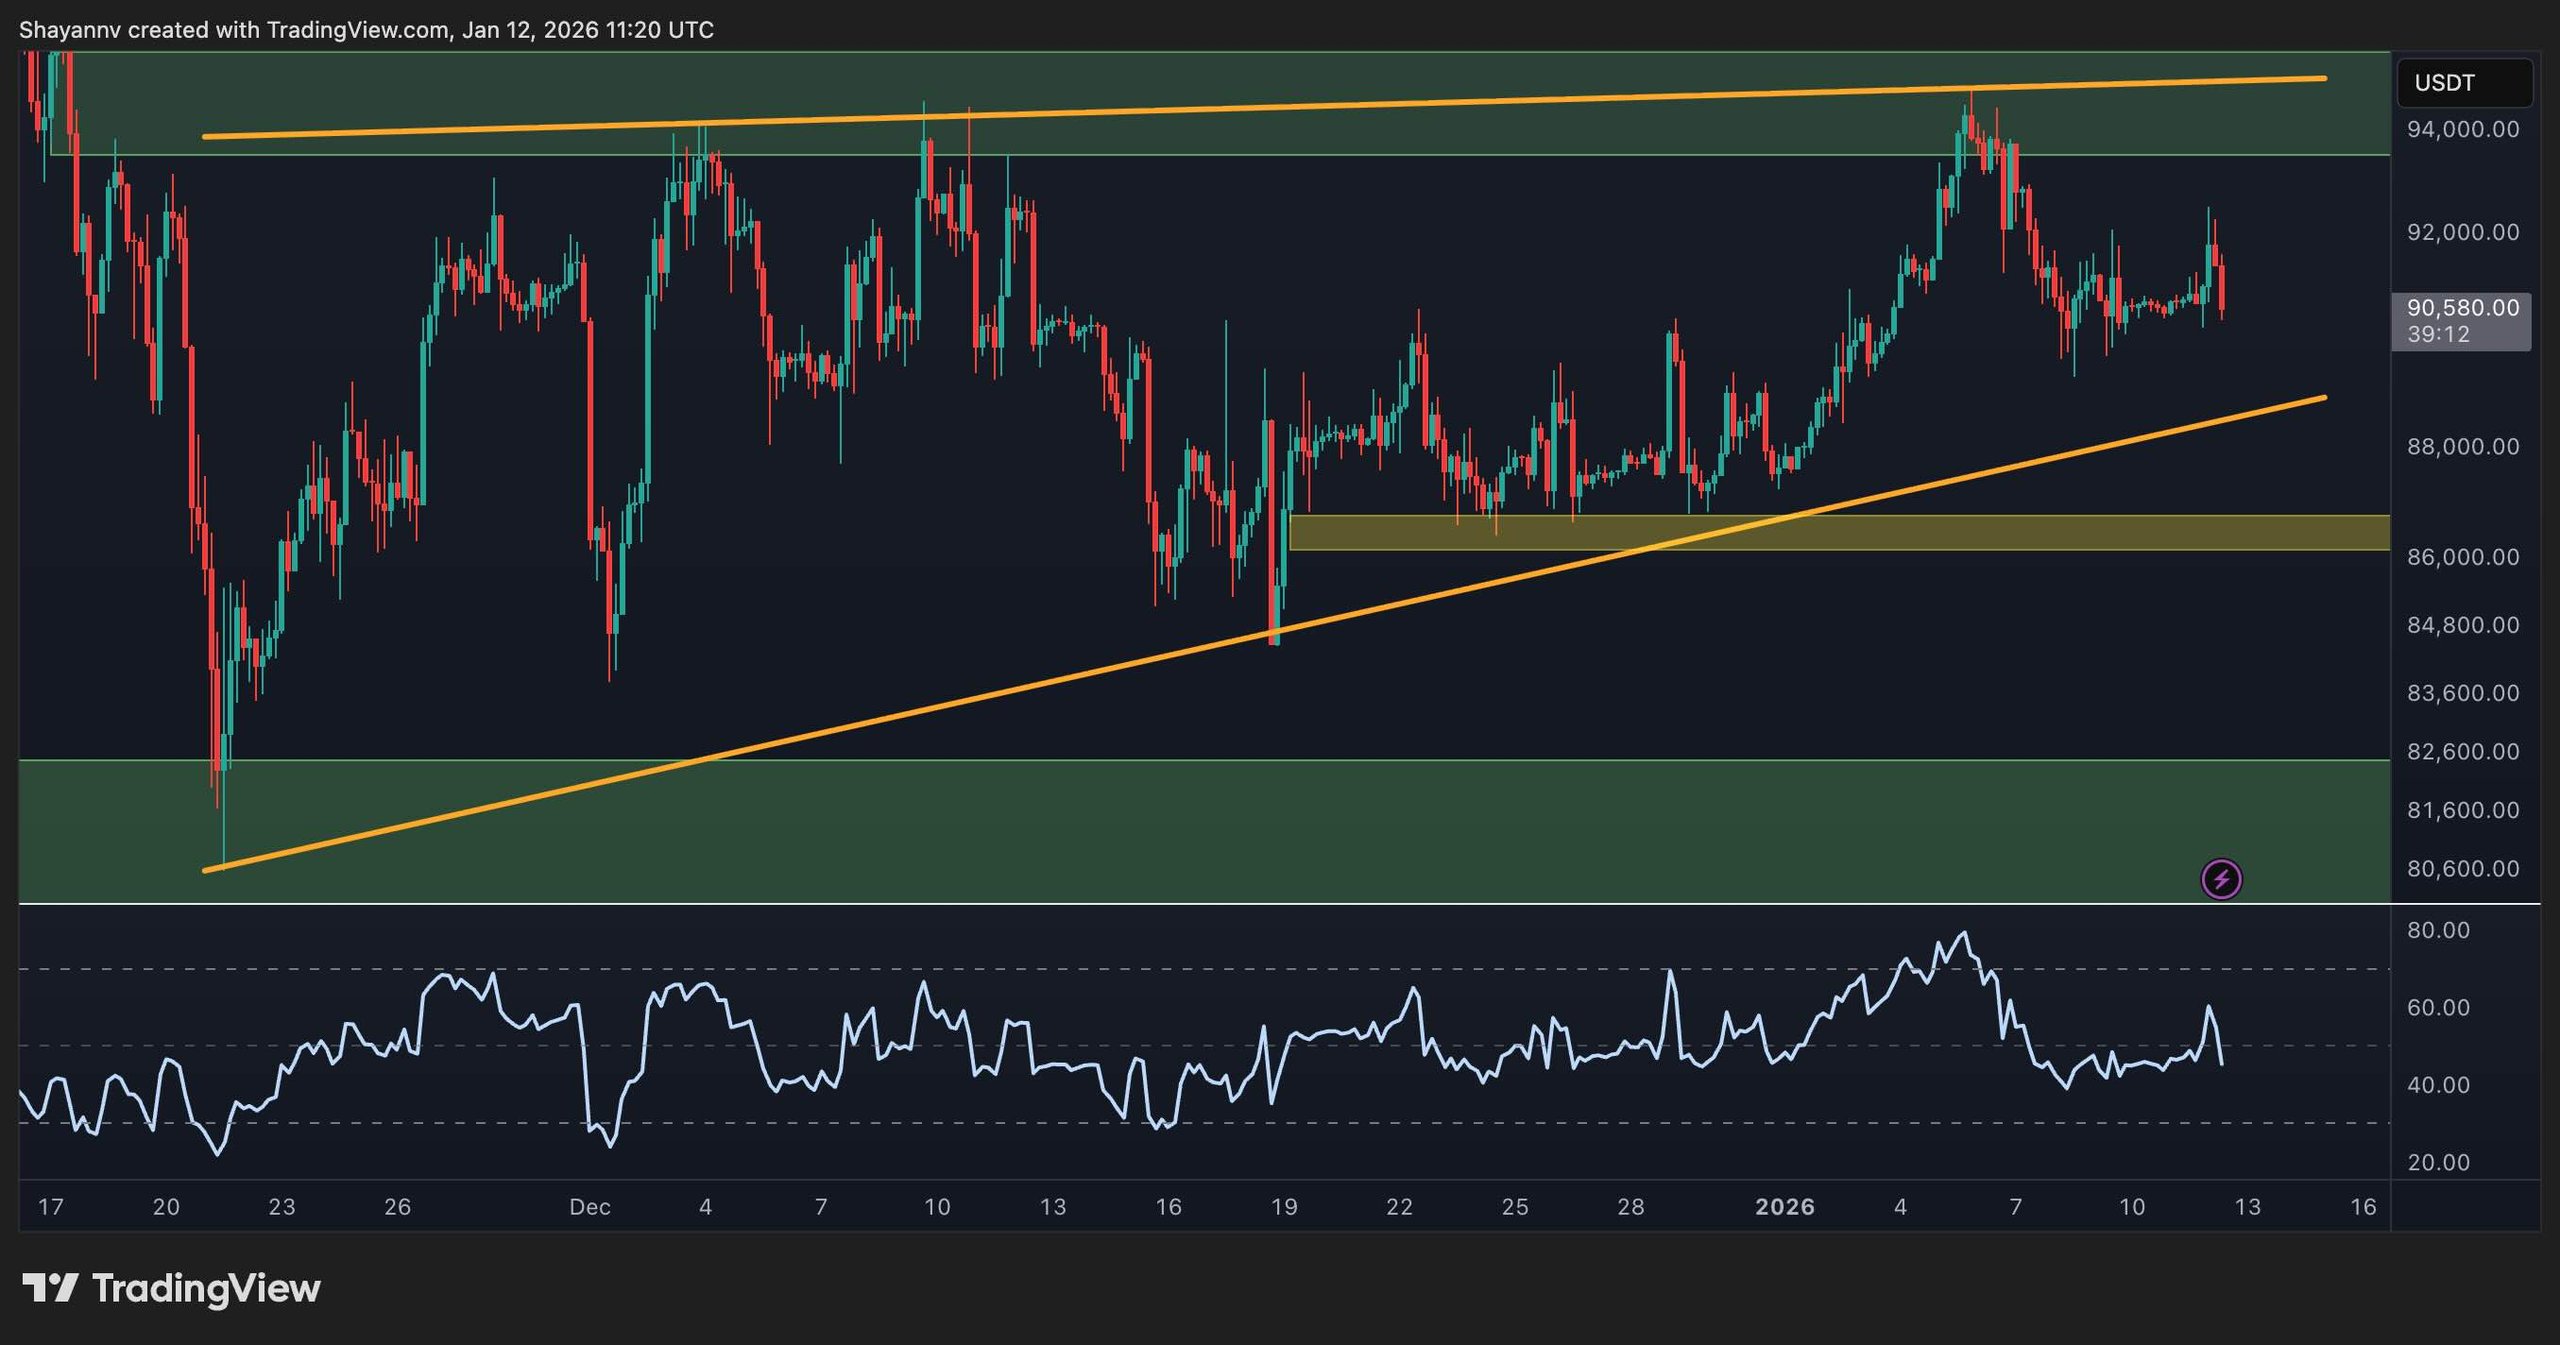
Focusing on the 4-hour chart reveals the same rising wedge structure. Price continues to adhere to the rising trendline from November’s lows, yet numerous attempts to surpass $95K have proven ineffective. Momentum on lesser timeframes appears volatile, showing unclear follow-through from either buyers or sellers.
A drop below the lower boundary around $88K could trigger a retest near the high-volume node at approximately $86K, possibly nudging BTC toward the significant demand zone around $80K. On the flip side, should buyers reclaim the $92K high and break through the critical $95K resistance zone, a robust movement towards the pivotal $100K level could be anticipated.
 4-Hour BTC Chart
Sentiment Overview
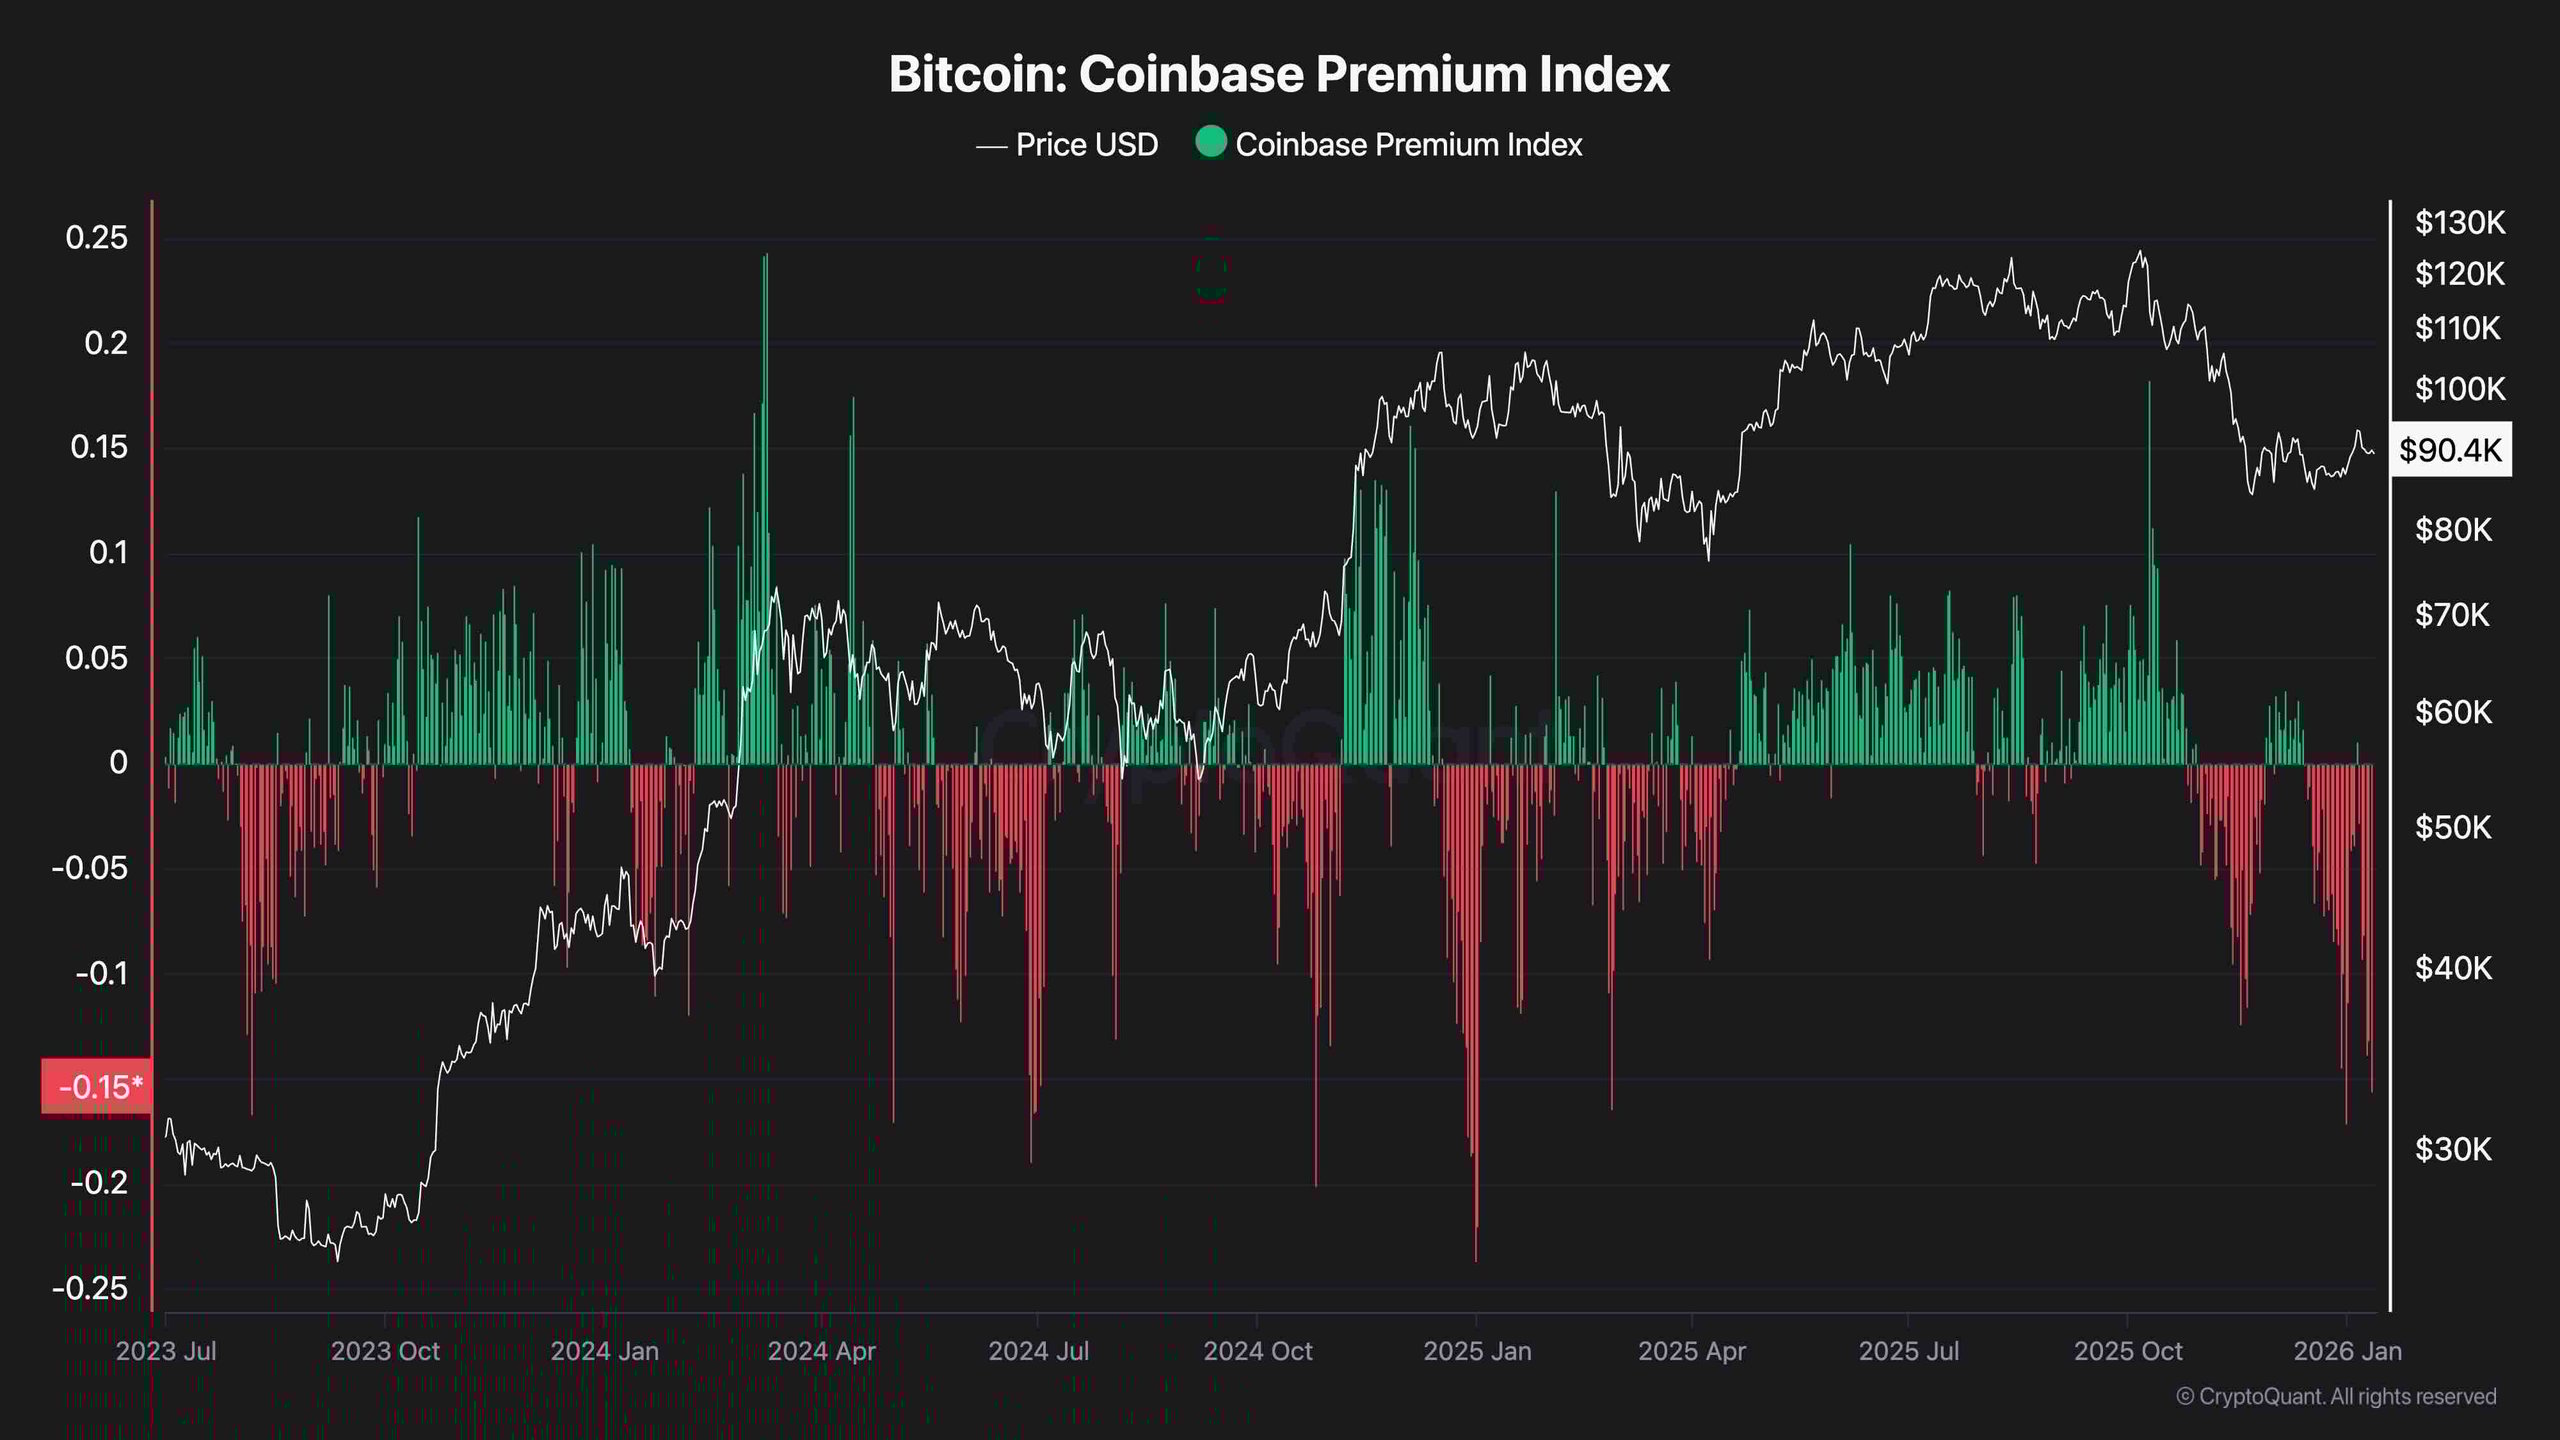
The Coinbase Premium Index, which measures the price variance between Coinbase and global exchanges, is currently displaying significant negative values and remains in the red zone. Historically, strong positive premiums have coincided with major bullish trends, especially when led by U.S.-based spot buyers.
The ongoing negative premium indicates a decreased demand from both U.S. institutional and retail investors, serving as a potential warning that the recent uptick may not be sustainable. This metric has often preceded substantial pullbacks during correction phases. Until the premium reverts to positive territory, any bullish movement should be approached with caution.
 Coinbase Premium Index
SPECIAL OFFER (Exclusive)\ SECRET PARTNERSHIP BONUS for CryptoPotato readers: Use this link to register and unlock $1,500 in exclusive BingX Exchange rewards (limited time offer).
Information found on CryptoPotato reflects the views of various authors. It does not represent the opinions of CryptoPotato regarding investment strategies. Always conduct your research before making investment decisions. Utilize provided information at your own risk. See full disclaimer.
