Analyzing Ethereum's Price Trajectory: What Lies Ahead as Momentum Slows?
Ethereum remains in a corrective phase with unclear price direction, but the recent behavior suggests less bearish activity.


Ethereum is currently caught in a wider corrective phase, although its structure is showing reduced bearish signals. The asset is effectively holding above critical demand levels, with volatility decreasing. Typically, at this point, the market often determines whether it will continue to decline or begin a more significant upward movement. Although momentum indicators are mixed and ETH is underperforming compared to BTC, signs suggest that the downward momentum has weakened.
Ethereum Price Analysis: The Daily Chart
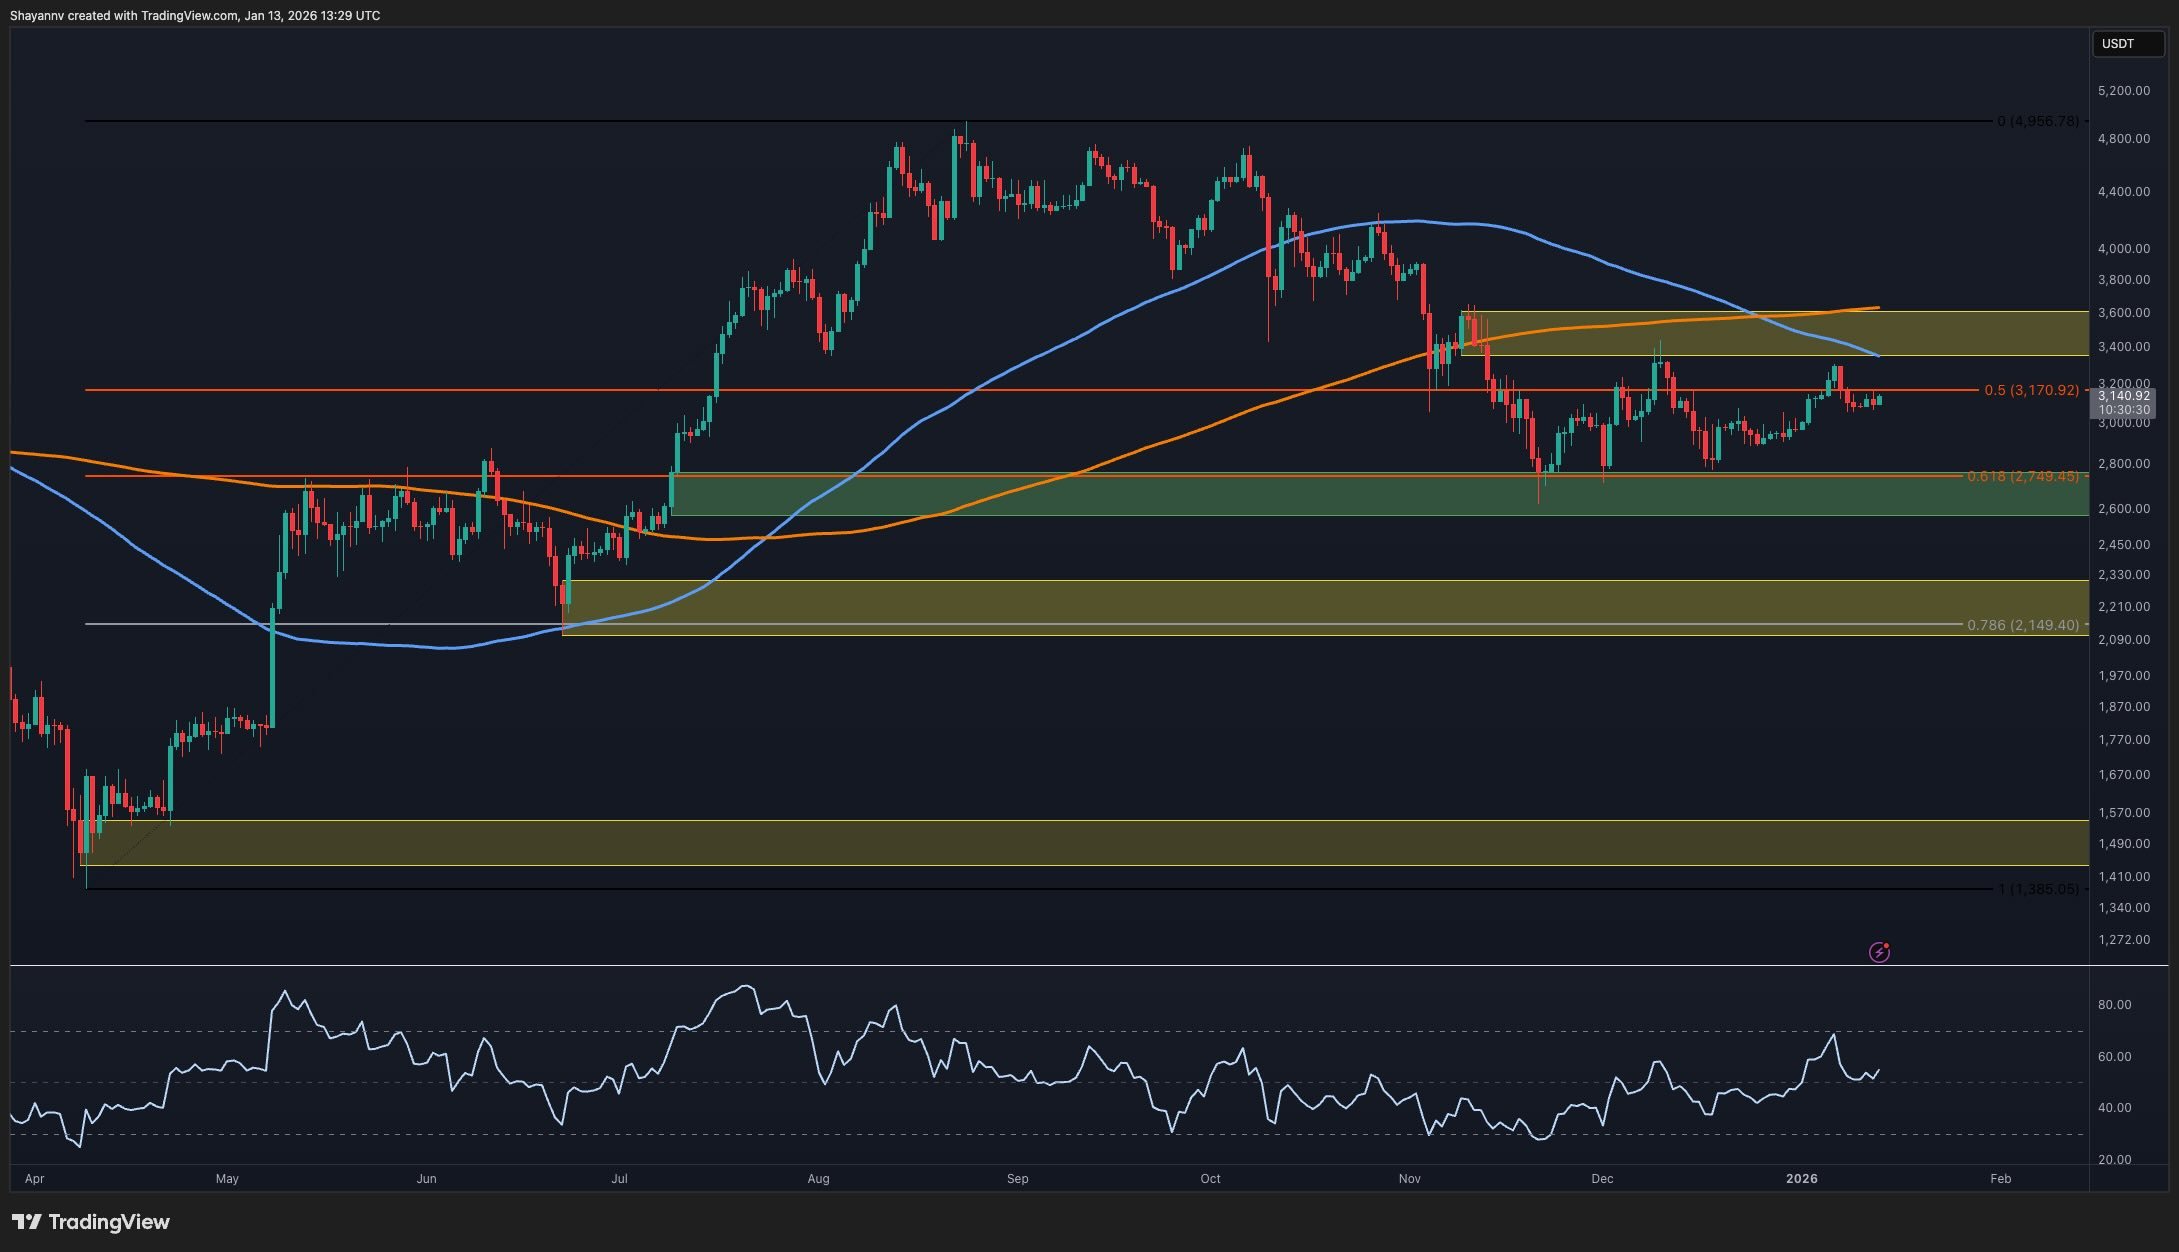
On the daily chart, ETH is positioned below key 100-day and 200-day moving averages, constrained by a substantial supply zone near $3.5k. This zone has consistently rejected price growth, aligning with previous distribution patterns. Nonetheless, the sell-off that occurred near the $2.6k–$2.7k area was strongly supported, with price respecting that demand zone and transitioning into a range-bound structure within the Fibonacci golden zone. However, as long as the key moving averages act as dynamic resistance, the daily outlook remains neutral to slightly bearish until they are reclaimed.
As long as ETH remains above the $2.6k-$2.7k demand threshold, the current price behavior appears more like consolidation post-distribution rather than panic-driven selling. A daily close above the $3.5k zone and the 200-day MA would signify a notable indication of recovery.
 ETH Daily Chart
ETH/USDT 4-Hour Chart
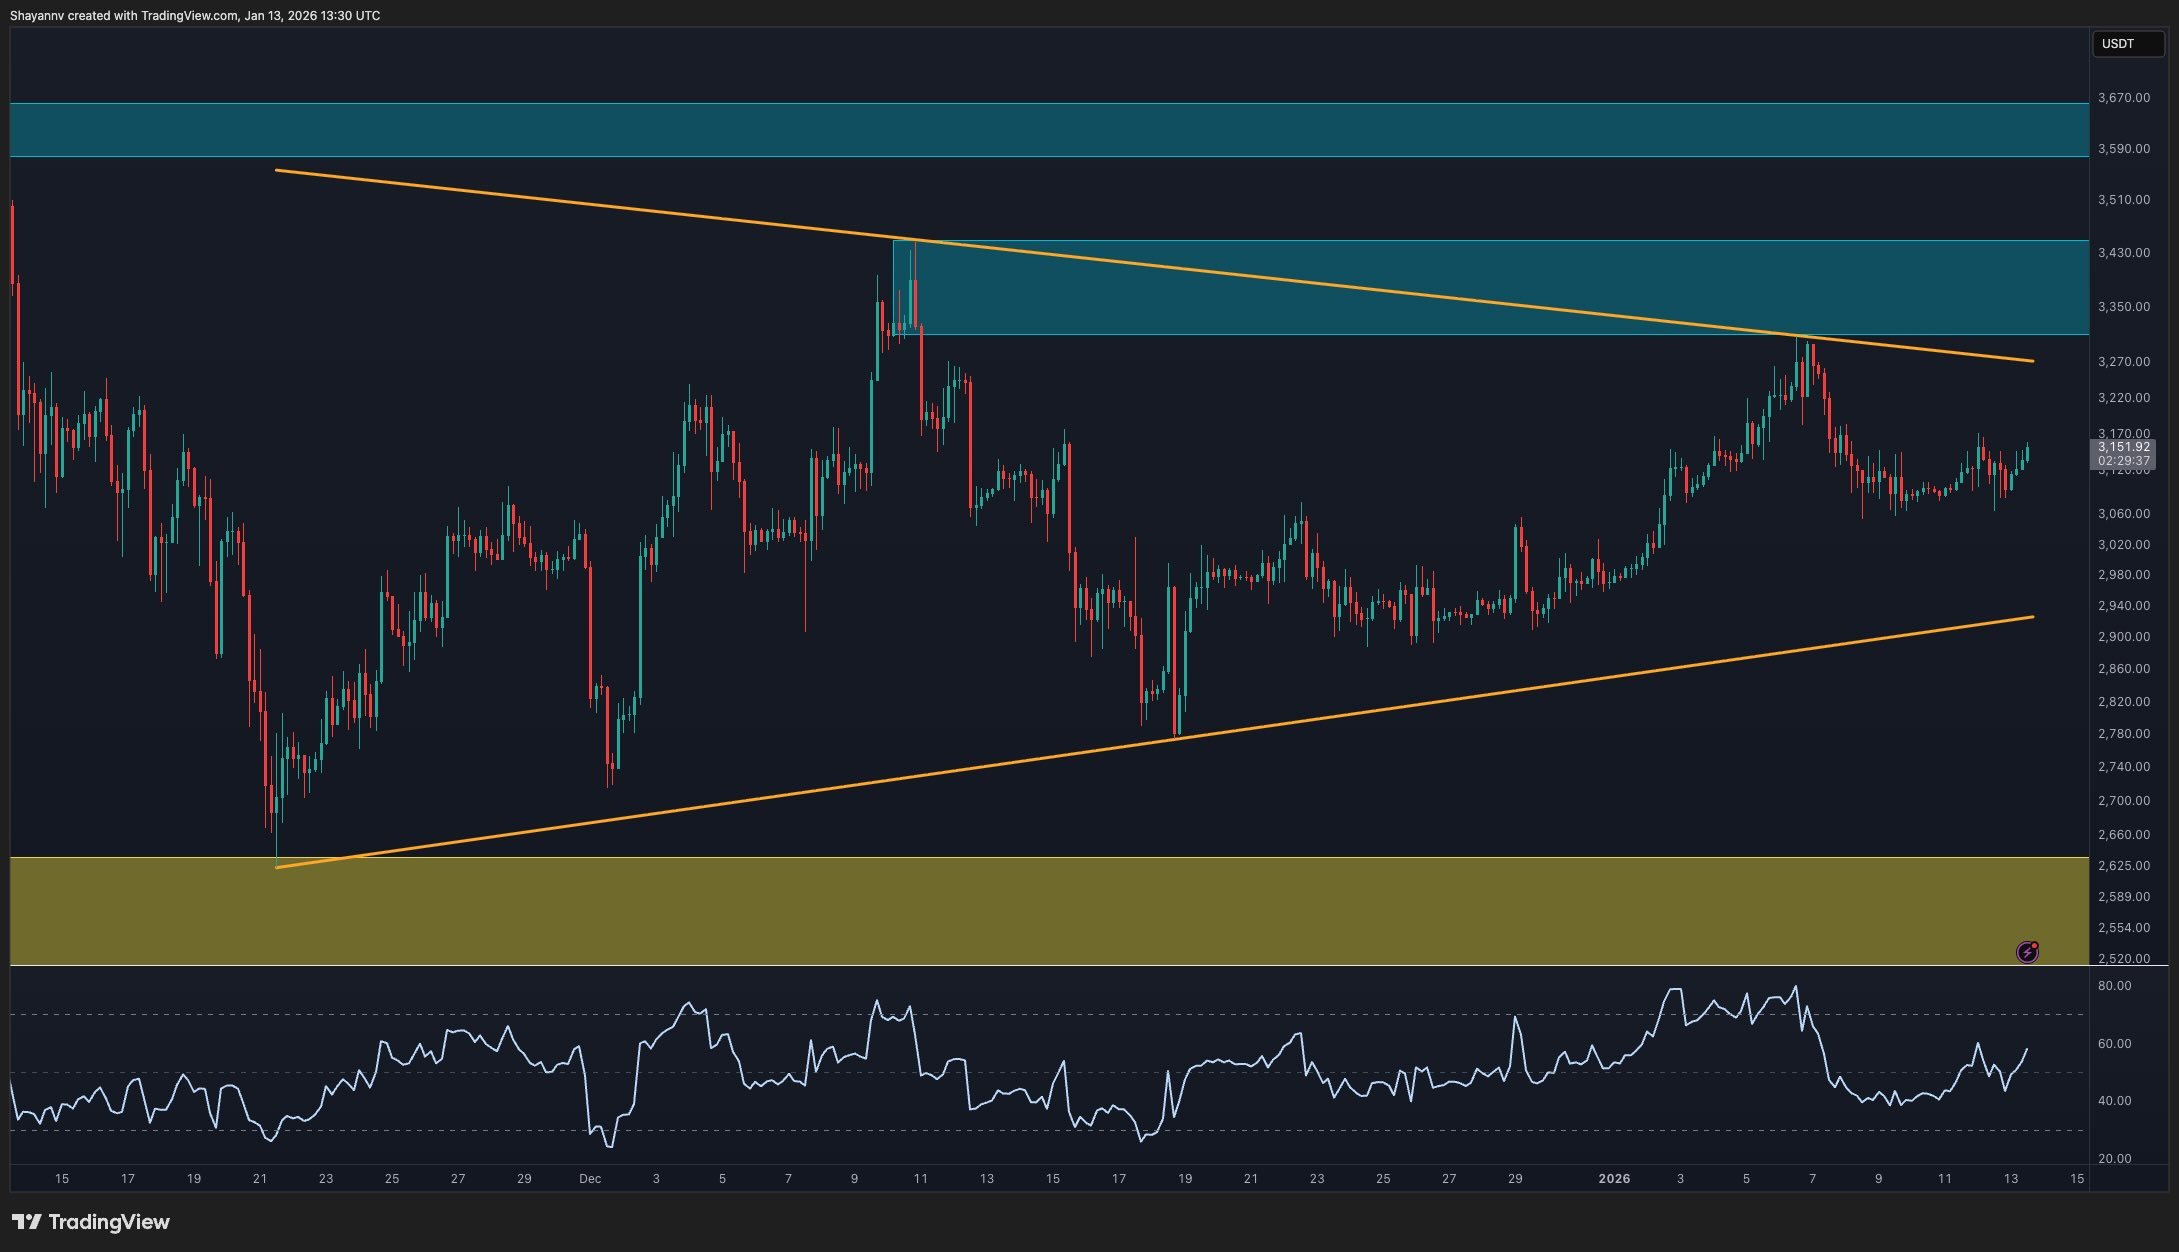
The 4H chart presents a clearer position. Currently, ETH trades within a symmetrical triangle pattern, characterized by higher lows and lower highs formed since late November. The price recently contacted the triangle’s upper trendline and underwent a slight pullback, which is a healthy sign rather than a concern.
Short-term resistance is identified at the previous peaks around $3.3k, corresponding with the upper boundary of the channel. Well-defined support exists at the triangle’s lower edge and within the more extensive demand area near $2.6k.
At this stage, the RSI is rising again on the 4-hour timeframe, indicating that bullish momentum is dominant in the short term. If ETH maintains this structure, it should target the upper boundary of the triangle once more. Conversely, a drop below the triangle support would negate the short-term bullish outlook, redirecting focus to the $2.6k demand area.
 ETH 4H Chart
On-chain Analysis
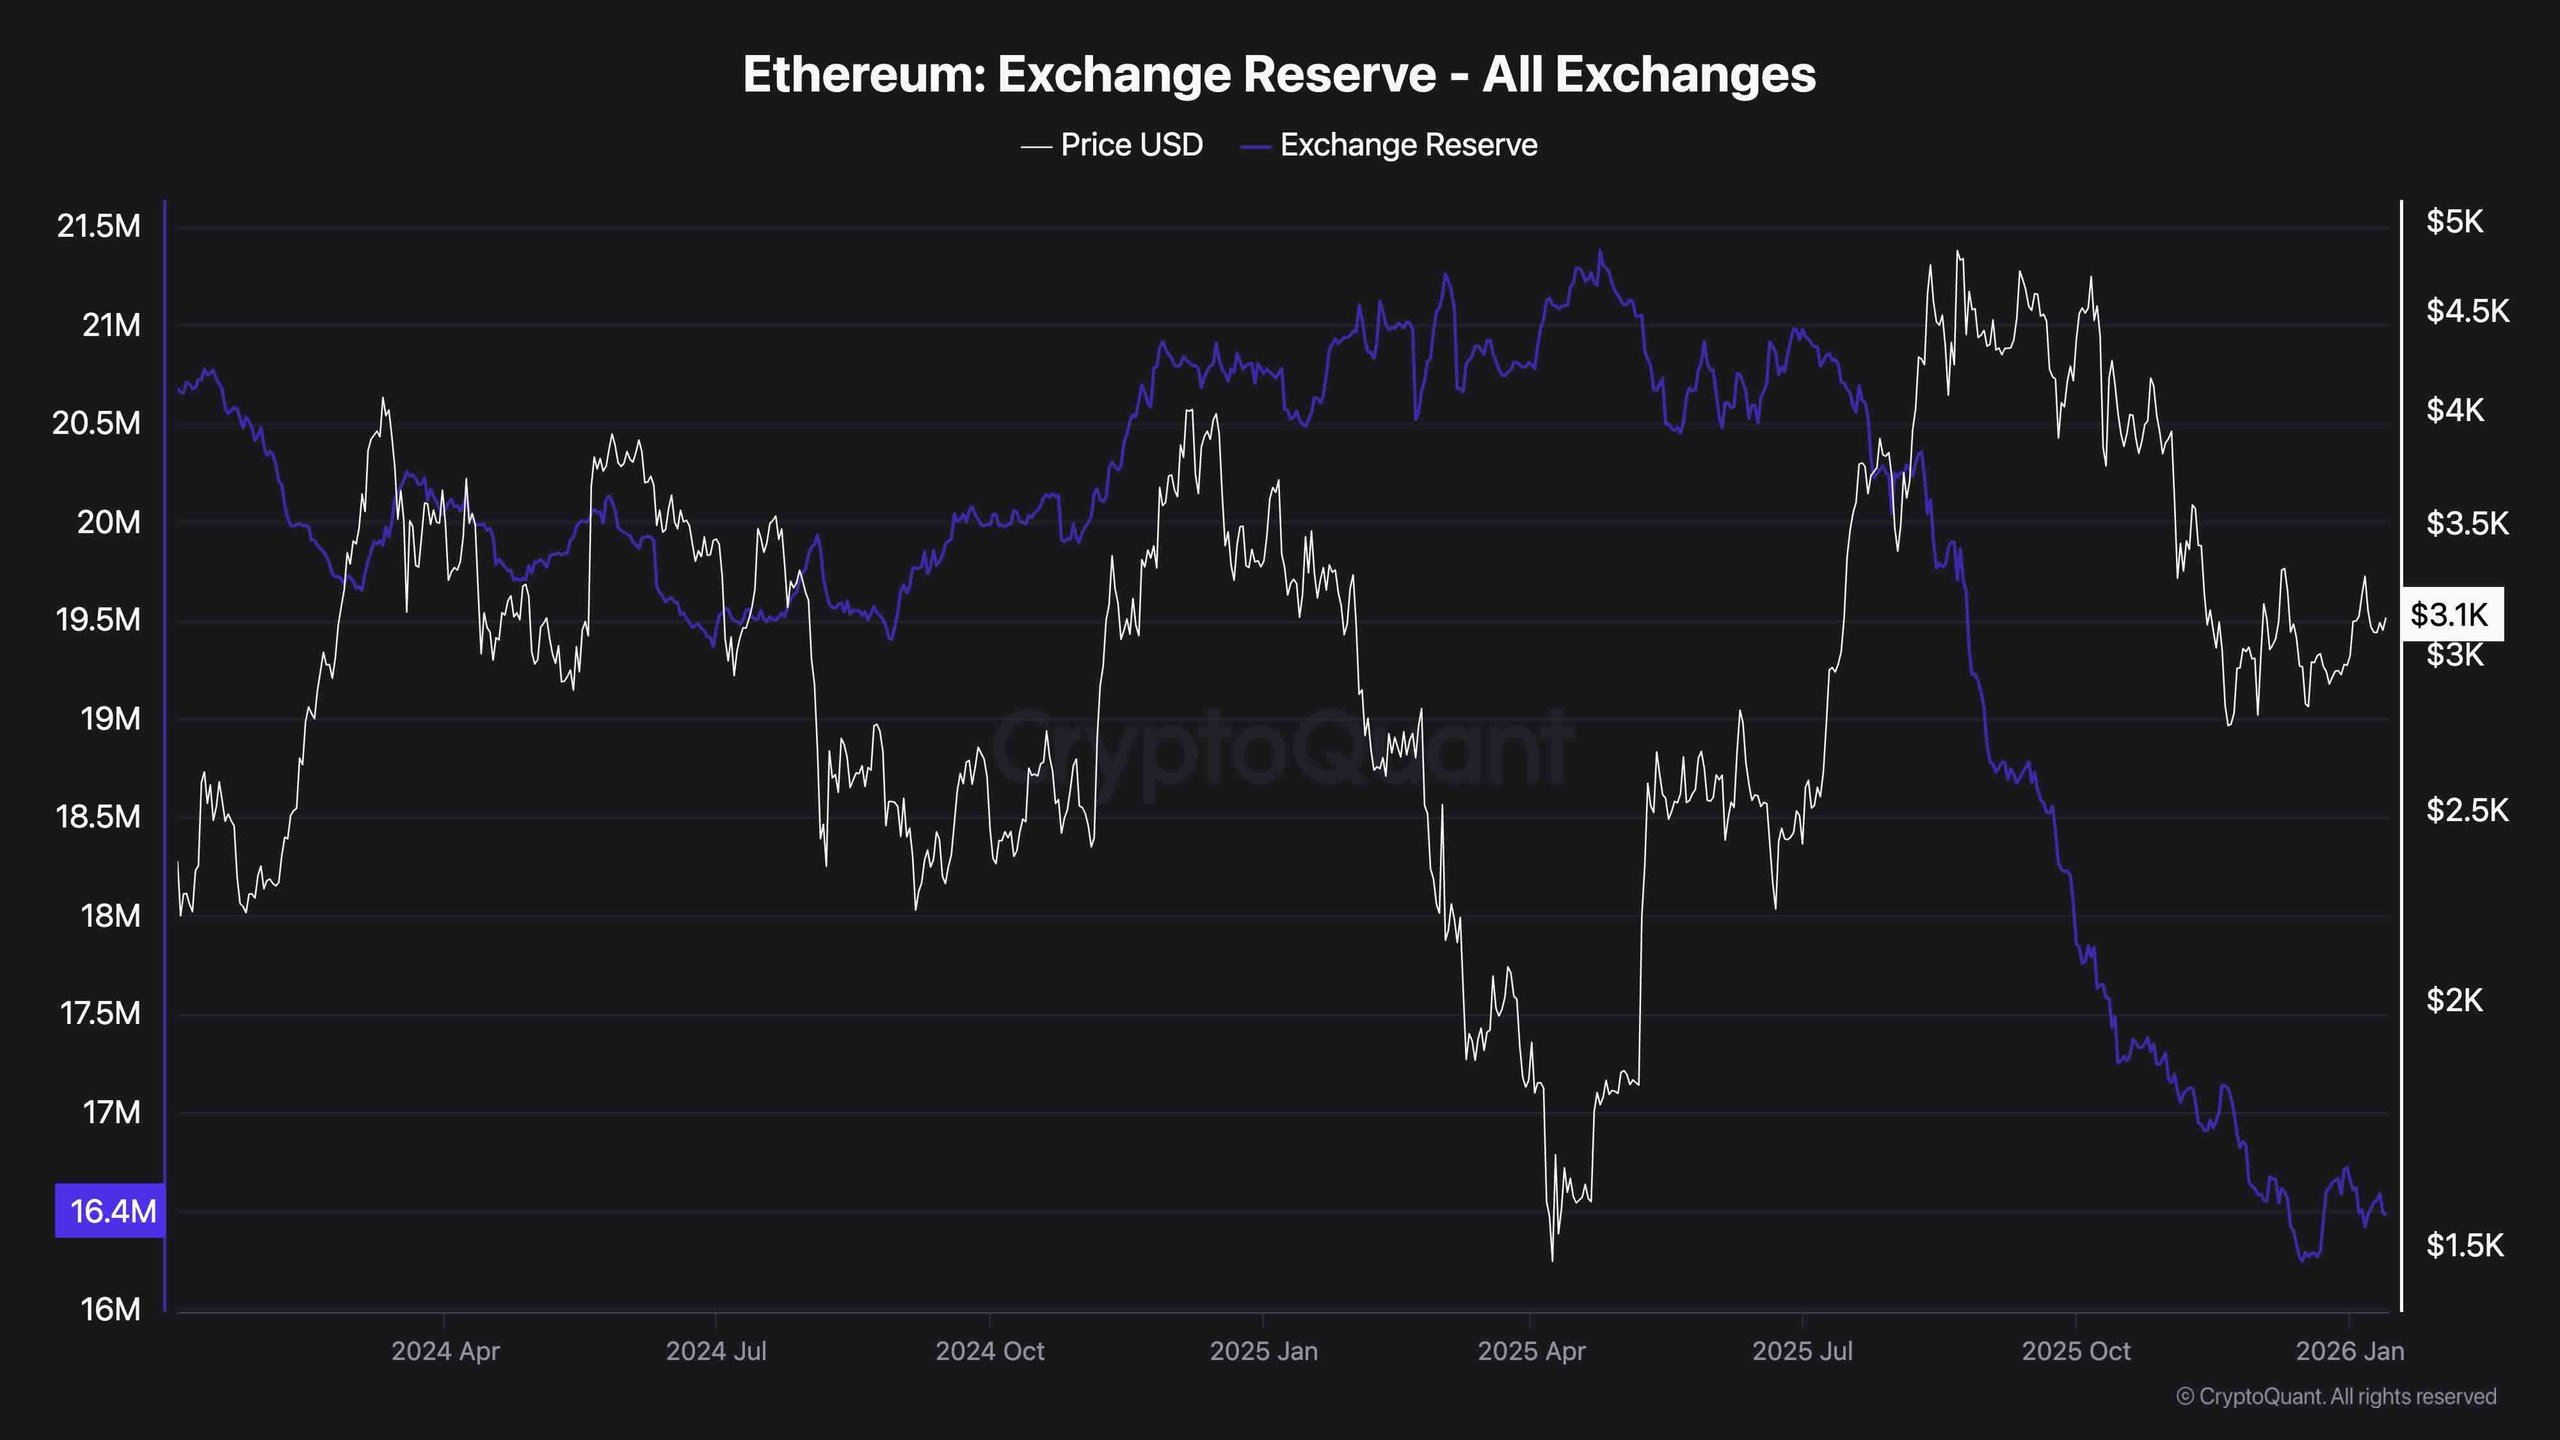
Ethereum’s exchange reserves are continuously decreasing, which is a positive long-term signal. Despite recent price weaknesses, coins are still leaving exchanges, suggesting a lower sell pressure and ongoing accumulation rather than distribution.
Historically, consistent declines in exchange reserves during consolidation phases often precede stronger directional moves once market sentiment aligns. While this does not guarantee immediate upside, it does lessen the likelihood of abrupt capitulation. Therefore, current on-chain data reinforce the notion that ETH is currently being absorbed rather than sold off.
Ethereum Exchange Reserve
Disclaimer: The information provided in this analysis is for informational purposes only and does not constitute financial advice.
