Ethereum's Path After Rejection at $3.4K: Market Insights
An analytical overview of Ethereum's price trajectory following resistance at the $3,400 level.


Ethereum is currently operating in a constructive yet corrective phase. The price remains above significant higher-timeframe demand areas while facing continued resistance beneath the downward trending daily moving averages.
The overall market structure indicates that the sharp sell-off from the peaks seems to have shifted into a stabilizing and mean-reversion phase instead of marking a complete bullish turnaround. On-chain metrics, however, highlight a slight uptick in market participation without signs of excessive risk-taking.
Ethereum Price Overview: Daily Analysis
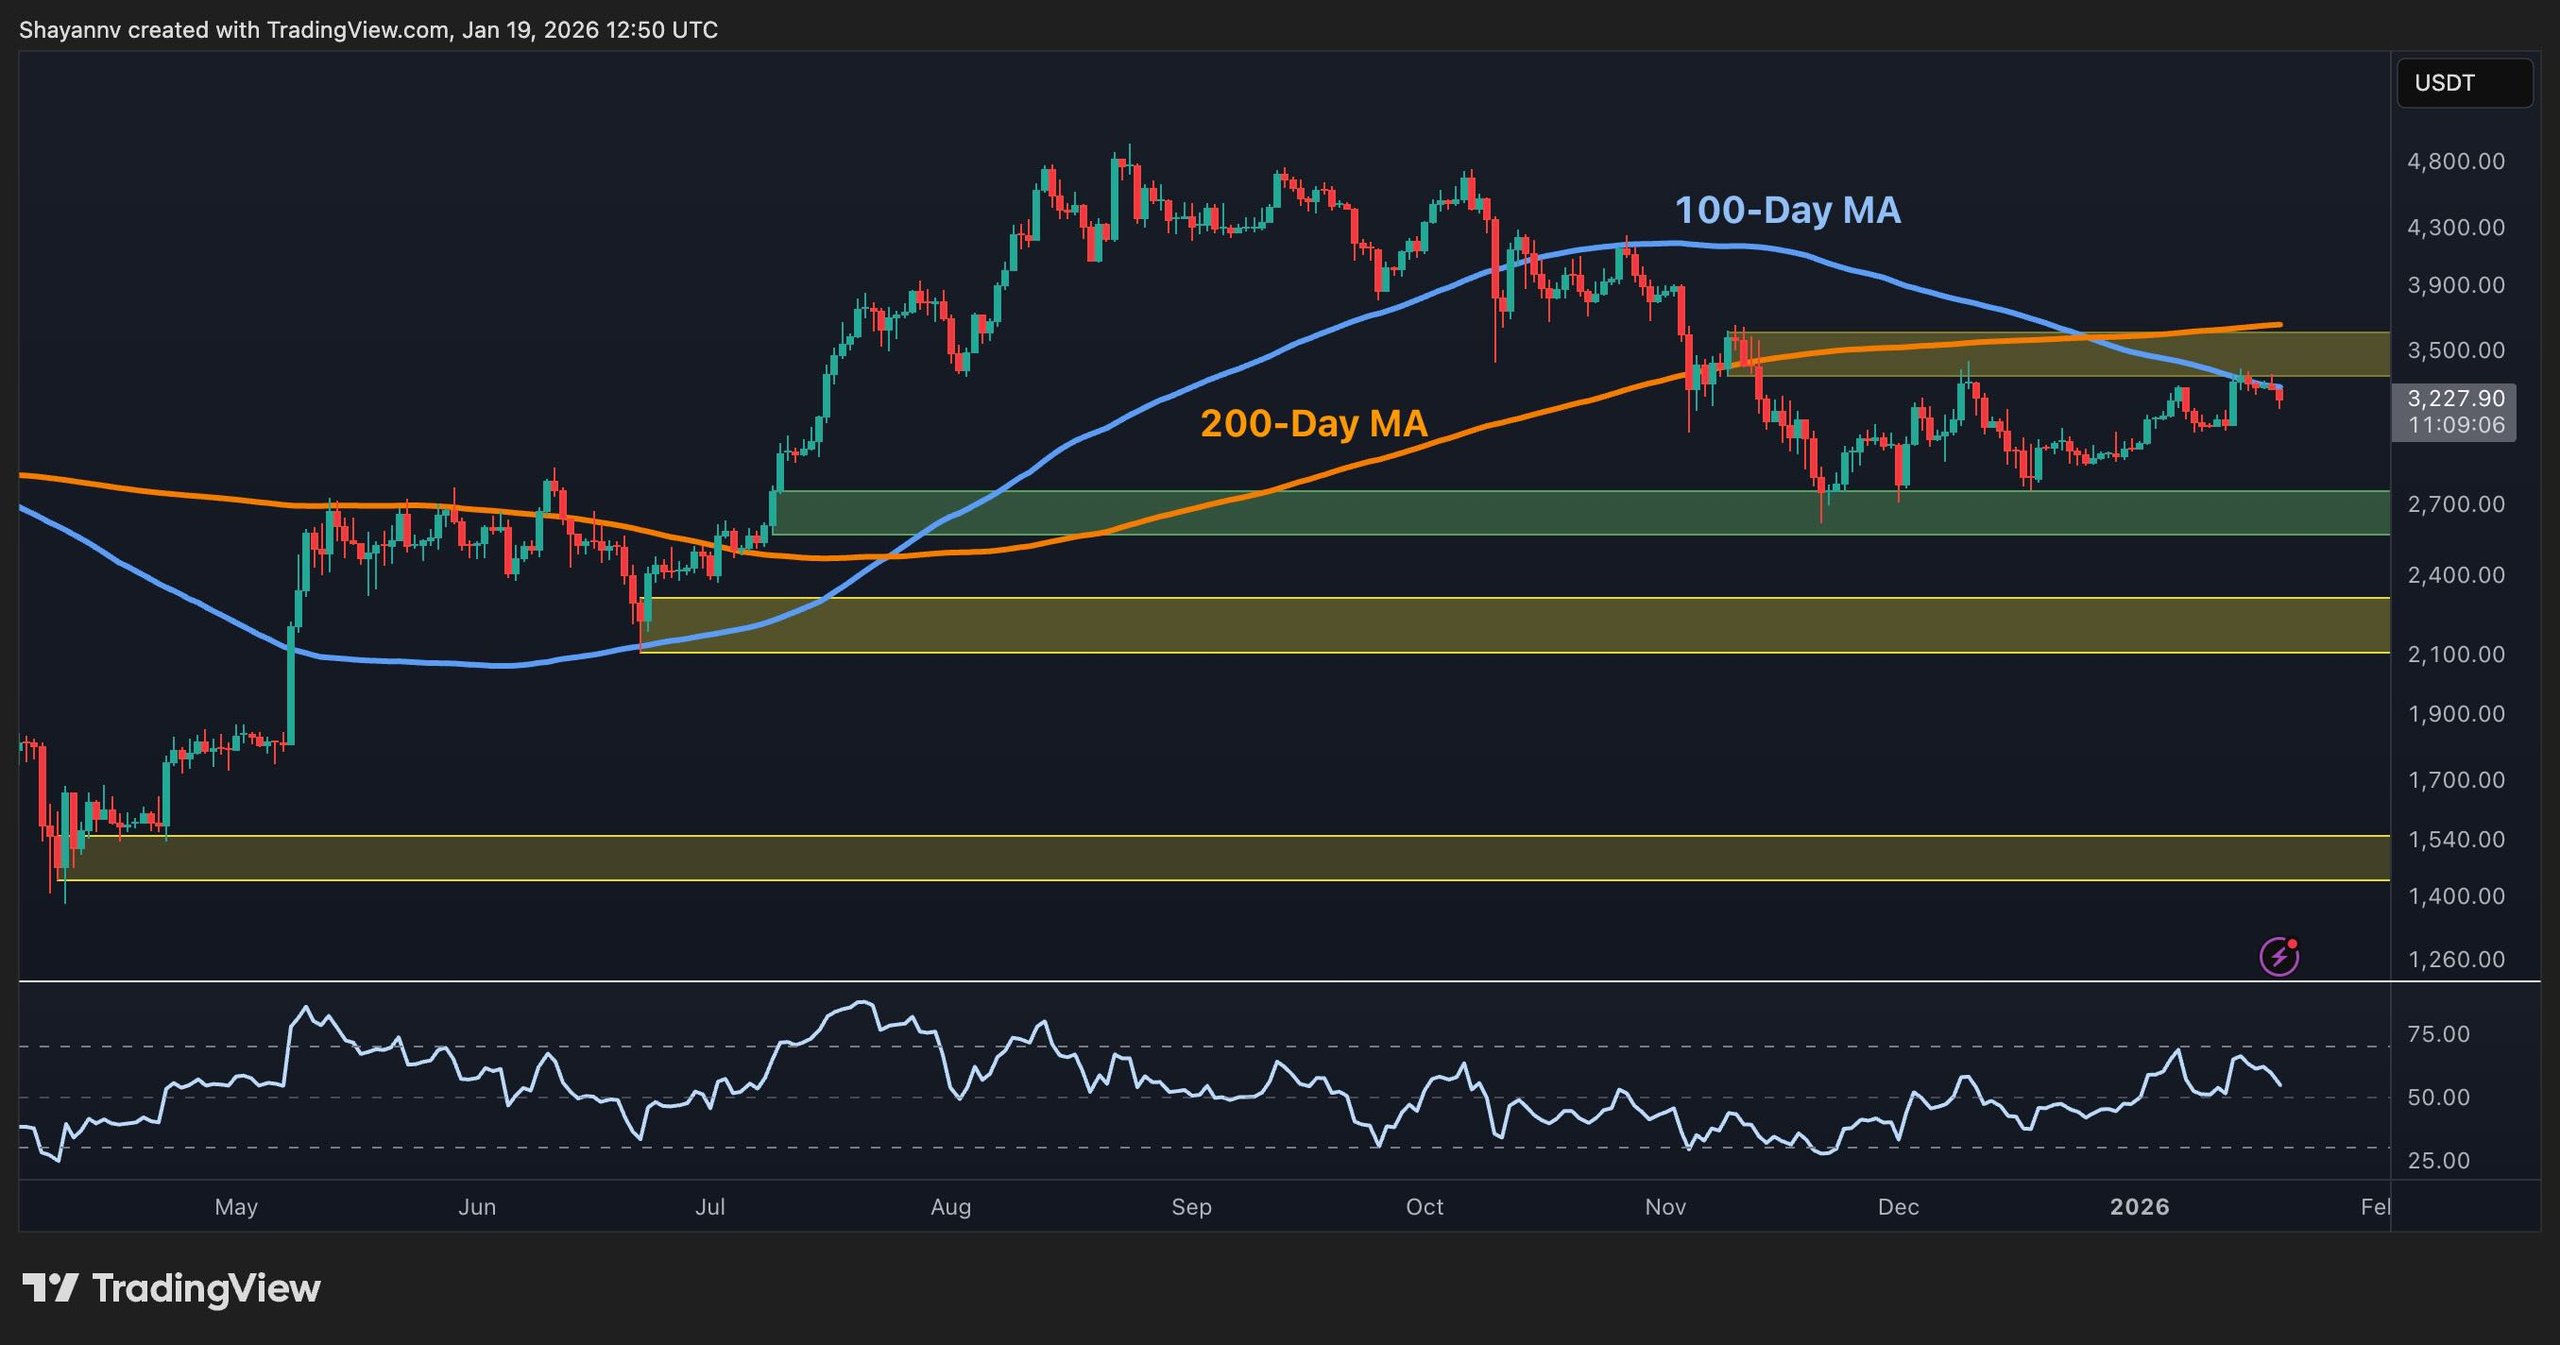
On the daily chart, Ethereum (ETH) is hovering around the declining 100-day moving average while staying below the 200-day moving average, indicating a corrective trend. The asset has consistently respected the $2,700 level as a core demand zone, with a more substantial structural floor between $2,100 and $2,300.
The market is testing the resistance band around $3,500, which previously functioned as a distribution point. Provided the $2,700 support holds, the medium-term outlook could portray this as a significant consolidation phase within a broader bullish trend. However, the lack of a definitive reclaim of the daily moving averages and the challenging supply levels suggests the recovery is still ongoing within a broader range rather than marking the beginning of a significant upward trend.
Daily Ethereum Chart
View Daily Chart
ETH/USDT 4-Hour Chart
Analysis of the 4-hour chart reveals a progression of higher lows since the downturn in December, suggesting an accumulation pattern with the latest swing low established around the $3,000 mark. The price has been fluctuating within this support range and the resistance zone located between $3,300 and $3,400.
Assuming the market respects this upward trend, another attempt towards the supply cluster of $3,300–$3,400 could be in play. Conversely, a sustained breach below $3,000 could indicate further corrective movement, necessitating a revisit to the crucial $2,800 support zone.
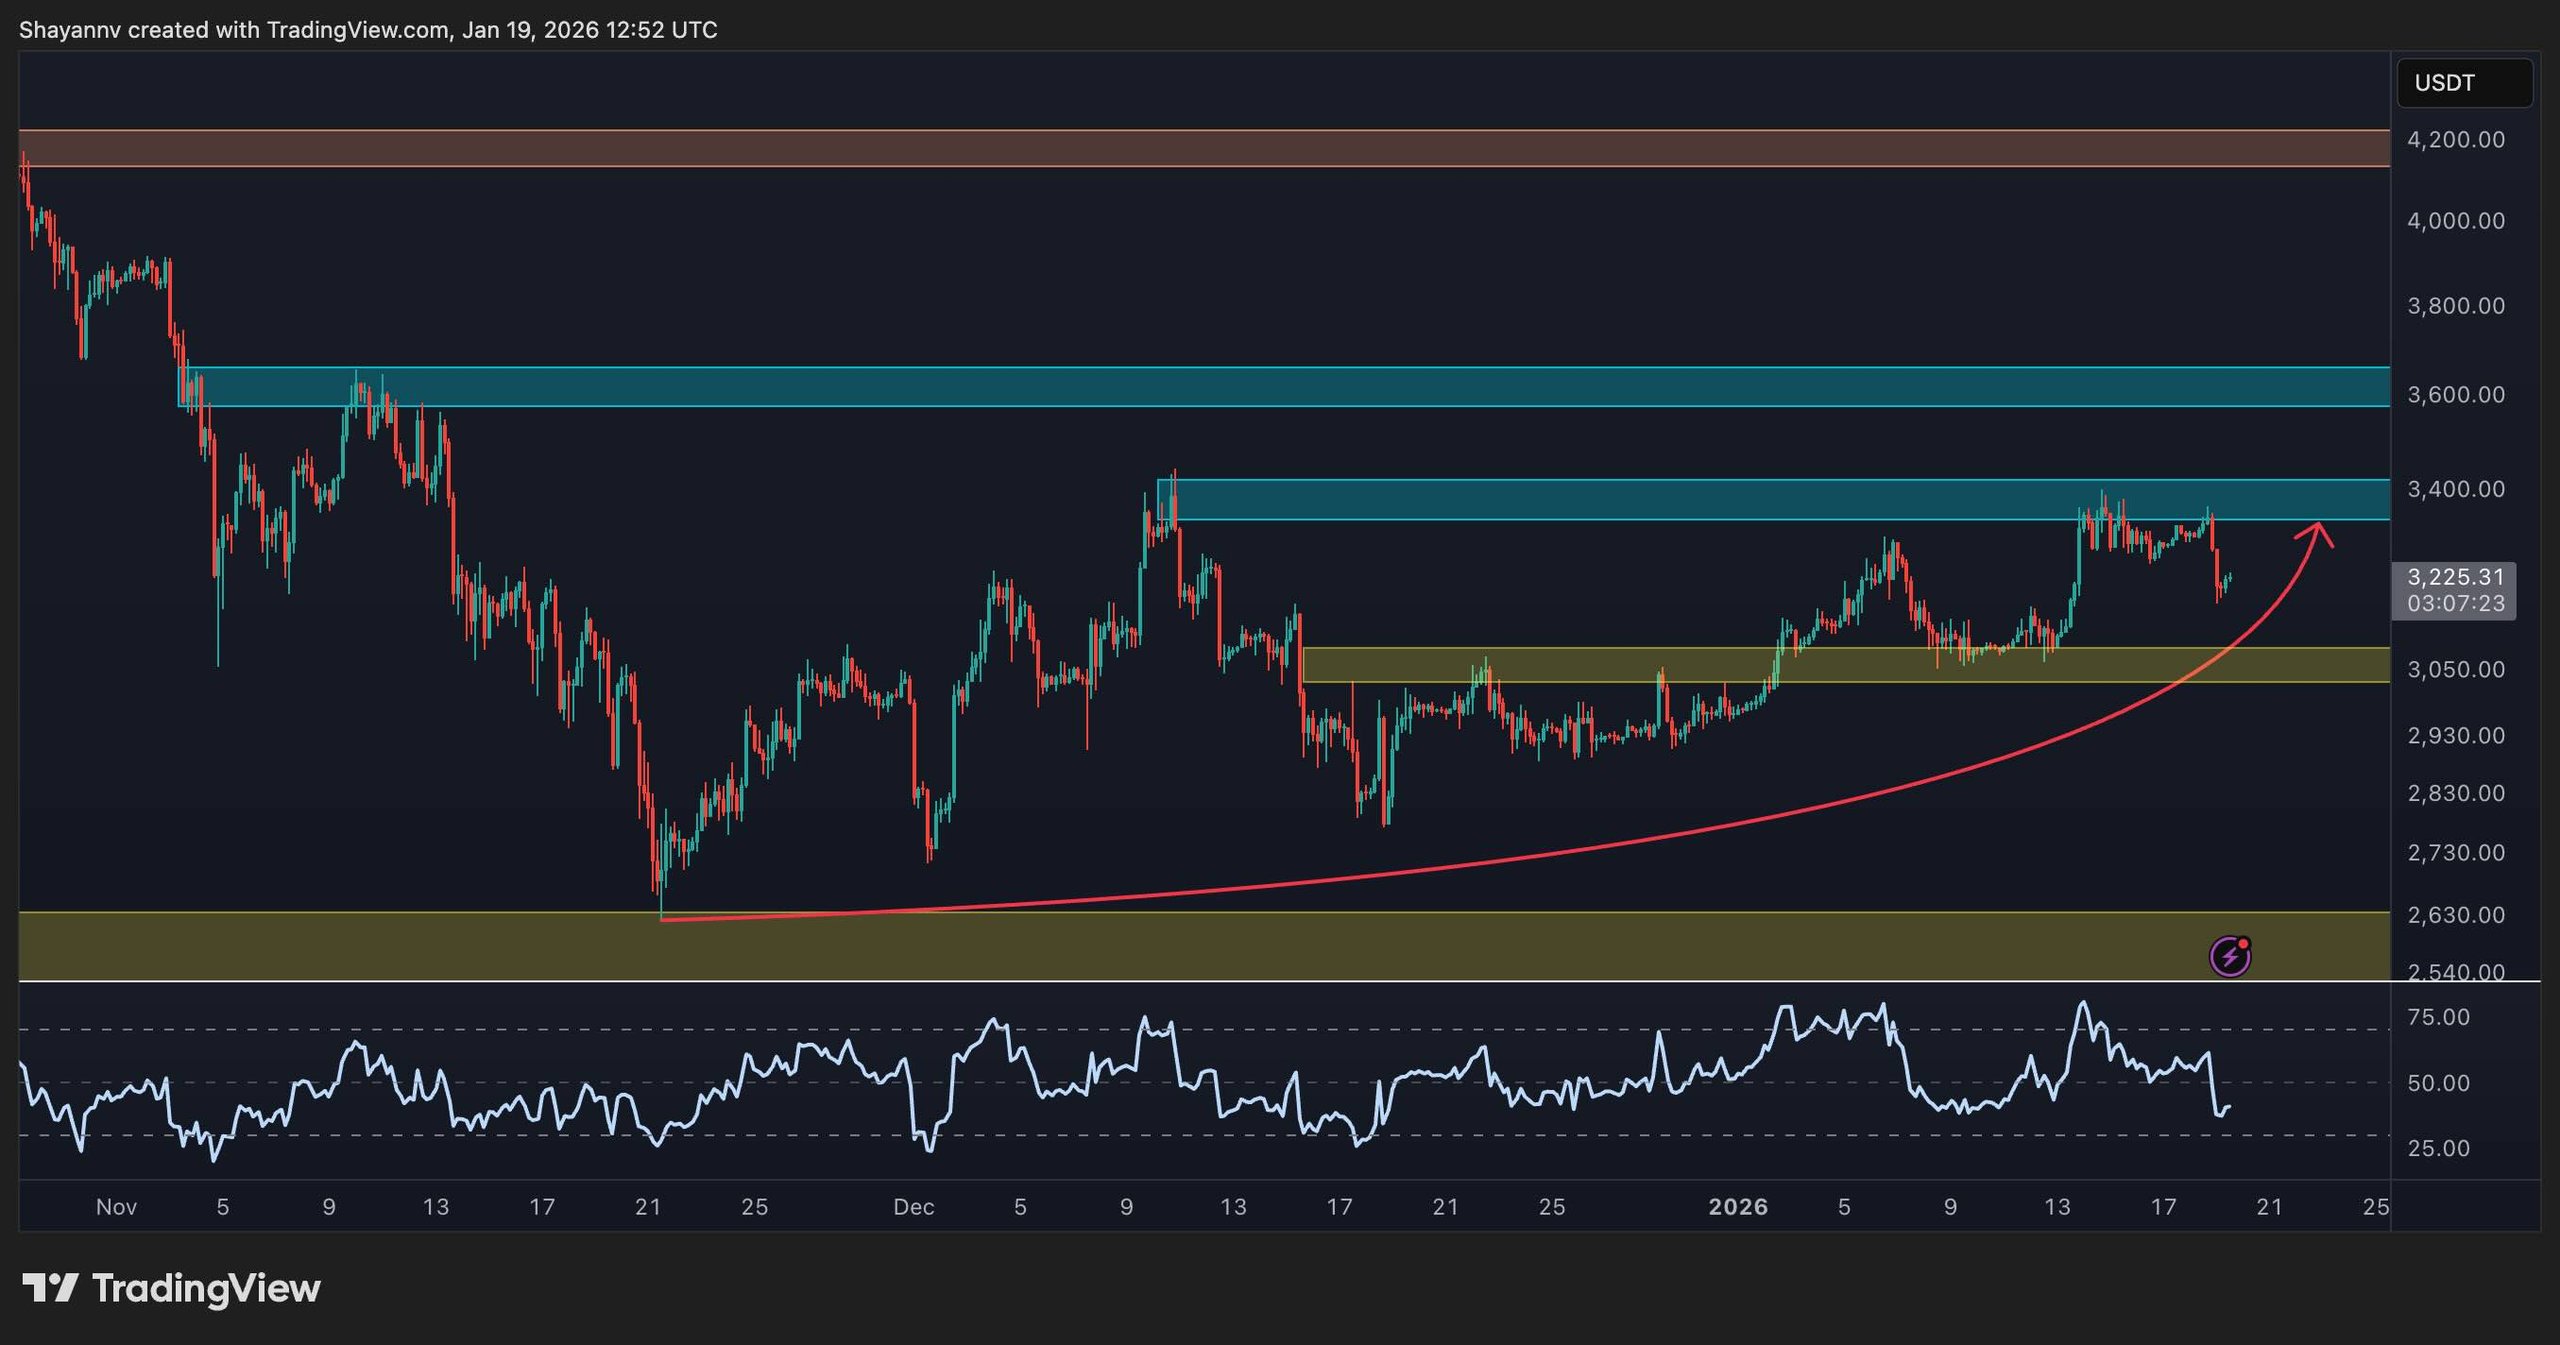 4-Hour Ethereum Chart
View 4-Hour Chart
On-Chain Activity
On-chain data suggests that the total transaction count for Ethereum is on the rise, with a 30-day EMA now exceeding 2 million. This surge occurs even as prices are yet to reach levels seen in previous cycles.
The divergence between growing transaction counts and a recovering price suggests an underlying demand rebalance: network activity is increasing without a corresponding price surge, often indicative of emerging growth phases.
Nonetheless, increased transaction levels around supply barriers can signal potential short-term profit-taking, necessitating a firm reclaim above the $3,400 resistance to confirm a renewed bullish trend.
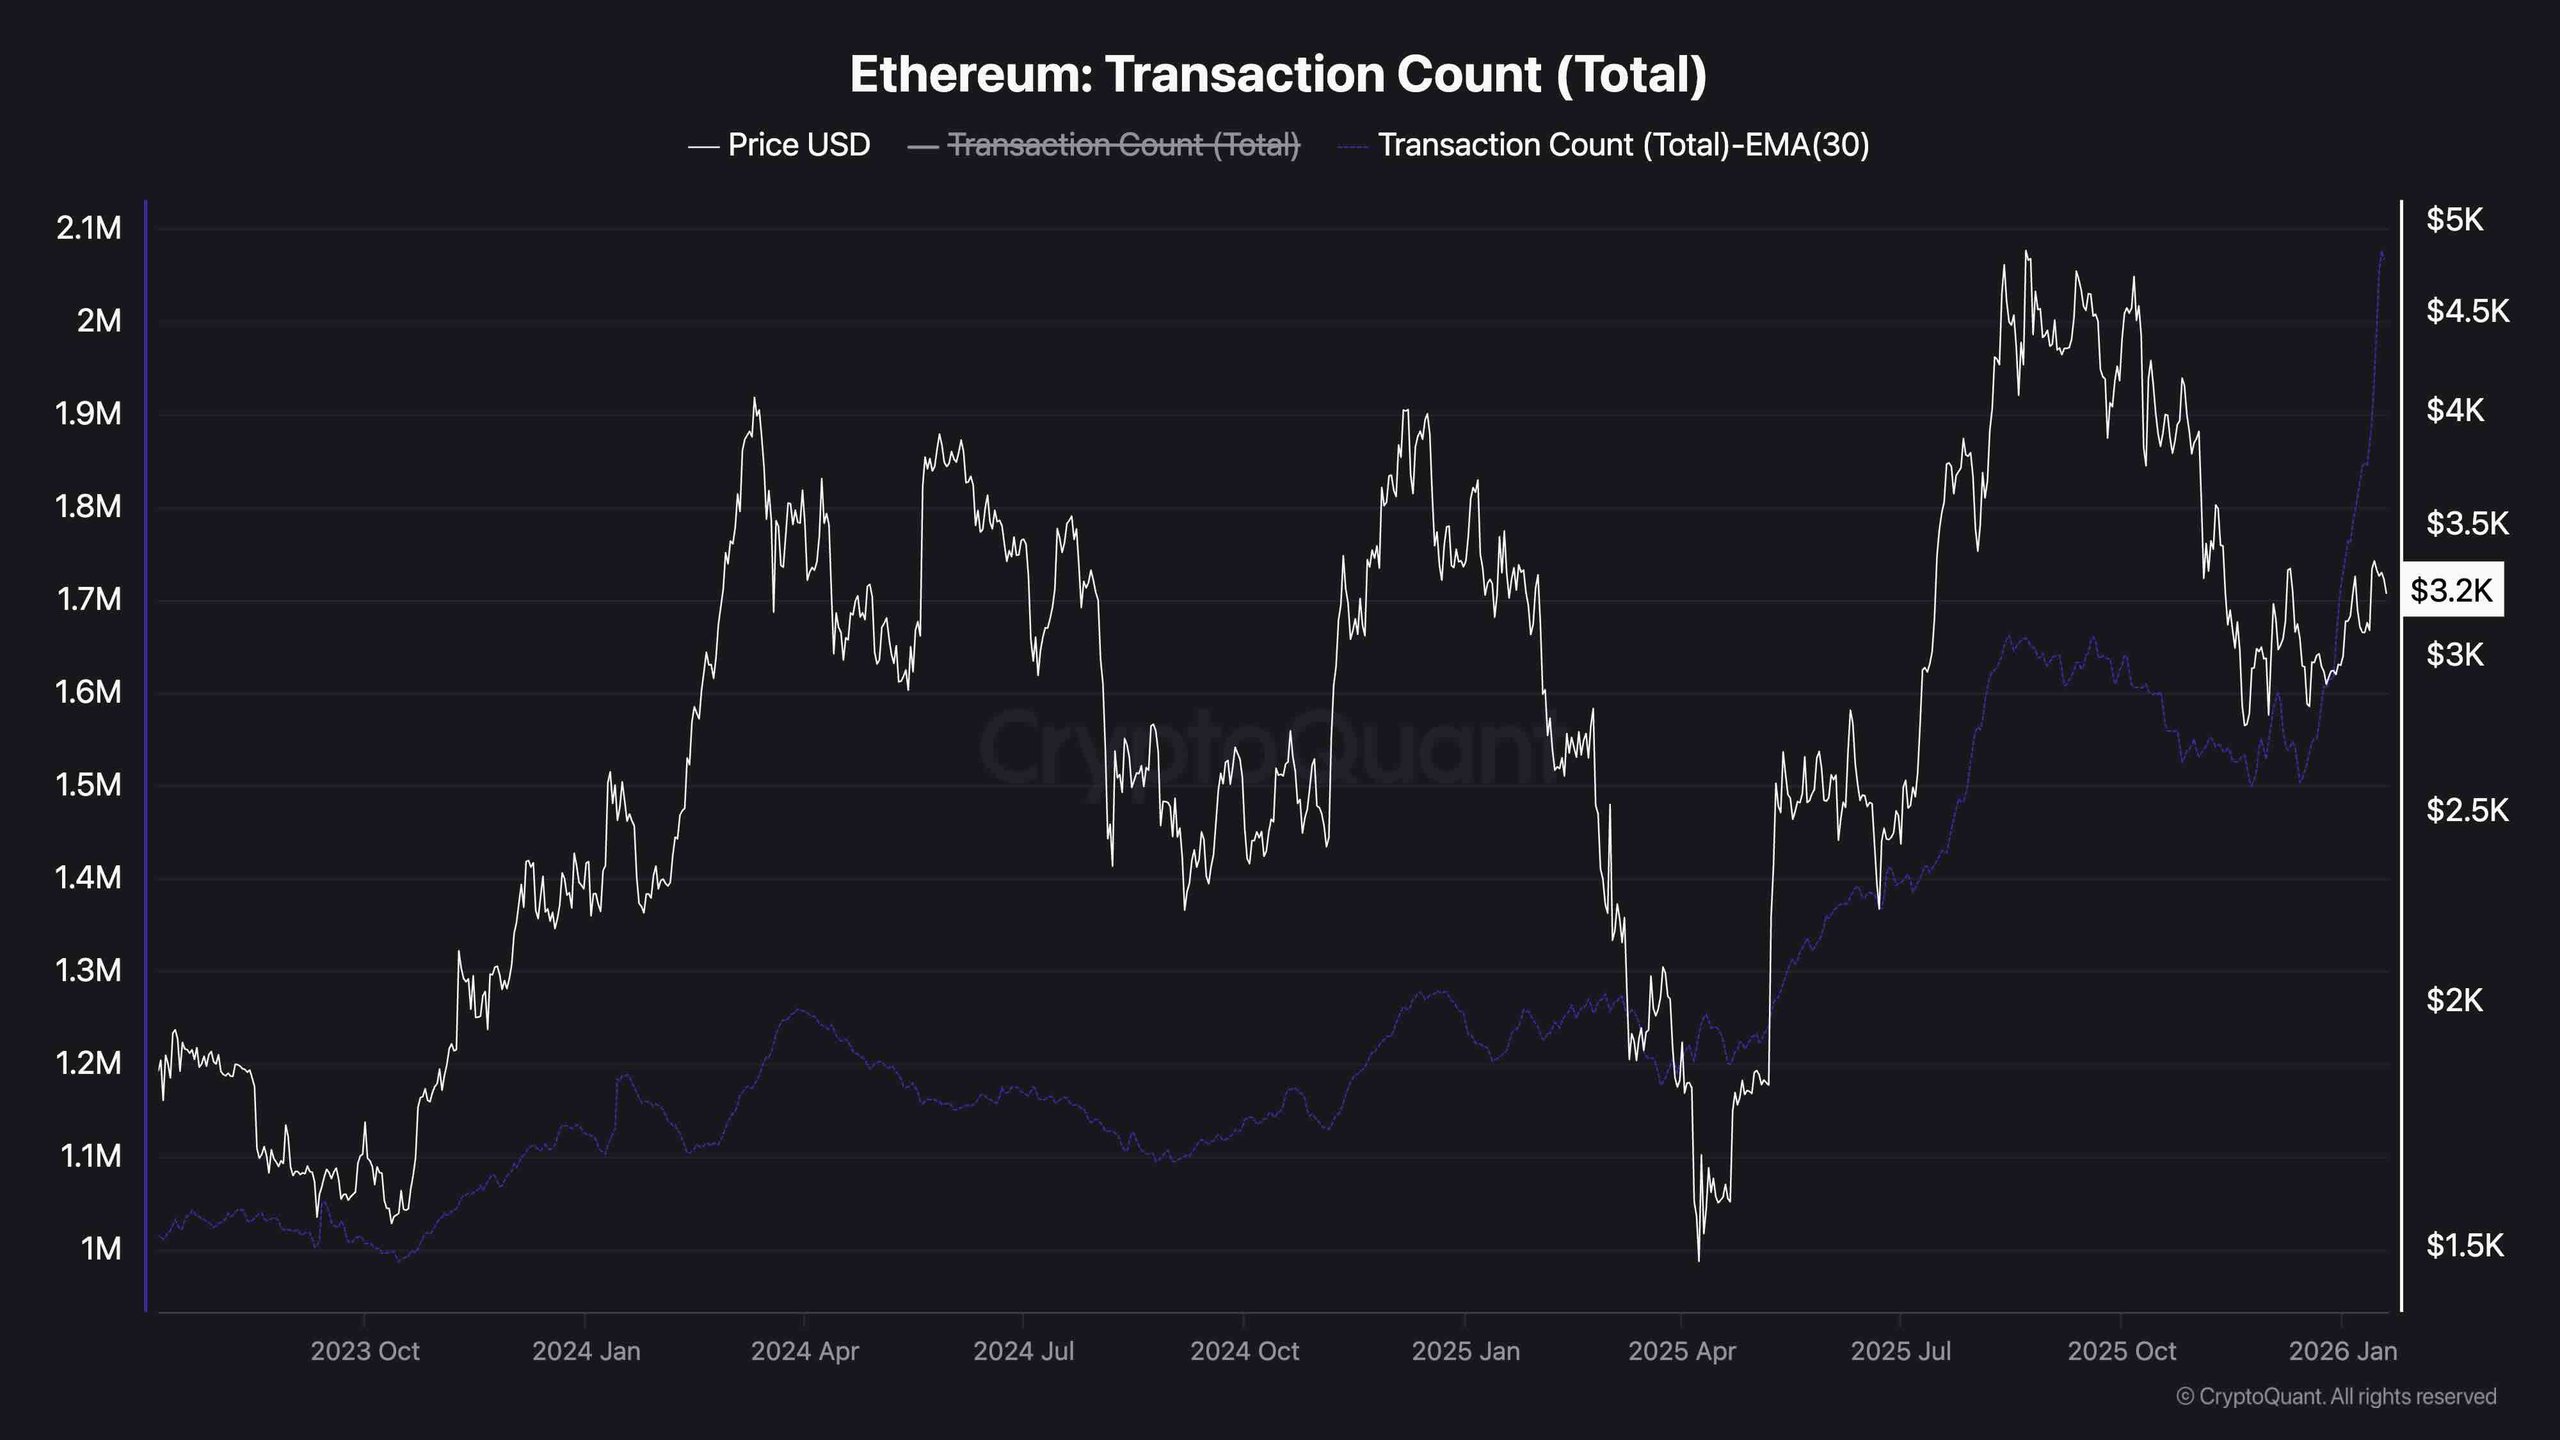 Ethereum Transaction Count
View Full Chart
Disclaimer: Information provided herein reflects the views of the writers mentioned. It does not represent investment advice. Investors should conduct their own research before making any financial decisions.
