Bitcoin Price Evaluation: Will it Surge to $100K or Fall Below $90K?
An analysis on Bitcoin's current price trends and potential future movements.


Bitcoin has been consolidating just below a significant resistance level after a robust recovery from its low points in December. Recent price charts indicate a pattern of higher low formations, while on-chain metrics reveal that the proportion of profitable BTC has experienced a significant reset and is now on the rise.
Bitcoin Price Analysis: Daily Overview
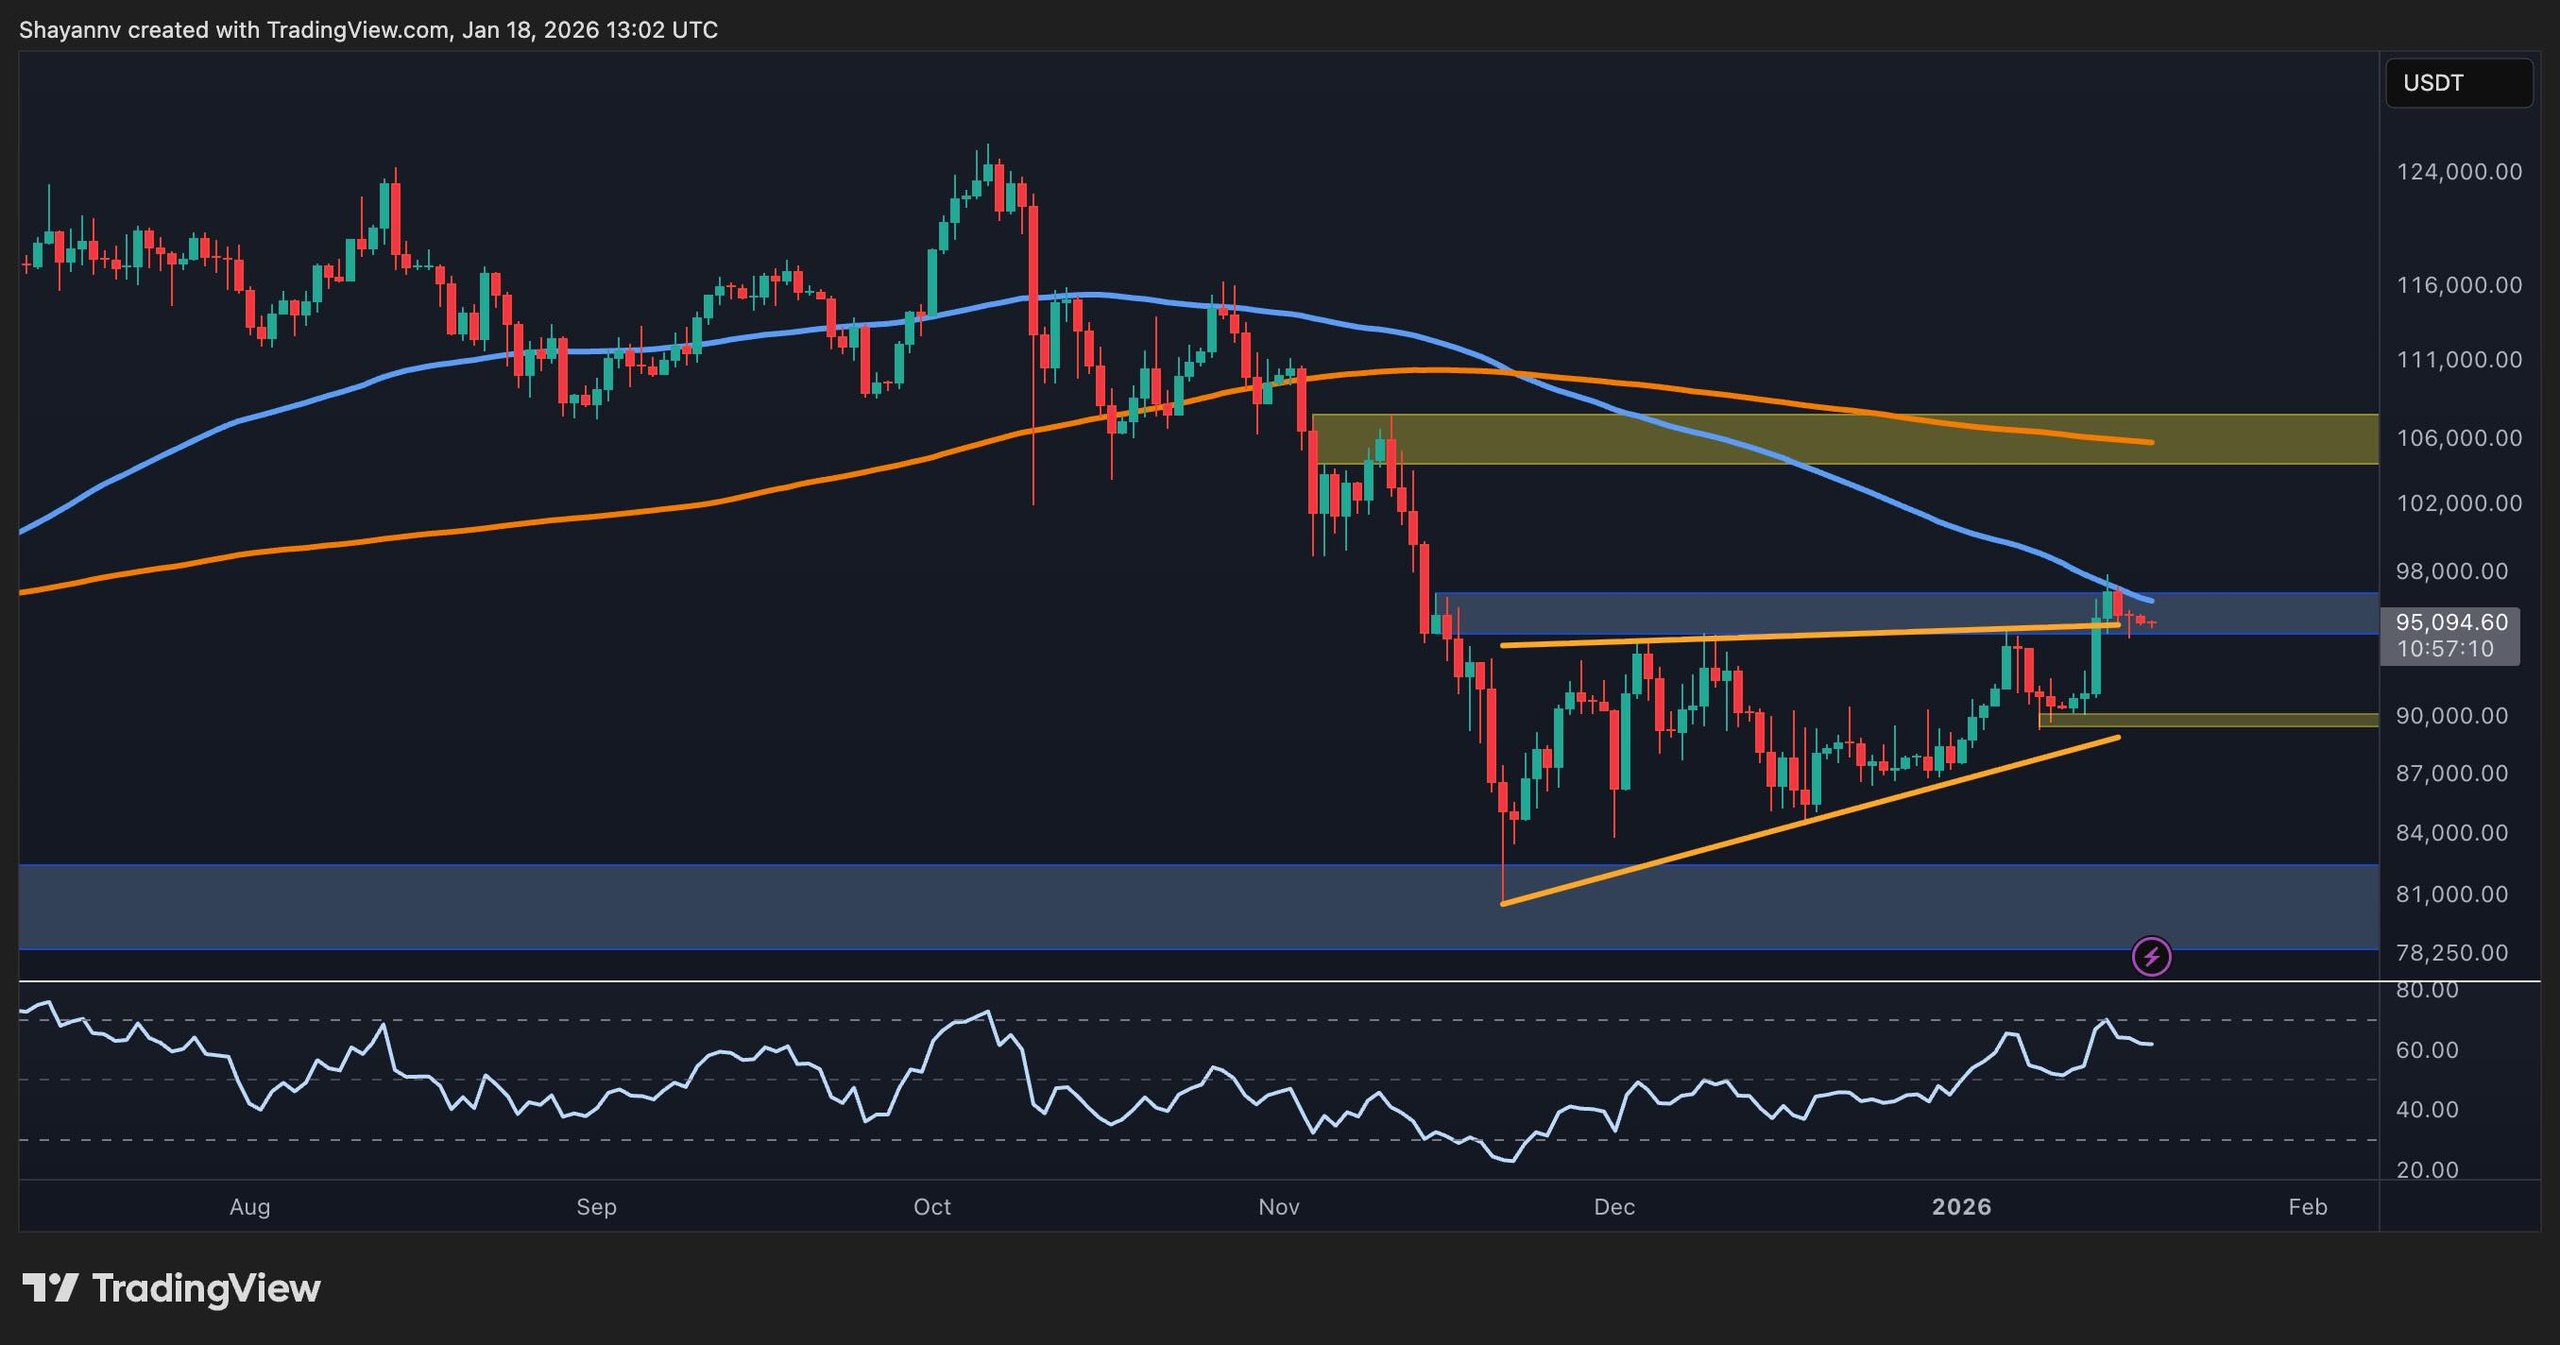
In the daily chart, Bitcoin trades near the $95,000 resistance area, which lines up with the lower edge of a wider supply zone and the 100-day moving average. This zone has historically served as a ceiling since November and is currently being challenged.
Beneath the present levels lies an upward structure stemming from the $80,000 support zone, establishing an ascending series of higher lows. The recent market push has effectively navigated the asset from that base into the resistance area, with $90,000 identified as the immediate support level for any pullbacks.
The Daily RSI has subsided from recent overbought states but remains above the central line, indicating an early to mid-trend market condition rather than a mature peak. As long as the higher-low structure from the December minimum is preserved, the overall daily trend remains promising, even amidst possible short-term fluctuations around the resistance.
Bitcoin Daily Chart
BTC/USDT Four-Hour Chart
The four-hour chart reveals a recent surge following an ascending triangle breakout. The price consolidated for several weeks between the resistance around $95,000 and the rising trendline. This resistance has been marginally surpassed, and the market is stabilizing just above the prior peak, with potential upward targets near the $100,000 level.
However, short-term momentum on the RSI suggests a declining trend, indicating potential weakness in the near term and the possibility of a corrective phase or sideways movement.
If a correction occurs, the $93,000–$94,000 zone represents the immediate testing grounds for the breakout, where stability will be crucial to maintain the bullish trend. Further down, the $90,000 area is notable as it marks the previous consolidation range and serves as logical support for a healthy pullback during an upward trend.
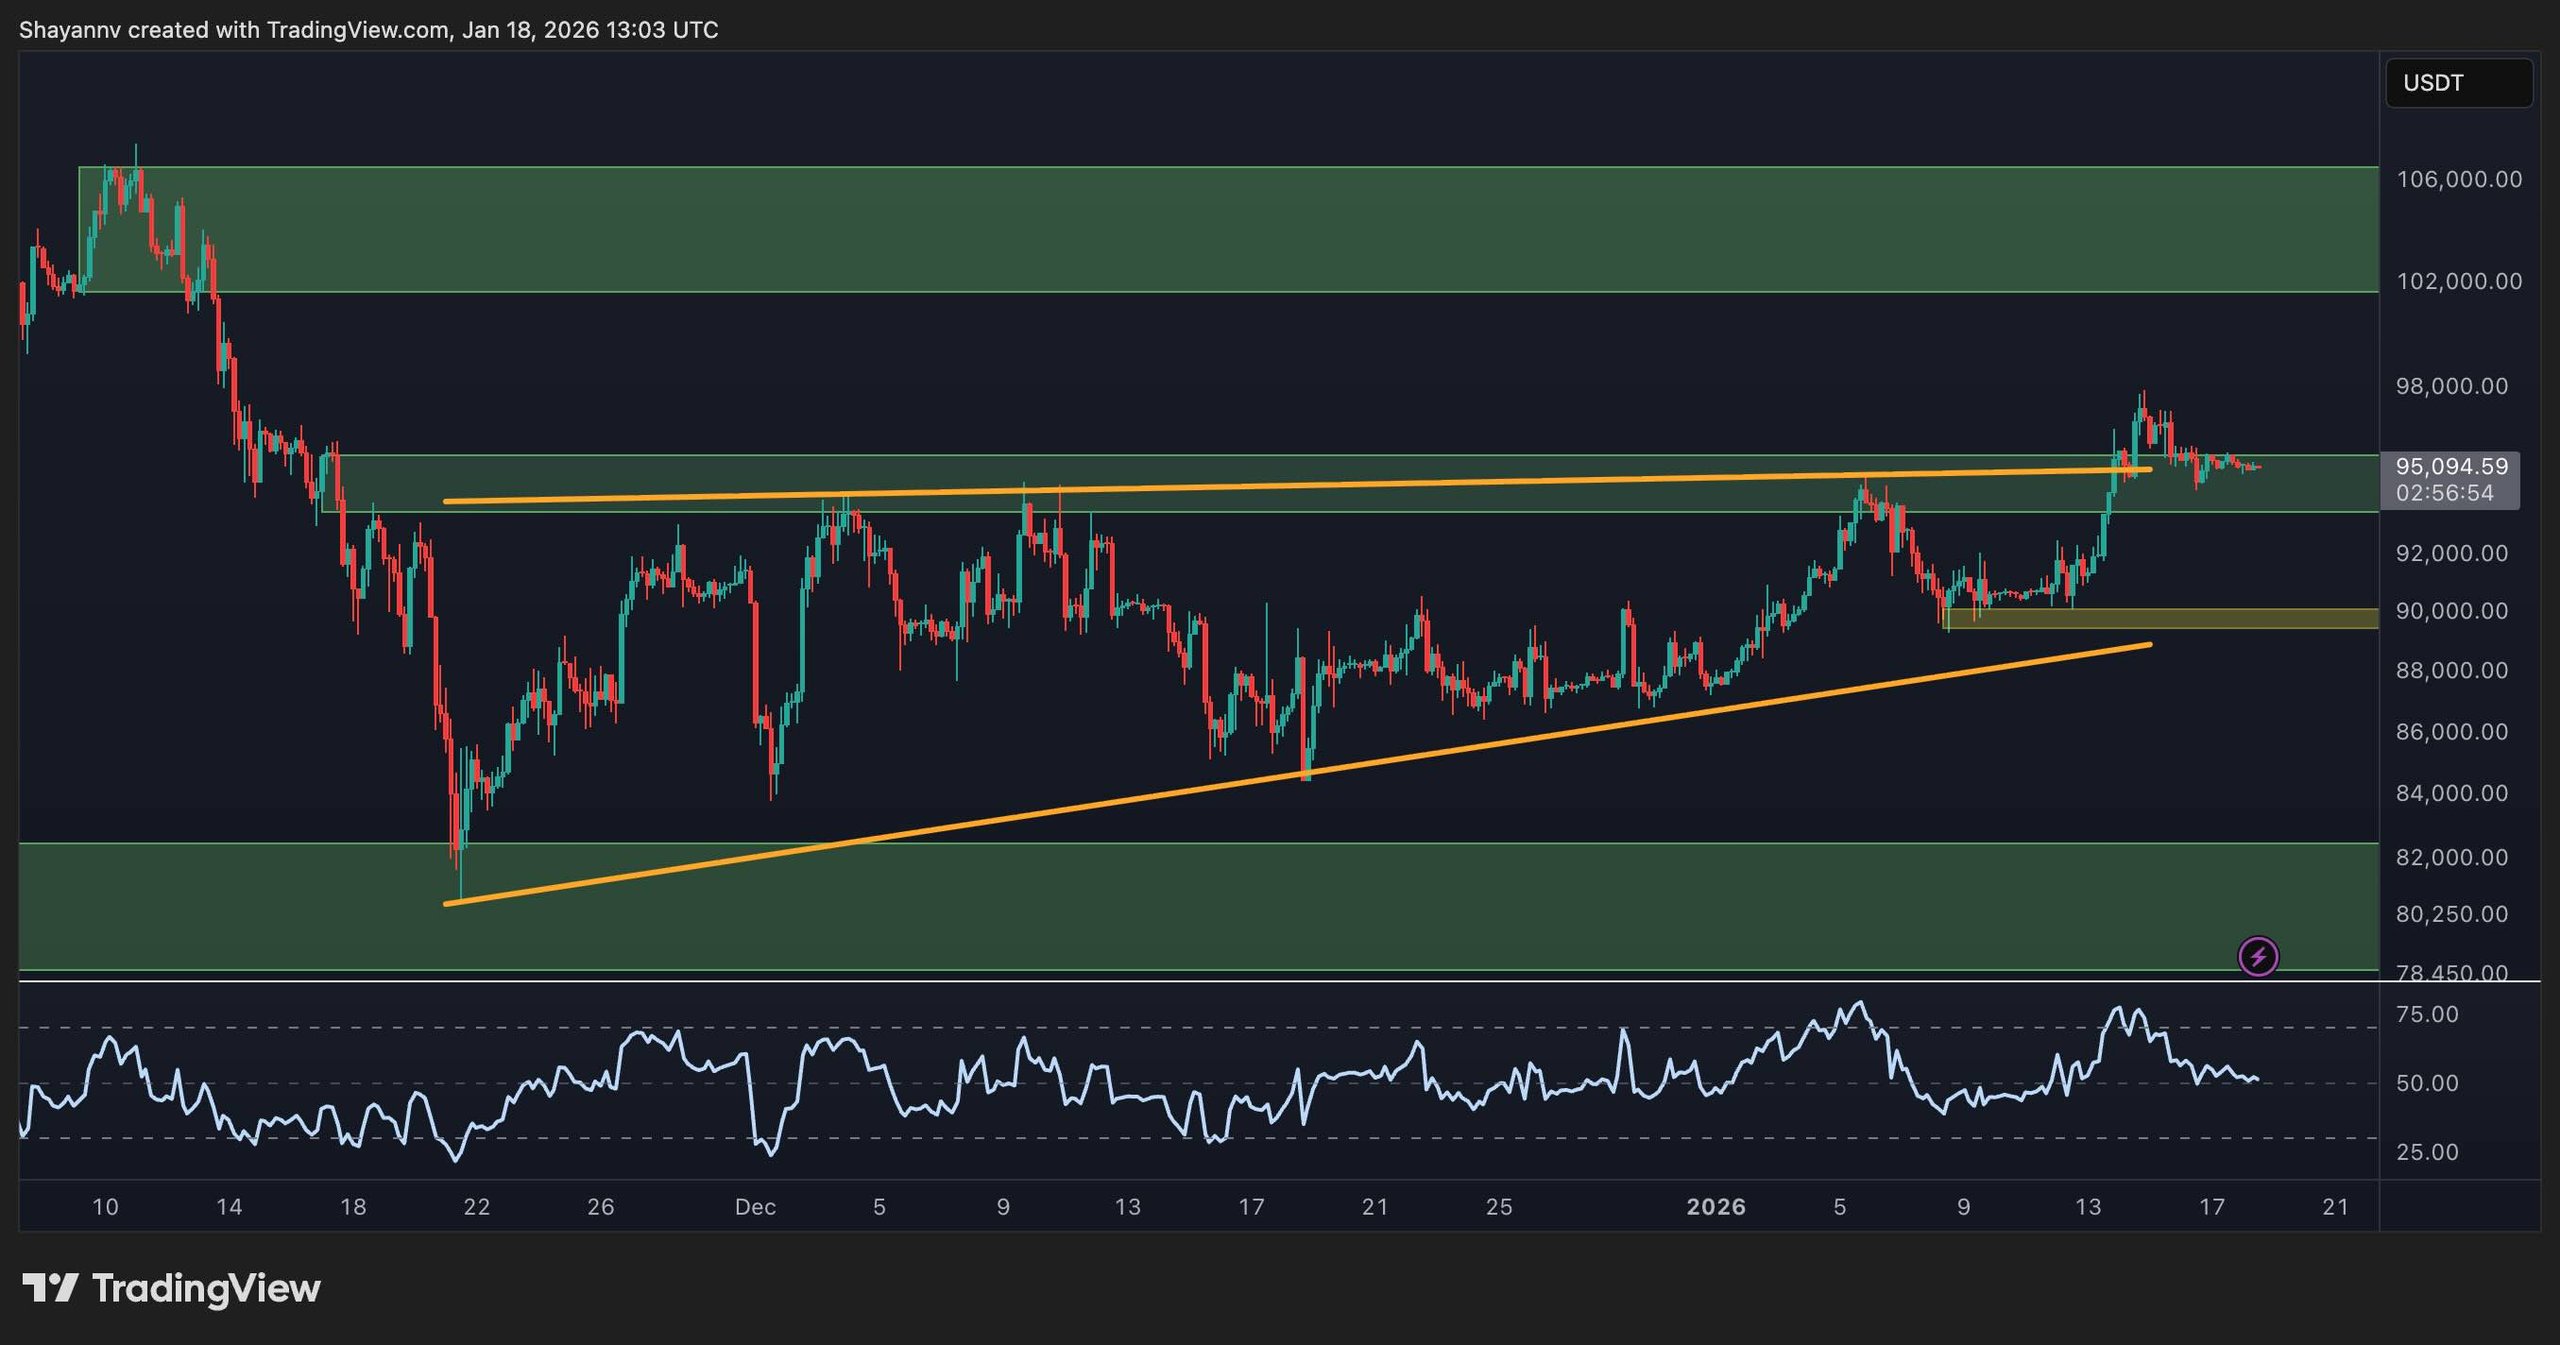 BTC/USDT 4H Chart
On-Chain Metrics
The Supply in Profit percentage currently signals a vital cyclical movement. Recently, the proportion of circulating Bitcoin at a profit fell to levels unseen since the spot price dipped below $30,000 during earlier cycles. This shift can occur even with current prices exceeding $90,000.
The stark reset in profitability at such elevated values implies that a sizable number of coins have changed ownership, with unrealized gains diminishing during recent market corrections. In history, similar resets have often preceded significant medium-term price increases, as nervous hands exit the market and a stronger holder community forms.
The metric is showing signs of recovery and is approaching the mid-70% area, suggesting profitability is rebounding but hasn’t yet hit extremes typical of market exuberance. This combination reflects a positive on-chain environment, aligned with the early signs of a potential new rally, assuming key resistances on the chart are successfully breached.
