
Ethereum's Market Signals Shift as Positive Taker Volume Emerges
Ethereum's net taker volume signals a potential bullish change after years of sell-side pressure, indicating renewed interest among traders.


Ethereum’s derivatives data shows a pivotal market shift after almost three years dominated by sellers. Recent data indicates that ETH’s net taker volume has turned positive for the first time in years, prompting speculation on whether traders will capitalize on this signal to boost Ether prices.
Key Insights:
- Since January 6, ETH’s net taker volume hit $390 million, presenting the first significant buy imbalance of 2023.
- Positive volume trends correlate with price bottoms and ongoing uptrends.
- Despite a negative cumulative volume delta (CVD), ETH remains above $3,000, indicating strong absorption from larger entities.
Notable Trend Shift in ETH’s Volume
The latest figures reveal a positive imbalance of approximately $390 million in ETH’s net taker volume since early January, underscoring a notable increase in buy-side activity. This metric evaluates whether trades are predominantly aggressive purchases at market rates or selling against existing bids, with positive values signaling trader confidence.
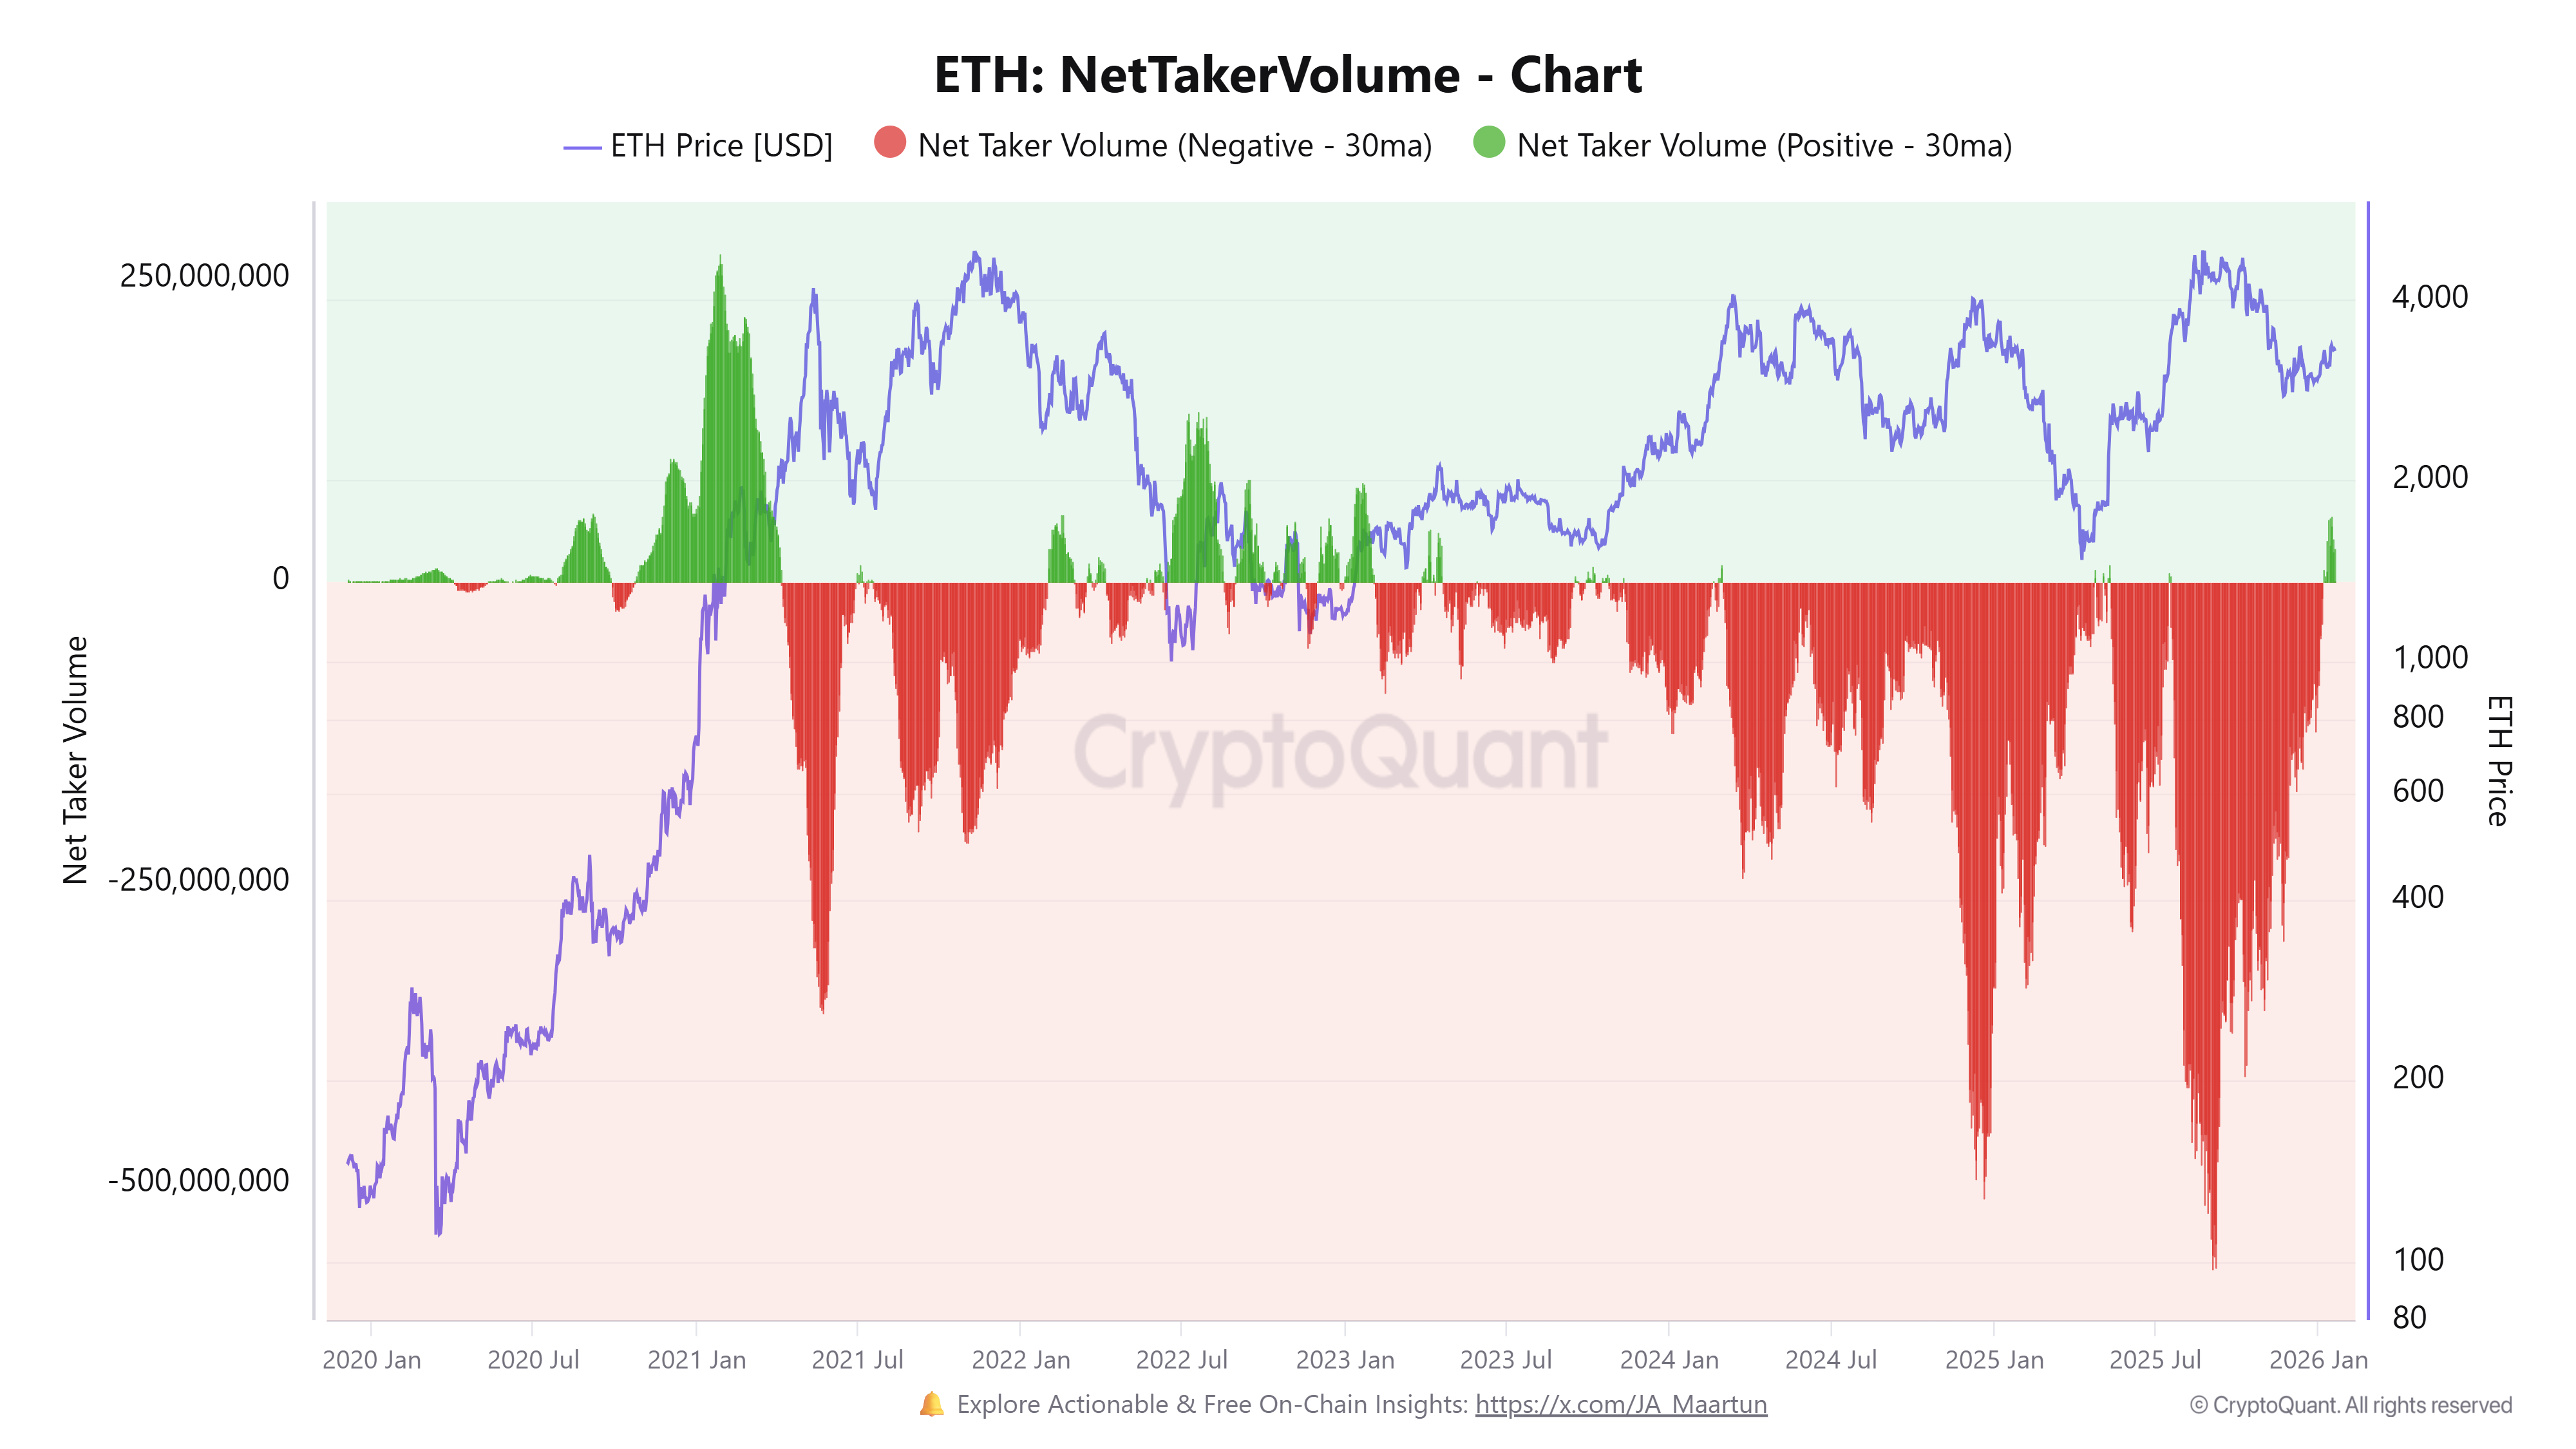 Ether Net Taker Volume
Ether net taker volume. Source: CryptoQuant
Ether Net Taker Volume
Ether net taker volume. Source: CryptoQuant
A Shift from Sell-Side Dominance
Historically, notable increases in net taker volume have preceded extended upward trends, rather than marking peaks. This current reversal hints at a long-term shift in futures demand rather than short-lived corrections. Past instances of similar trends often foreshadow significant upward price movements.
ETH Navigates Key Liquidity Levels
CryptoQuant’s data reveals that while ETH holds at around $3,000, CVD remains negative indicating short-term pressure. However, a robust correlation between price and CVD suggests that trading activity still benefits from available liquidity.
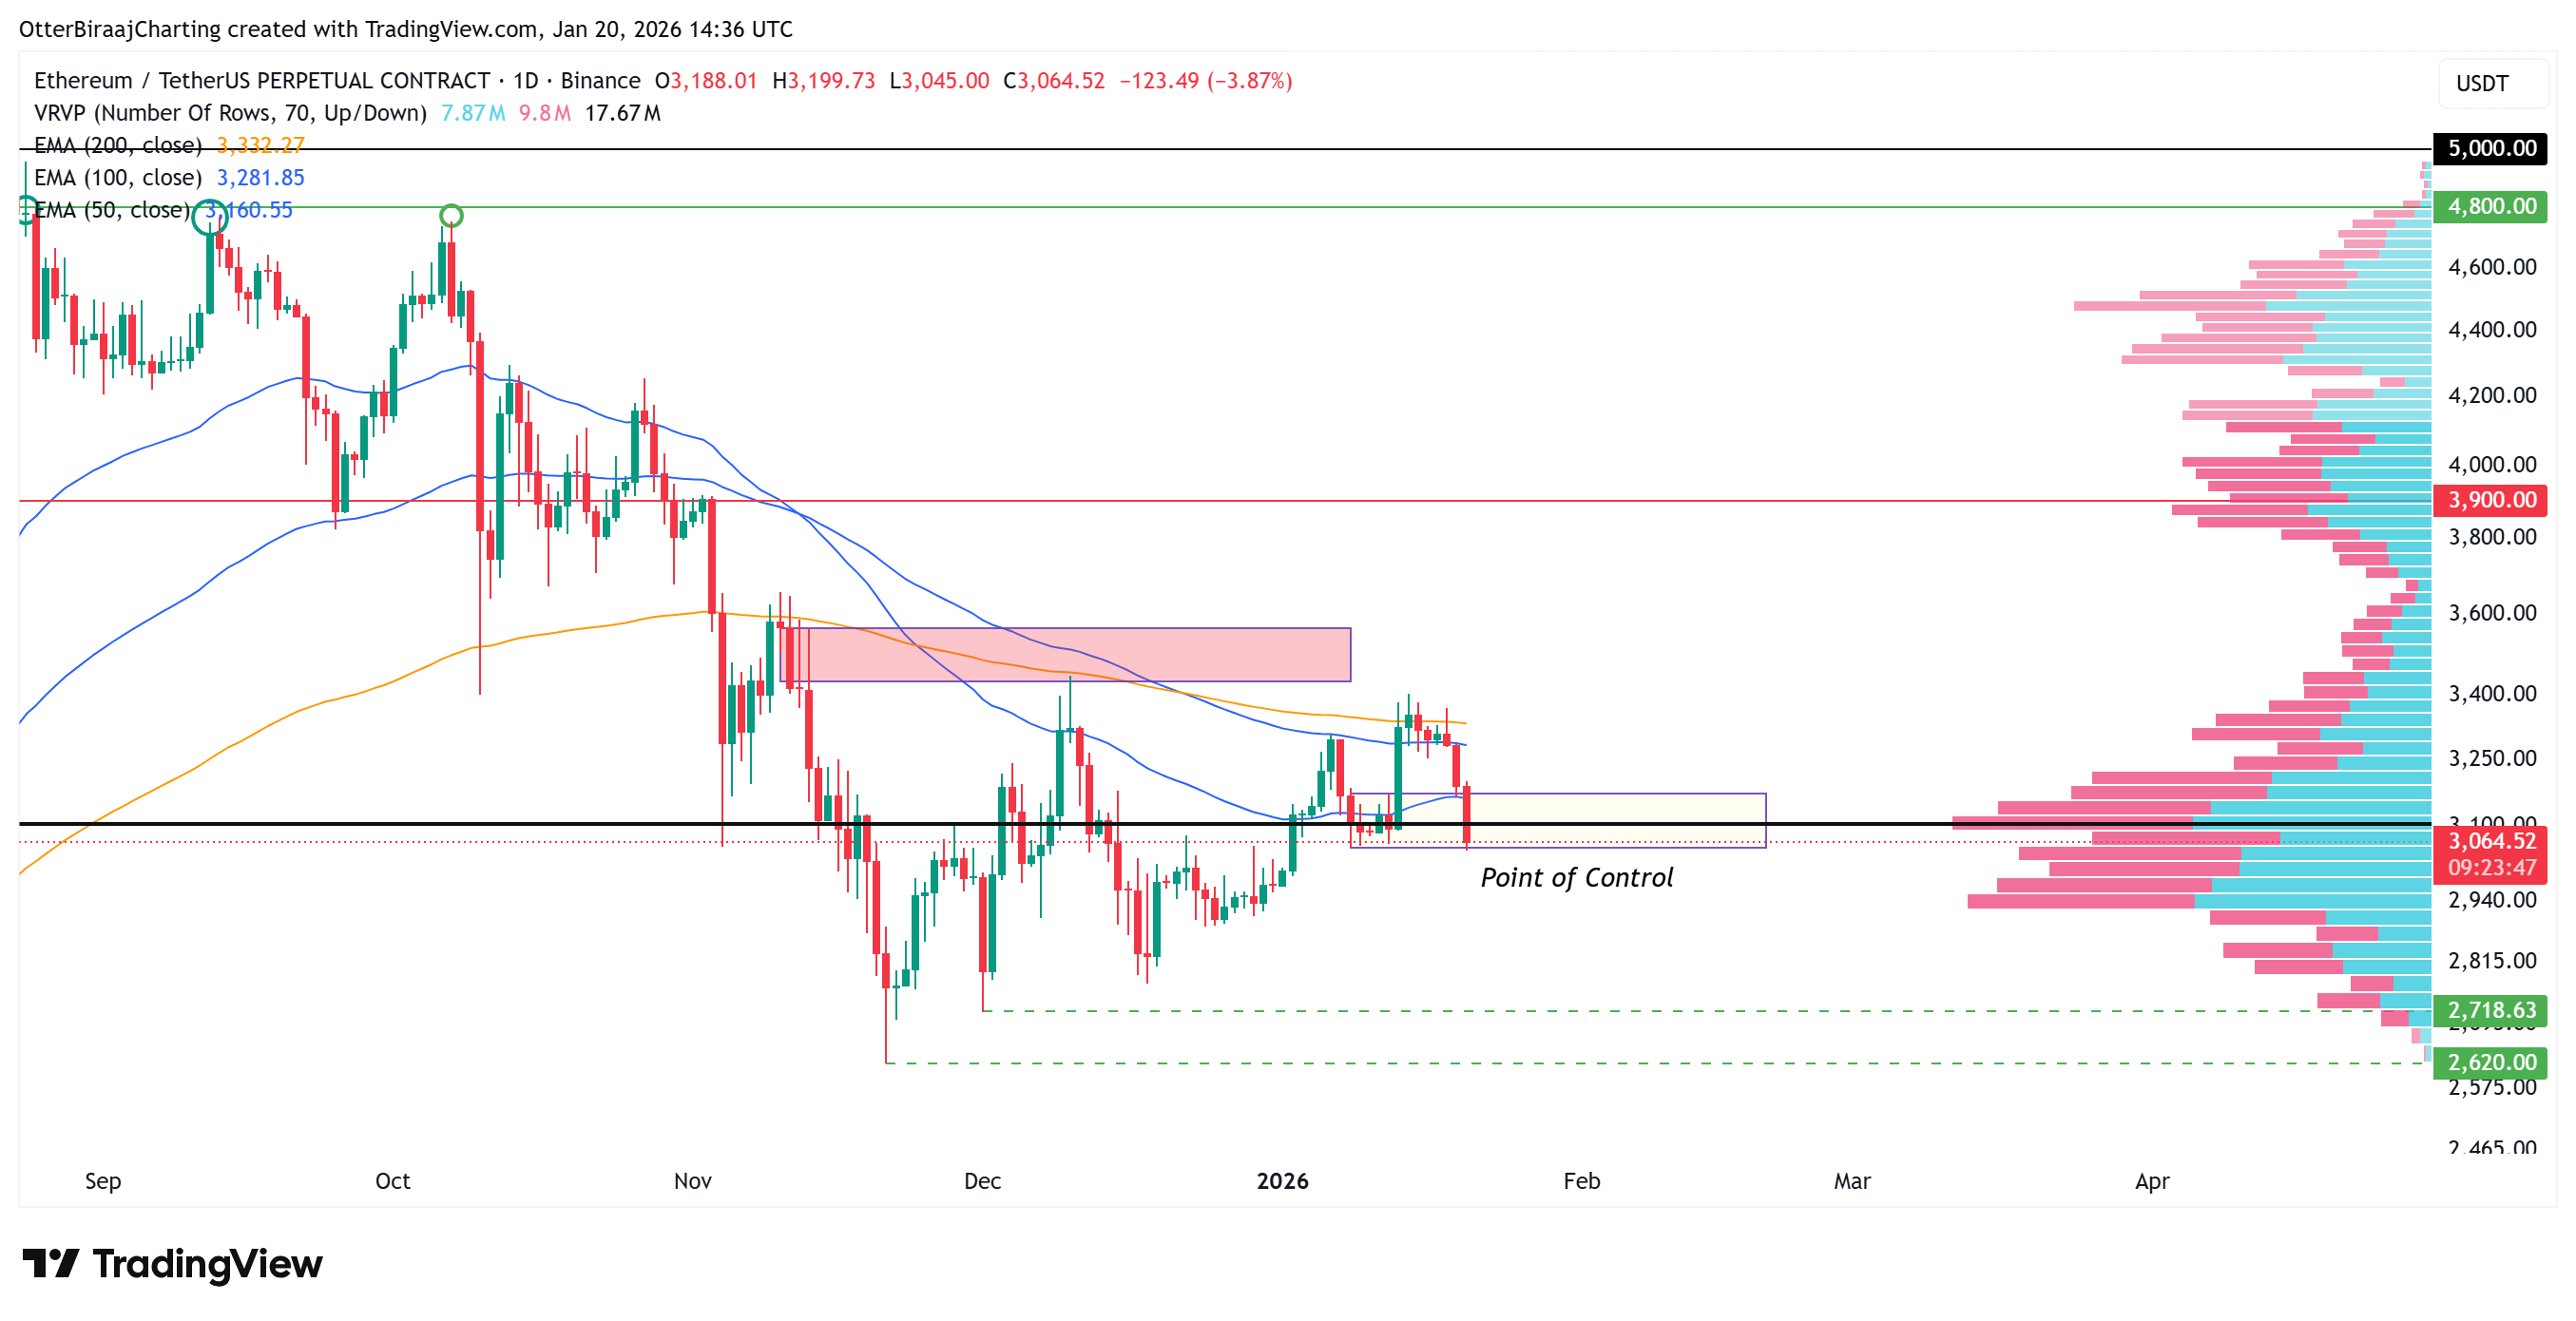 Ether One-Day Chart
Ether one-day chart. Source: Cointelegraph/TradingView
Ether One-Day Chart
Ether one-day chart. Source: Cointelegraph/TradingView
In summary, as ETH trades near critical liquidity zones, investors appear to be taking profits amidst this shifting landscape, maintaining ETH’s stability above the $3,000 mark while adjusting positions for future movements. Further, data shows significant net long positions, forecasting continuous fluctuation within this range as liquidity balances out.
