Ethereum Price Forecast: What Lies Ahead After Dropping Below $3K Support?
Analyzing Ethereum's current price trends and market conditions as it struggles to maintain its value.


Ethereum is currently experiencing a corrective phase after a downturn from the mid-$3,000 range. The price has seen declines in both daily and 4-hour perspectives, while on-chain metrics suggest a structural supply leaving exchanges.
This mix of short-term technical weaknesses against a still-positive longer-term outlook may allow for more downward or sideways movement in the immediate future without compromising the overarching bullish trend.
Analysis of Ethereum Price: Daily Chart
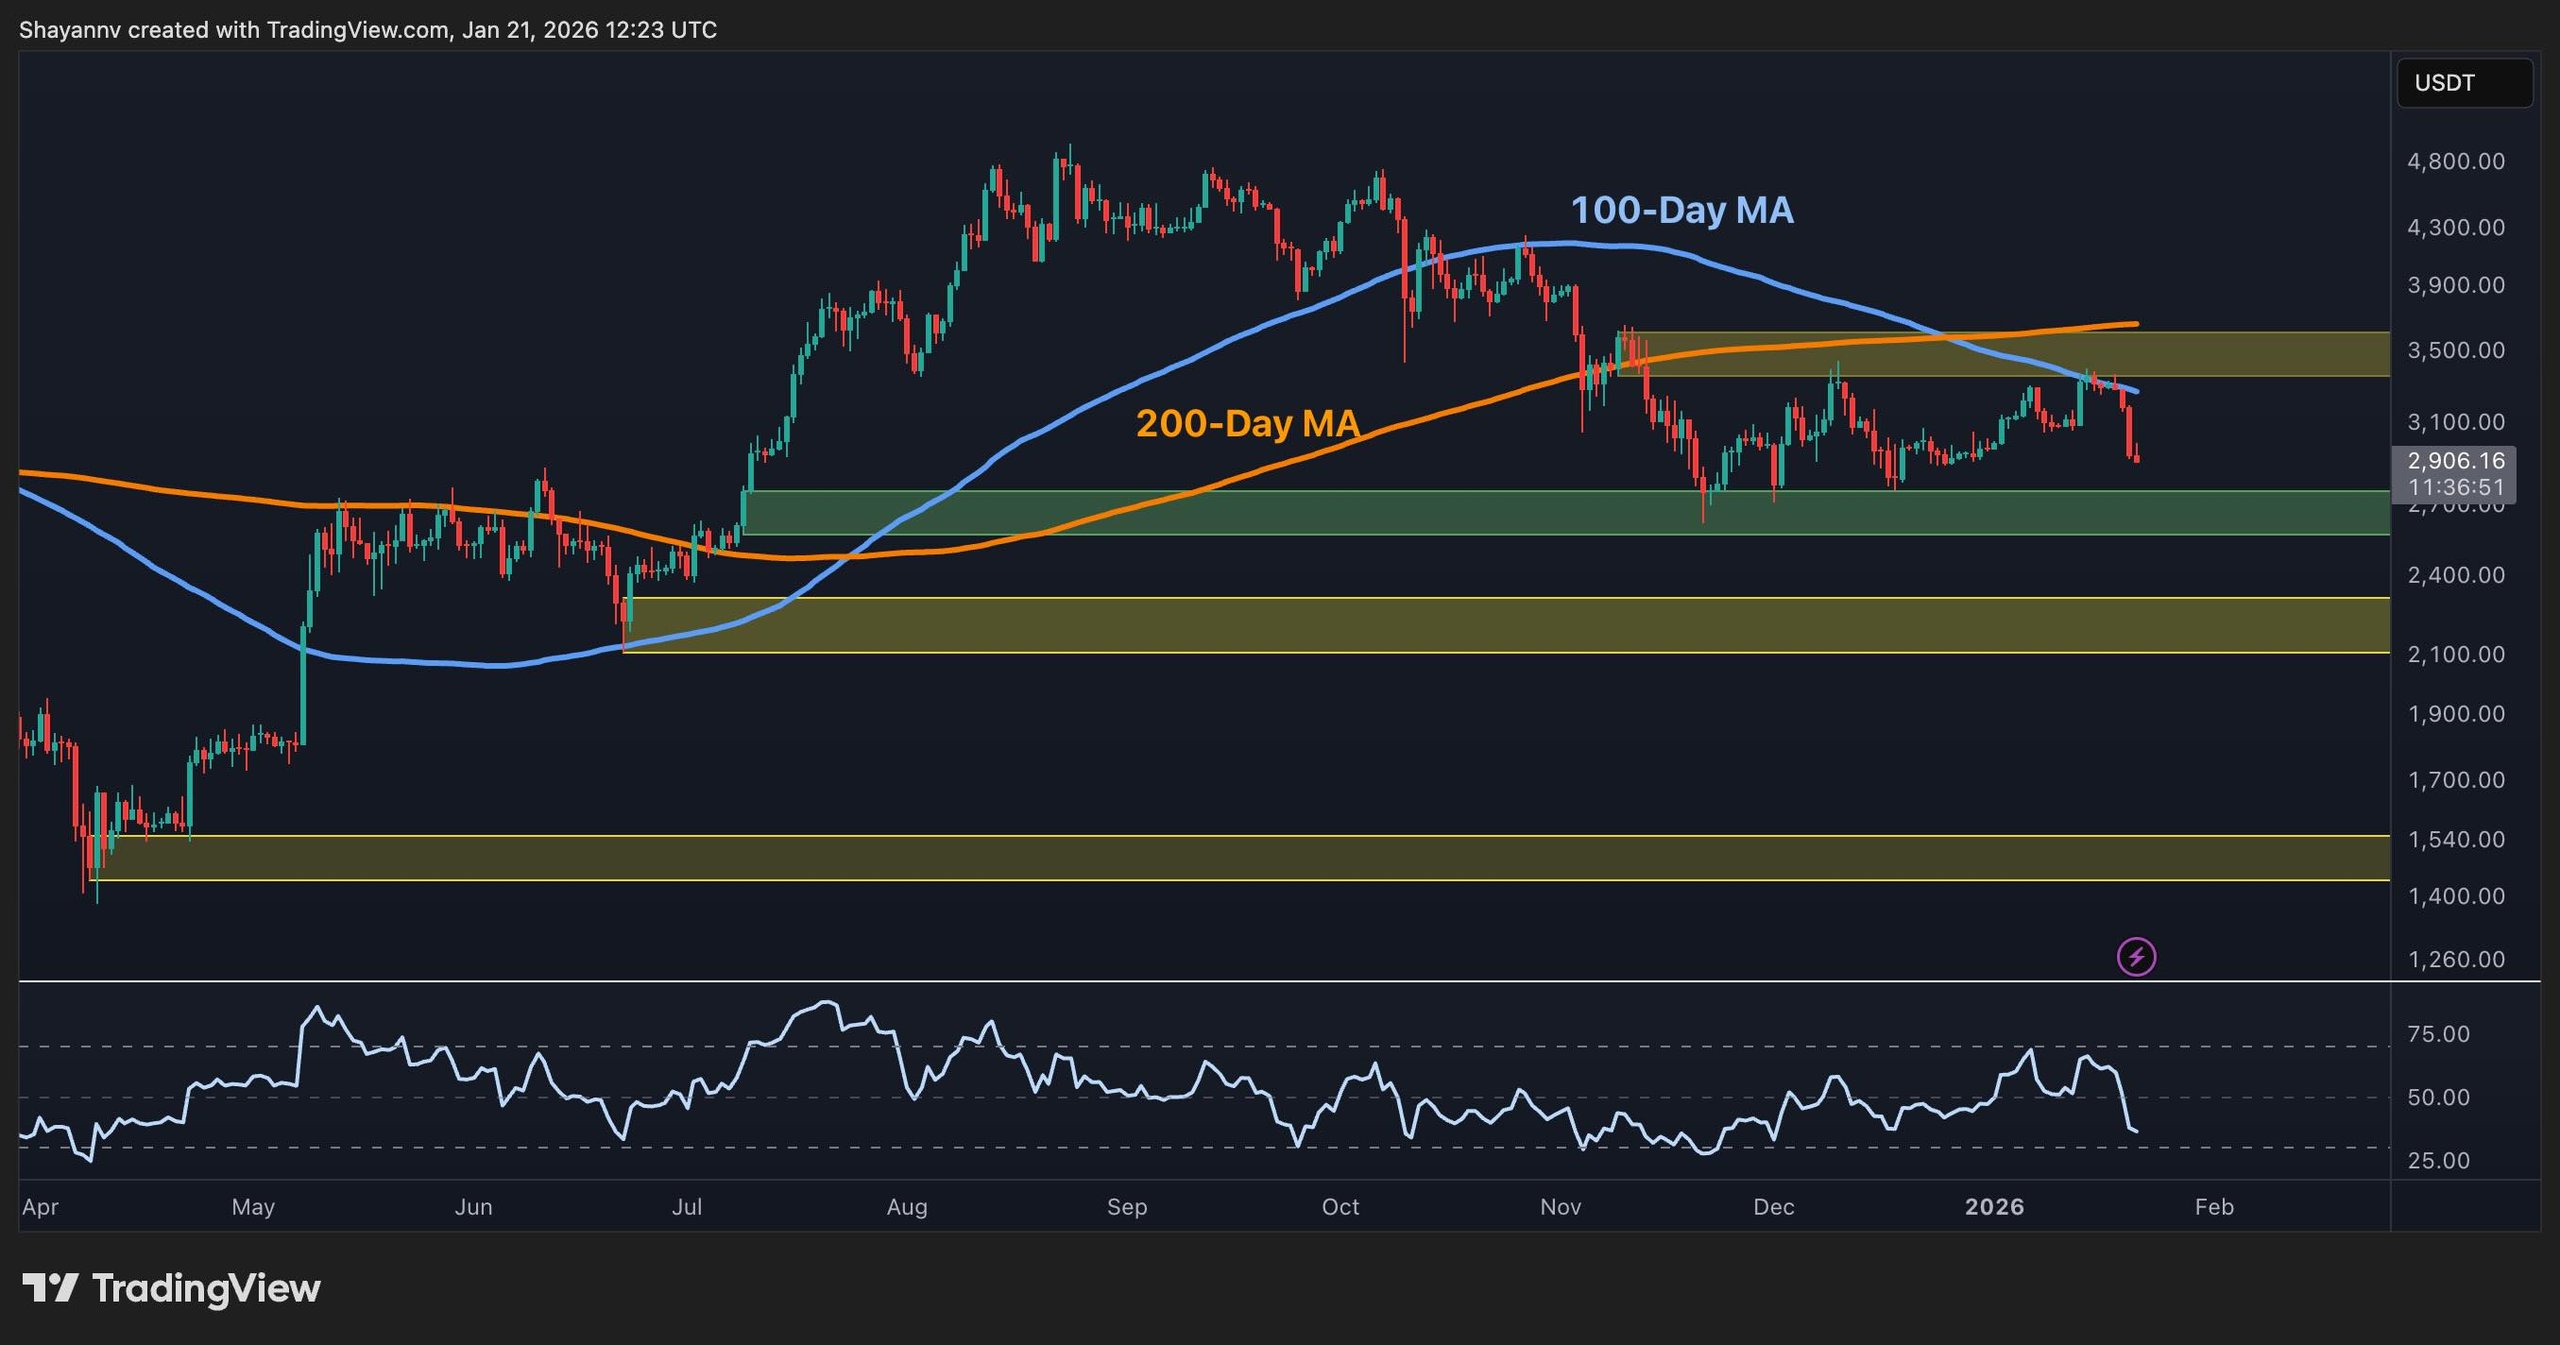
On the daily chart, ETH suffered a setback after failing to hold above the $3,300–$3,400 resistance area, which closely aligns with the declining 100-day moving average. The price is currently situated below the more robust 200-day moving average.
This rejection confines the market within a significant range, with $2,500–$2,600 acting as the nearest major demand zone and the $3,300–$3,400 vicinity as the critical supply region that must be cleared to restore a strong bullish run. The daily RSI has also dropped from nearly overbought territory to below 50, signifying a momentum decline consistent with a corrective phase towards the identified support cluster.
Ethereum Daily Chart
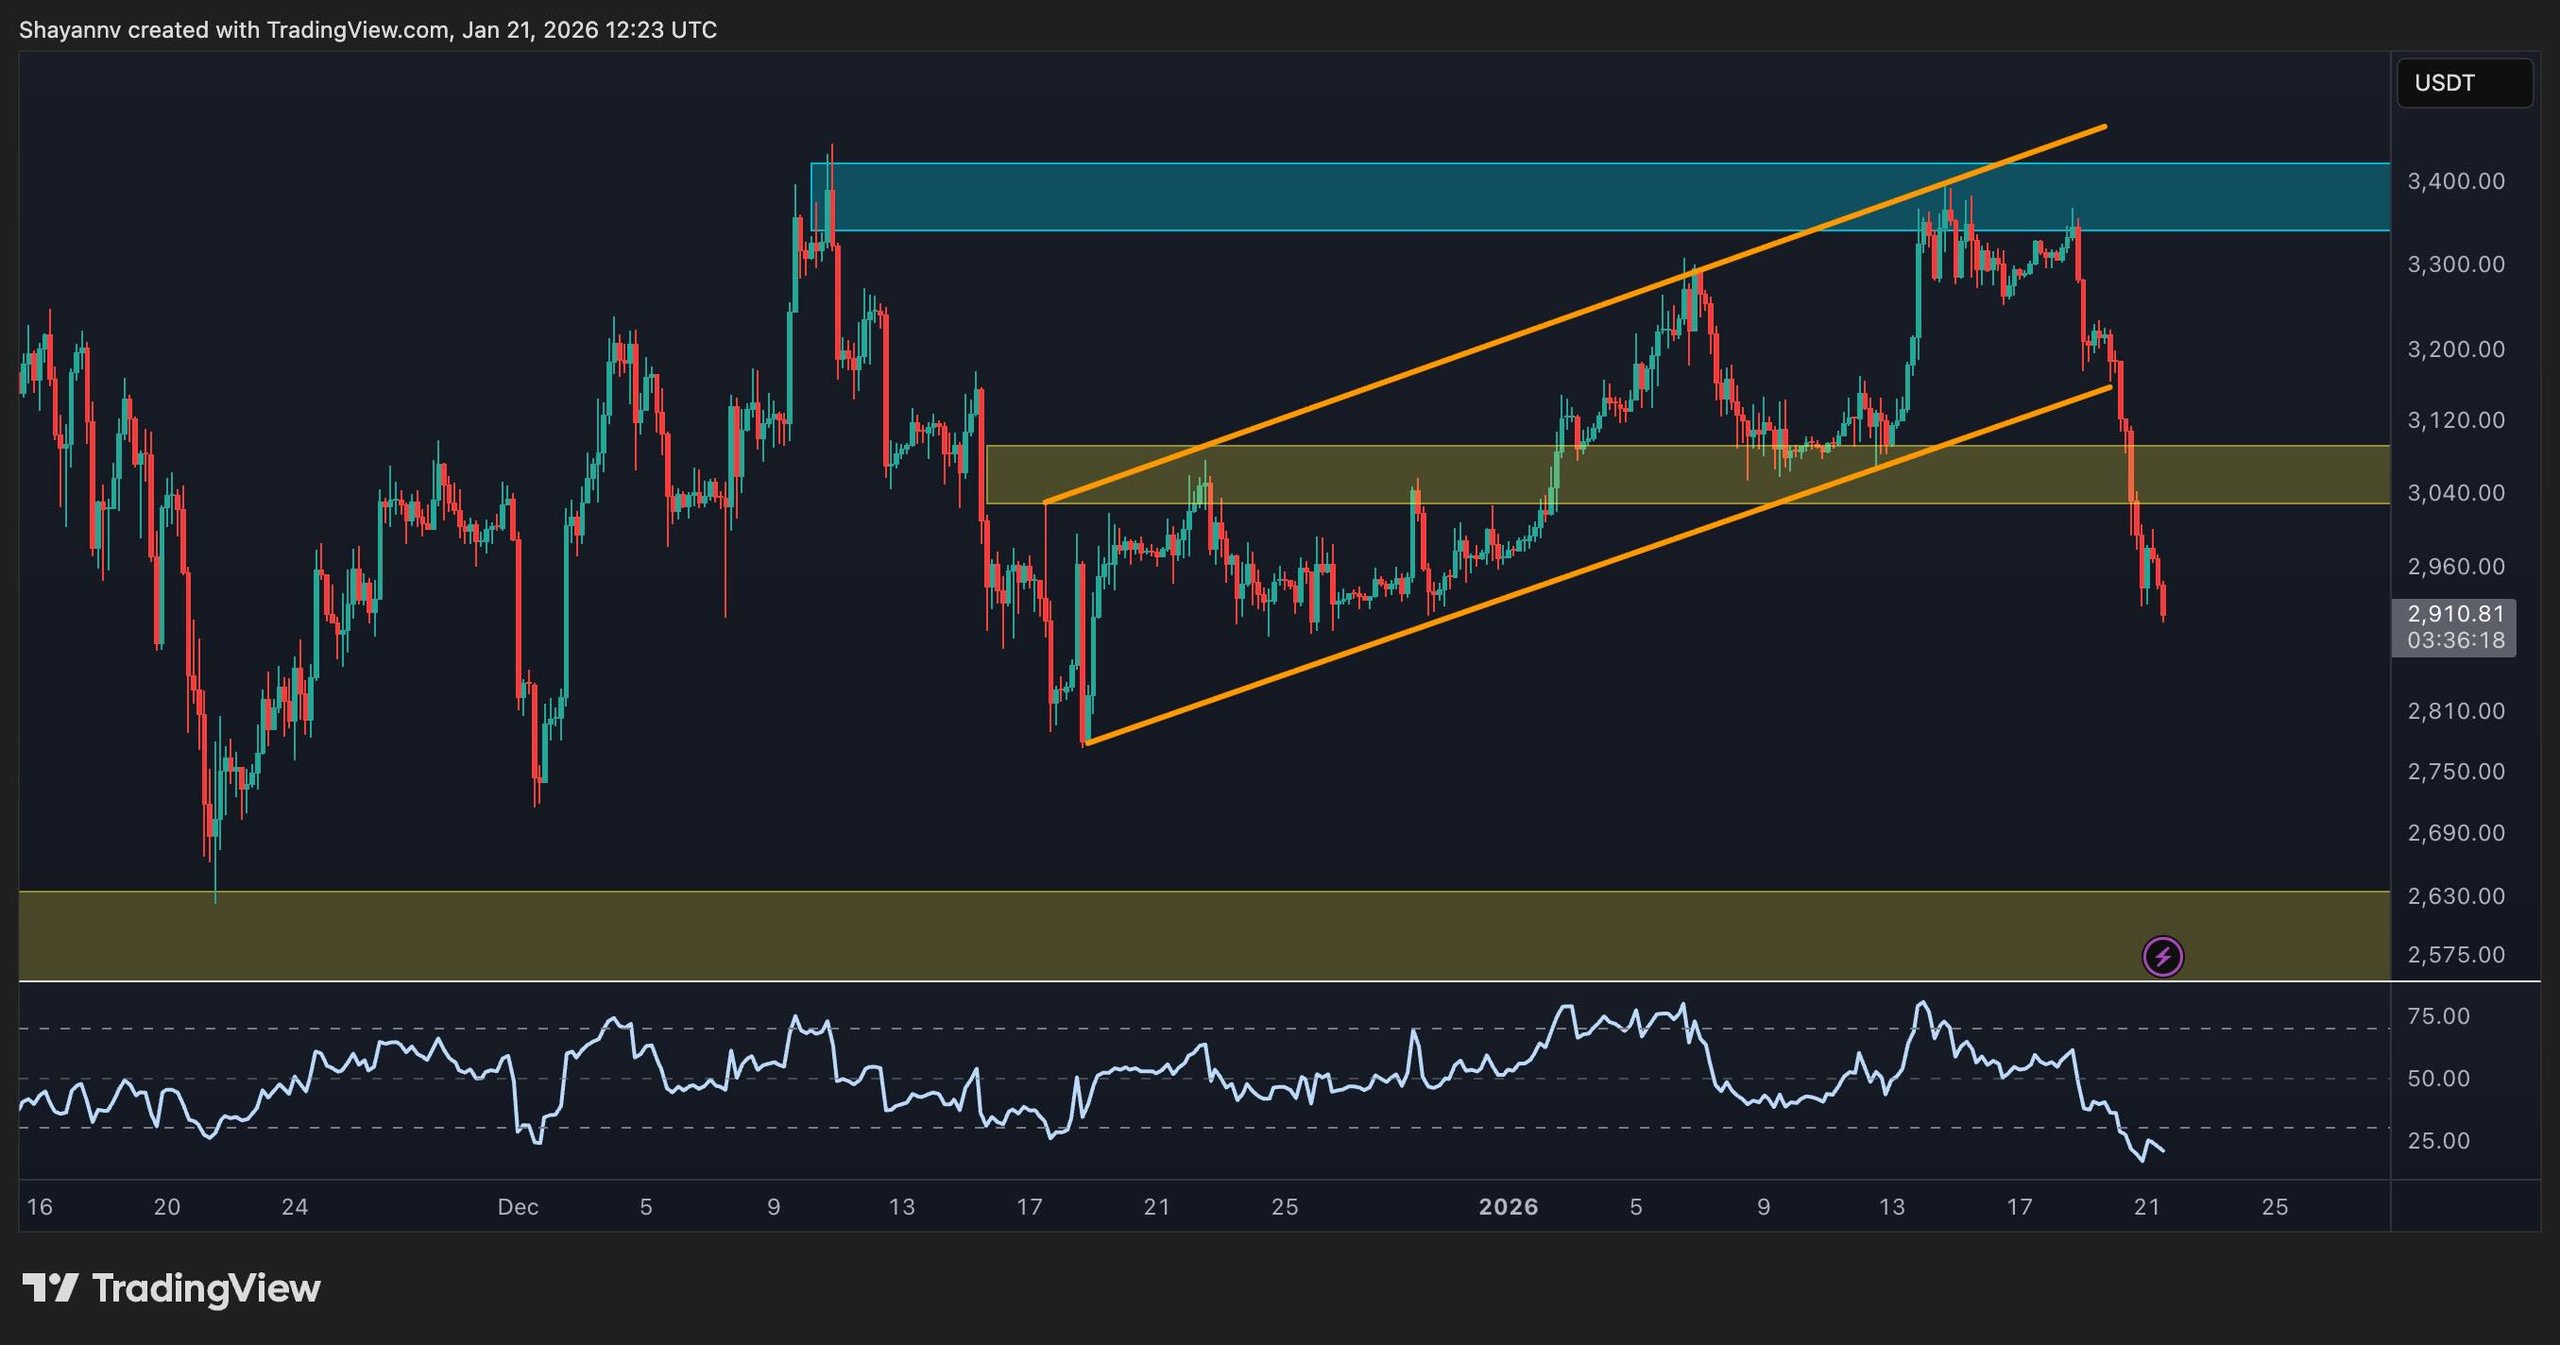
4-Hour ETH/USDT Chart
Within the 4-hour framework, a distinct breakdown is apparent from the upward channel that previously propelled prices, from late December’s lows toward the $3,400 mark. After losing support from both the channel and the intraday demand level near $3,000, ETH has quickly descended towards $2,900, with the 4-hour RSI indicating it has reached oversold conditions, yet without confirming a reversal.
As long as ETH remains under the previous channel base and $3,000, the short-term bias still appears corrective, with a probability of extending down towards the more substantial demand levels between $2,500 and $2,600. Recovery above $3,100 would be necessary to invalidate this breakdown.
 Ethereum 4-Hour Chart
On-Chain Evaluation
The exchange supply ratio for Ethereum is trending downward, now marking the lowest in years, indicating that less of the circulating supply is found on centralized platforms. This trend typically denotes a shift towards long-term storage or staking rather than immediate liquidity, effectively minimizing sell-side supplies even amid price corrections.
Although reduced exchange balances may not eliminate further downside risks soon, substantial outflows in these conditions often align with late-stage corrections within broader upward trends. Renewed demand can more rapidly lead to sharp price advances when macro factors and technical conditions become favorable again.
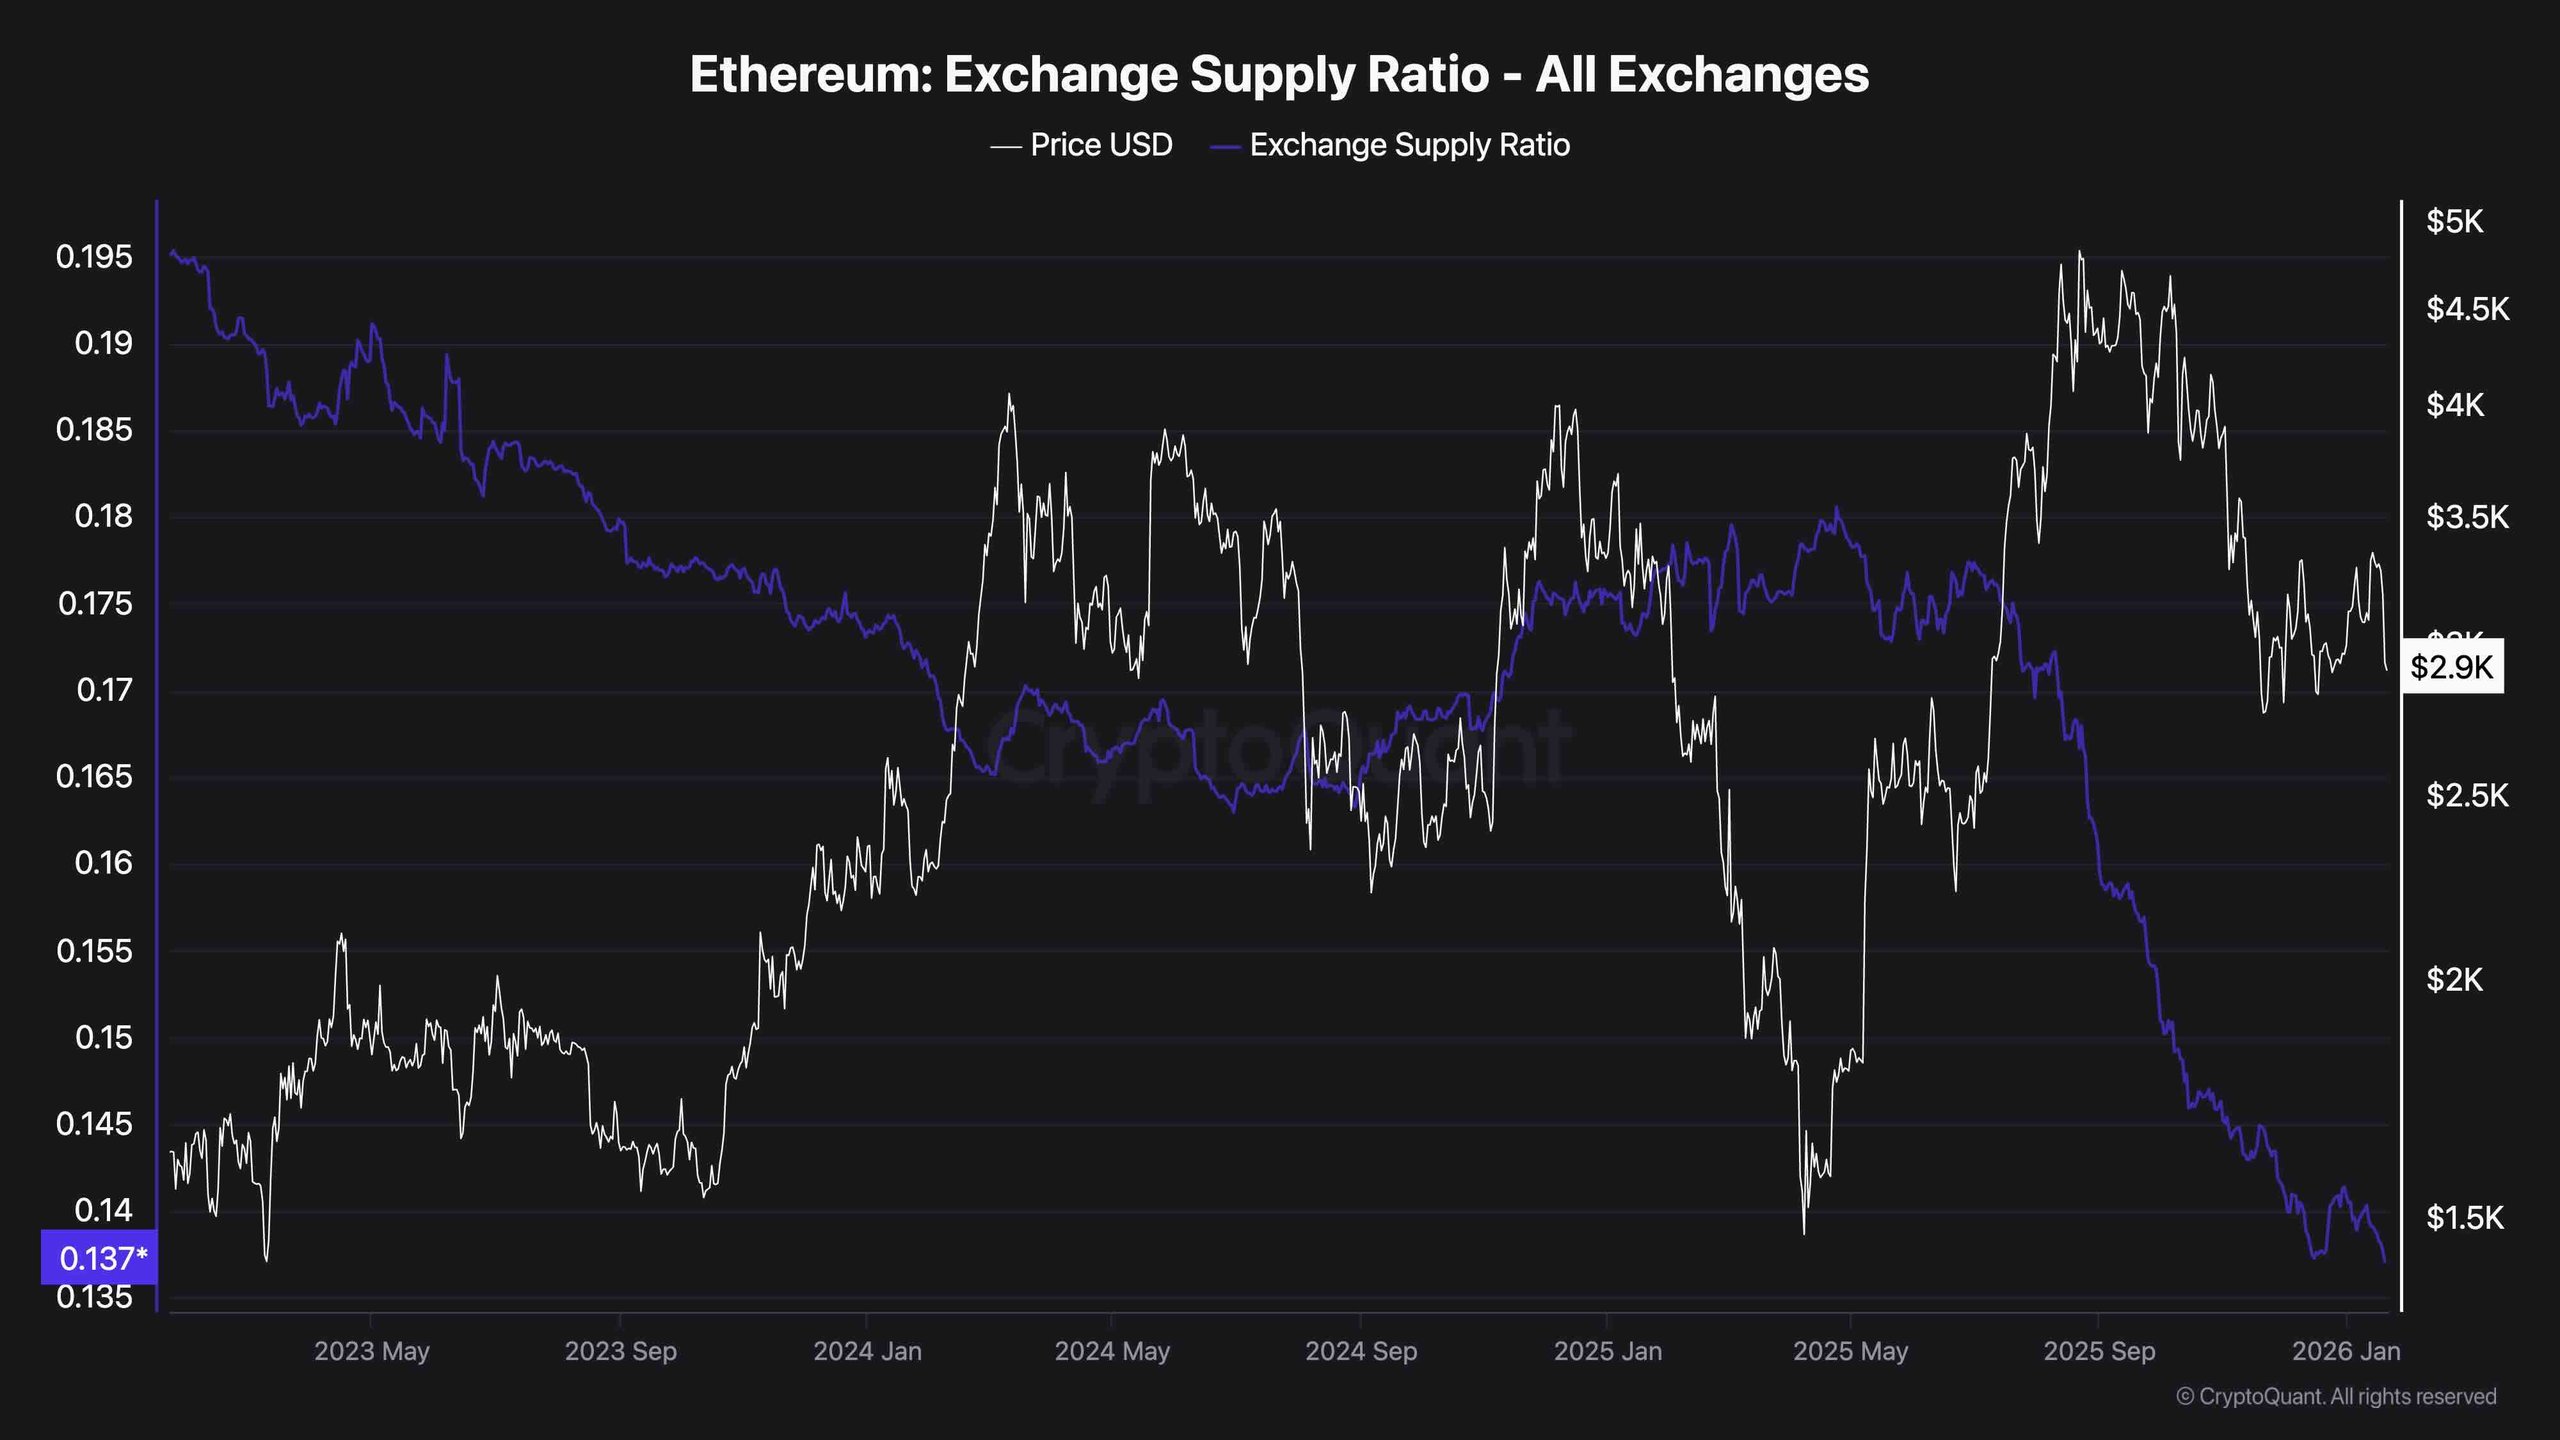 Ethereum Exchange Supply Ratio
Disclaimer: The insights provided here are based on quoted writers and do not represent CryptoPotato’s opinions on investment strategies. Conduct thorough research prior to making any investment decisions.
