


Ethereum (ETH) showcased modest advances over the past 24 hours, lifting back to the $3,000 mark. However, diminishing demand for ETH, reflected in heavy trading from Ethereum exchange-traded funds (ETFs), alongside a faltering technical framework, may bring its price below $2,000 in the weeks to come.
Key Insights:
- Reductions in Ethereum demand and negative ETF flows highlight a trend of intensive distribution.
- A bearish flag pattern for ETH points towards a target price of $1,850 should critical support be breached.
Ethereum’s Demand Hits Record Lows
Metrics indicate that a significant decline in Ethereum demand has occurred since mid-December, reaching its lowest since March 2025. Capriole Investment’s Ethereum Apparent Demand stat plummeted from over 92,000 ETH on December 13 to -3,562 ETH on January 16, before slightly recovering to 665 ETH at the current time.
Related: Funding rate turns negative, but will Ether bulls respond?
This decline in demand, coinciding with a price decrease, suggests strong distribution as it tests vital support levels, particularly around the psychological barrier of $3,000 this week.
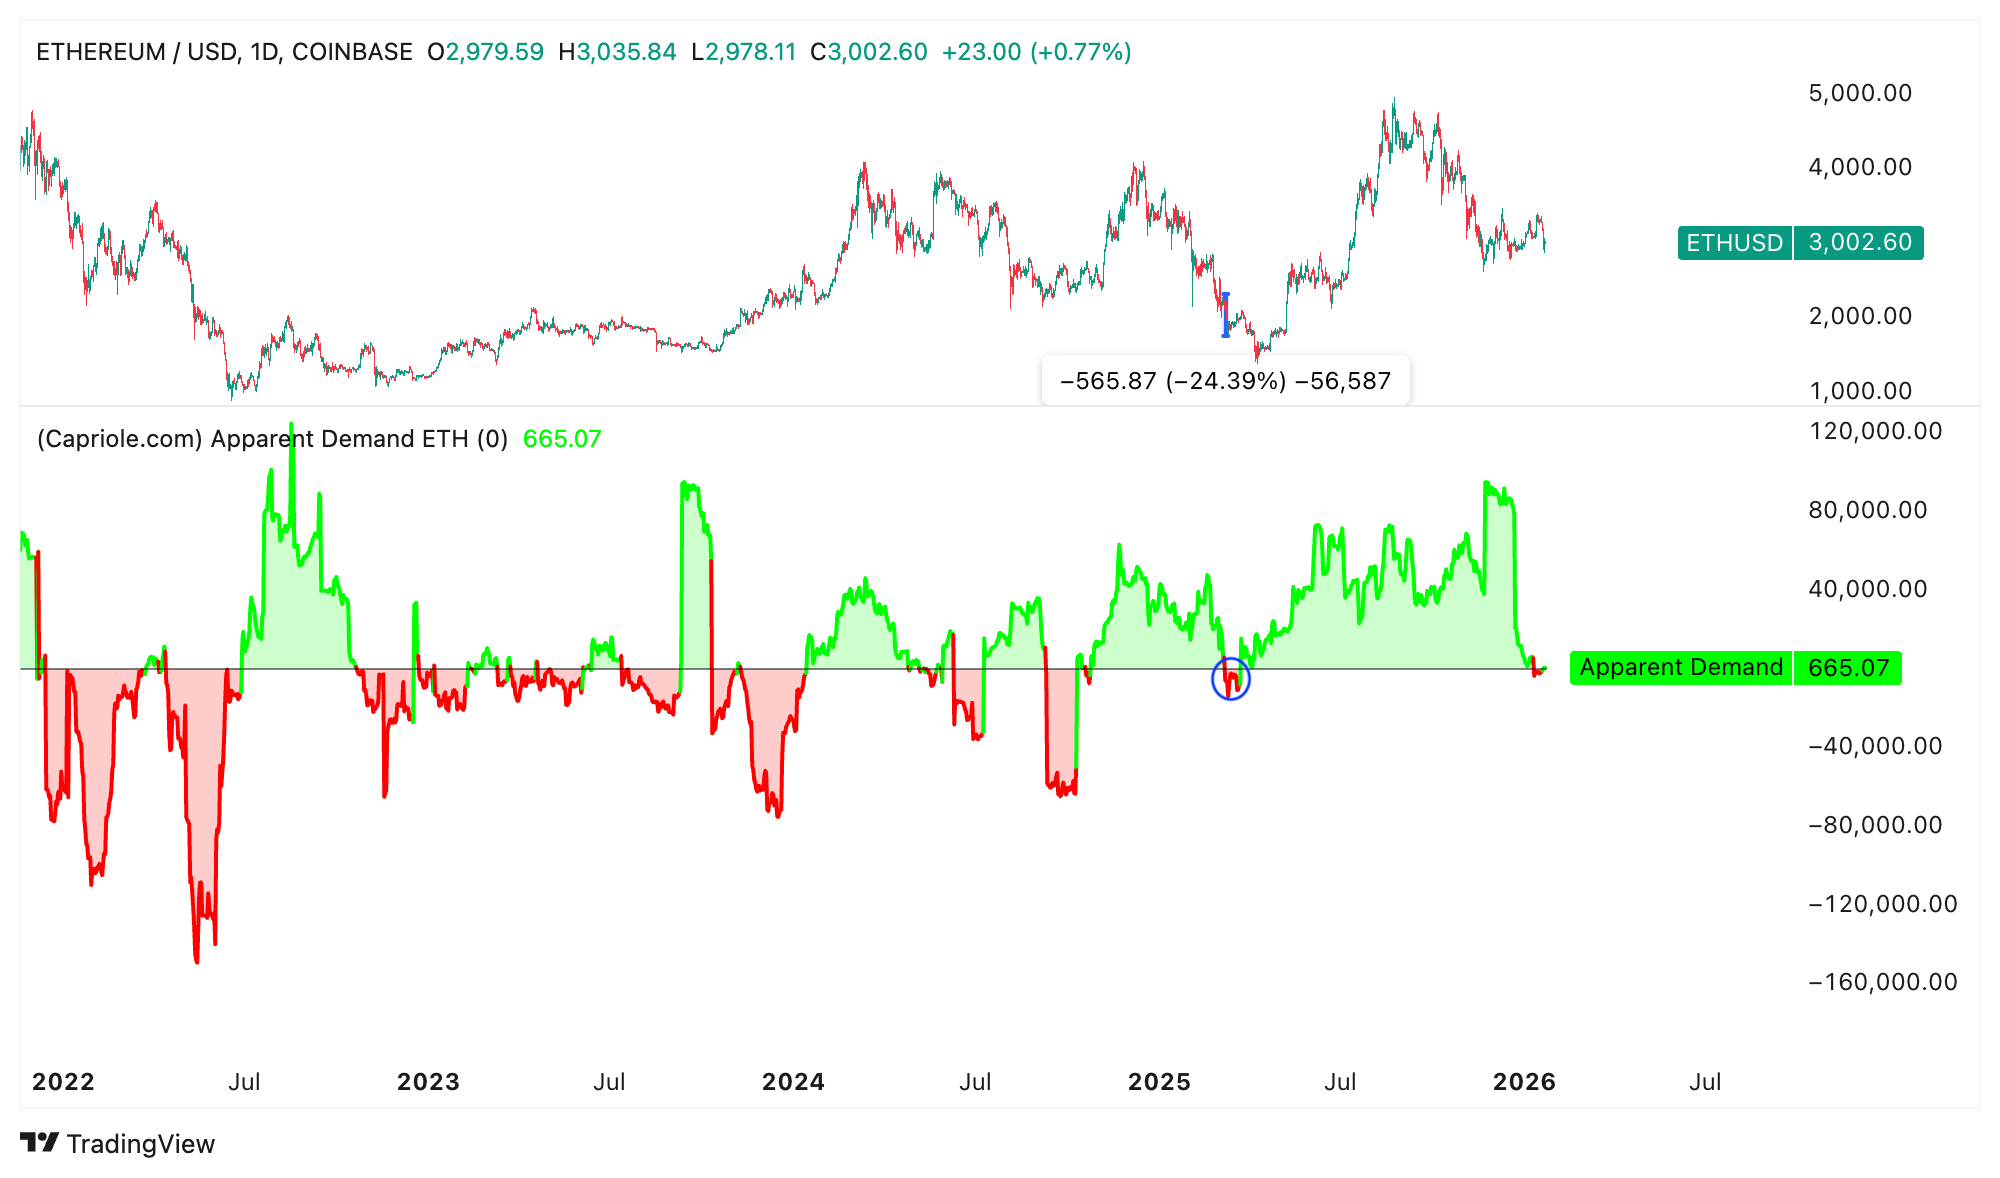 Ethereum apparent demand. Source: Capriole Investments.
Notably, the last time this demand metric was low was in March 2025, correlating with a price around $2,200. Said scenario was succeeded by a 25% drop in ETH to $1,750 shortly after.
ETH Price Needs to Maintain Above $2,800
As reported by Cointelegraph, the critical support for Ether hovers in the $2,800-$3,000 range, where around 9 million ETH was purchased over recent months. This sets up a potential support zone according to ETH’s cost basis distribution data.
Analyst Kriptoholder notes robust buying activity from larger investors around this price level as well.
The strategy of maintaining support in the $2,800 - $2,850 zones, coupled with dense buy walls in the $2,500 - $2,600 range, outlines where demand is concentrated. Kriptoholder expressed on X:
“This structure indicates precisely where institutional buyers are positioned to absorb pullbacks and target accumulation.”
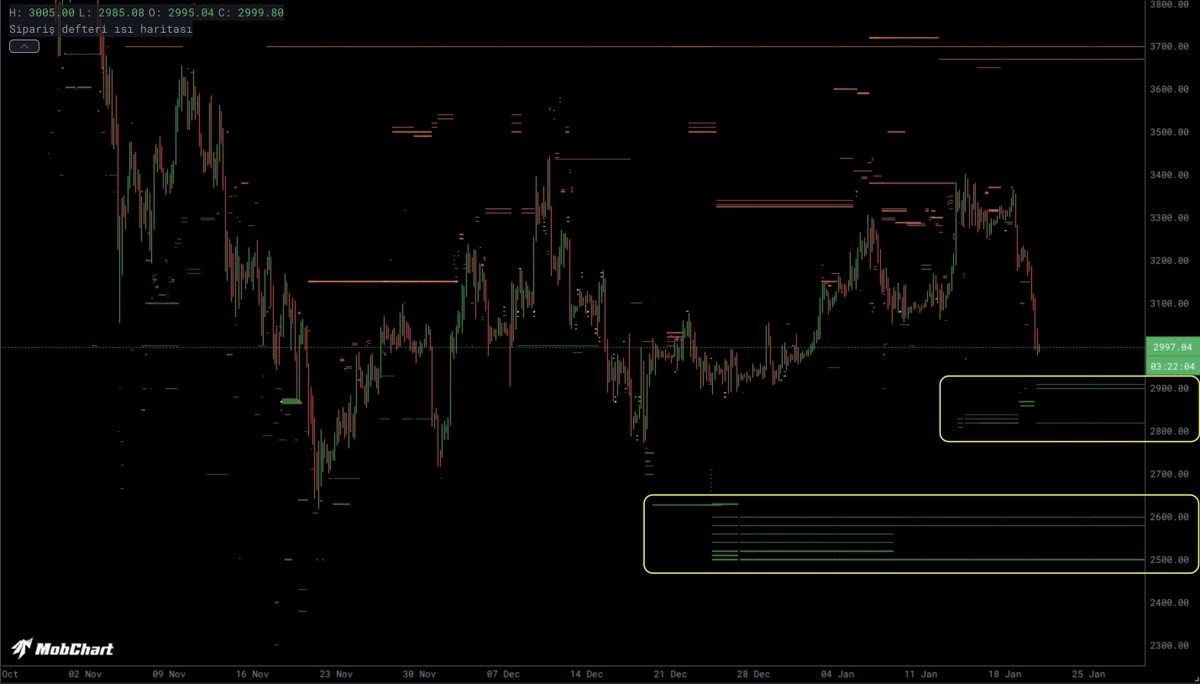 ETH order book heatmap. Source: Kriptoholder
This price level aligns with the 50-week moving average and the lower edge of a bearish flag, as depicted in the chart below.
 ETH/USD weekly chart. Source: Cointelegraph/ TradingView
Crypto investor Batman stated on X that ETH price is nearing its crucial support level, which has held steady for three months:
“If there’s an area for Ethereum to bounce back, this is it. If not, things could look grim.”
If this support fails, key price points to monitor will be the 200-day average at $2,460 and the $2,000 psychological marker.
The target for the bearish flag stands at $1,850, a potential bottom should a continued downtrend occur.
Reportedly, as long as Ether stays above $3,000, boosted by favorable network metrics and record staking demand, it could sidestep potential decline.
