
XRP's Cost-Basis Metric Signals Potential Price Decline
A bearish trend in XRP's cost-basis implies a significant price drop may be on the horizon, raising questions about the stability of its support levels.


XRP’s on-chain market structure appears to be mirroring a setup from February 2022 that led to a significant decrease in price. Here are the key points:
- XRP’s market structure reflects a setup from February 2022 that resulted in a 68% price drop.
- To avert a more severe correction towards $1.10, XRP bulls need to reclaim the $2 mark.
- Spot XRP ETFs experienced a net outflow of $53.32 million, the largest since their launch.
Previous Signals Indicating Price Decline
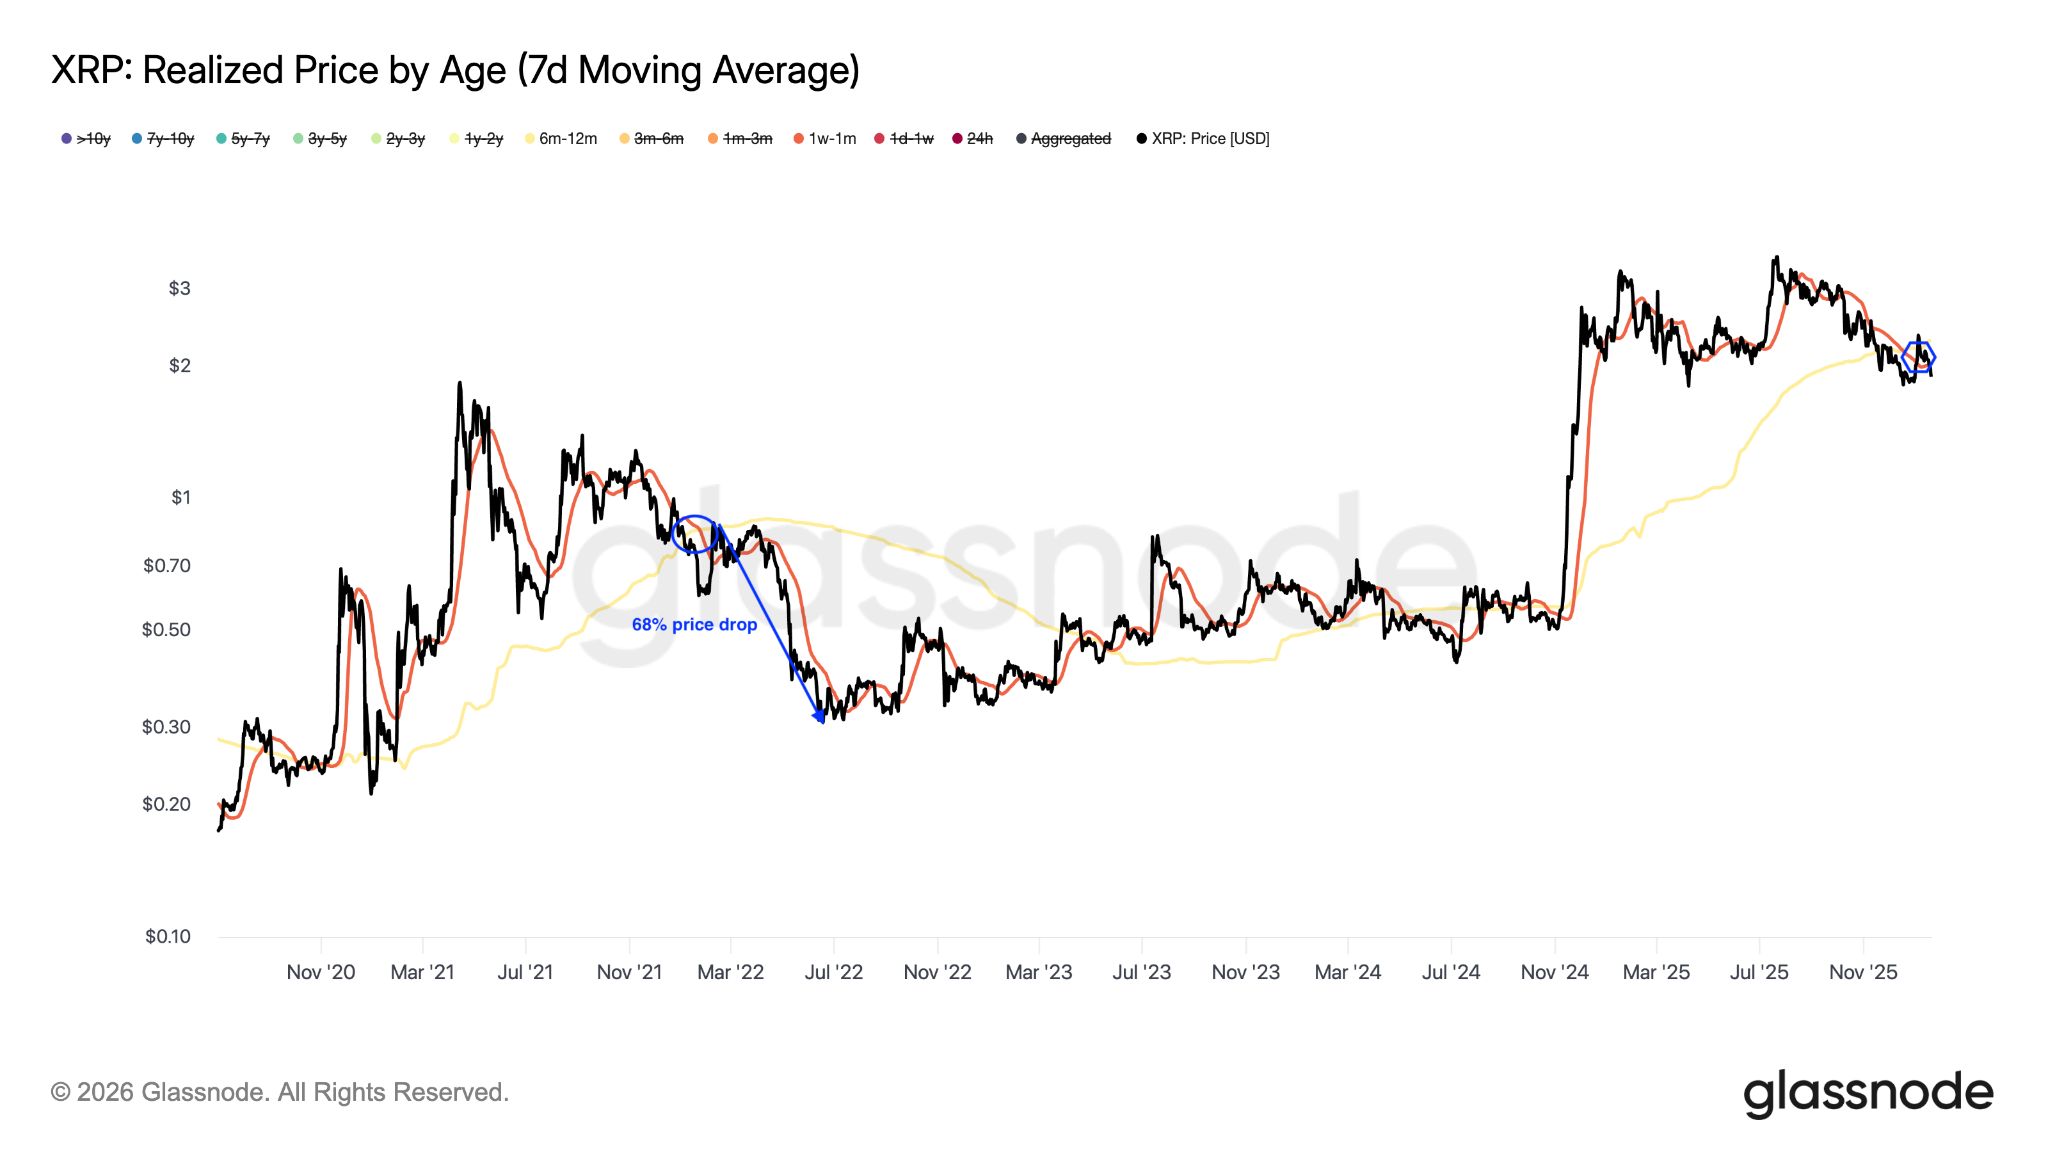
Data from Glassnode suggests that XRP’s present market structure is closely aligned with that of February 2022, which led to several months of decline. “XRP investors who were active over the past week to month are currently purchasing below the cost basis of six-month to one-year holders.” This development indicates that newer buyers are profiting while those holding mid-term are facing losses, likely resulting in mounting overhead pressure unless key support is regained.
“As this structure persists, psychological pressure on top buyers continues to build over time.”
 XRP Realized Price
XRP realized price. Source: Glassnode
A similar pattern was visible in February 2022, when XRP was valued at $0.78 and eventually fell to $0.30 by June, marking a 68% drop. If recent history is any indication, XRP might descend to around $1.40 if the support between $1.80 and $2 fails.
$2 Level: A Crucial Psychological Threshold
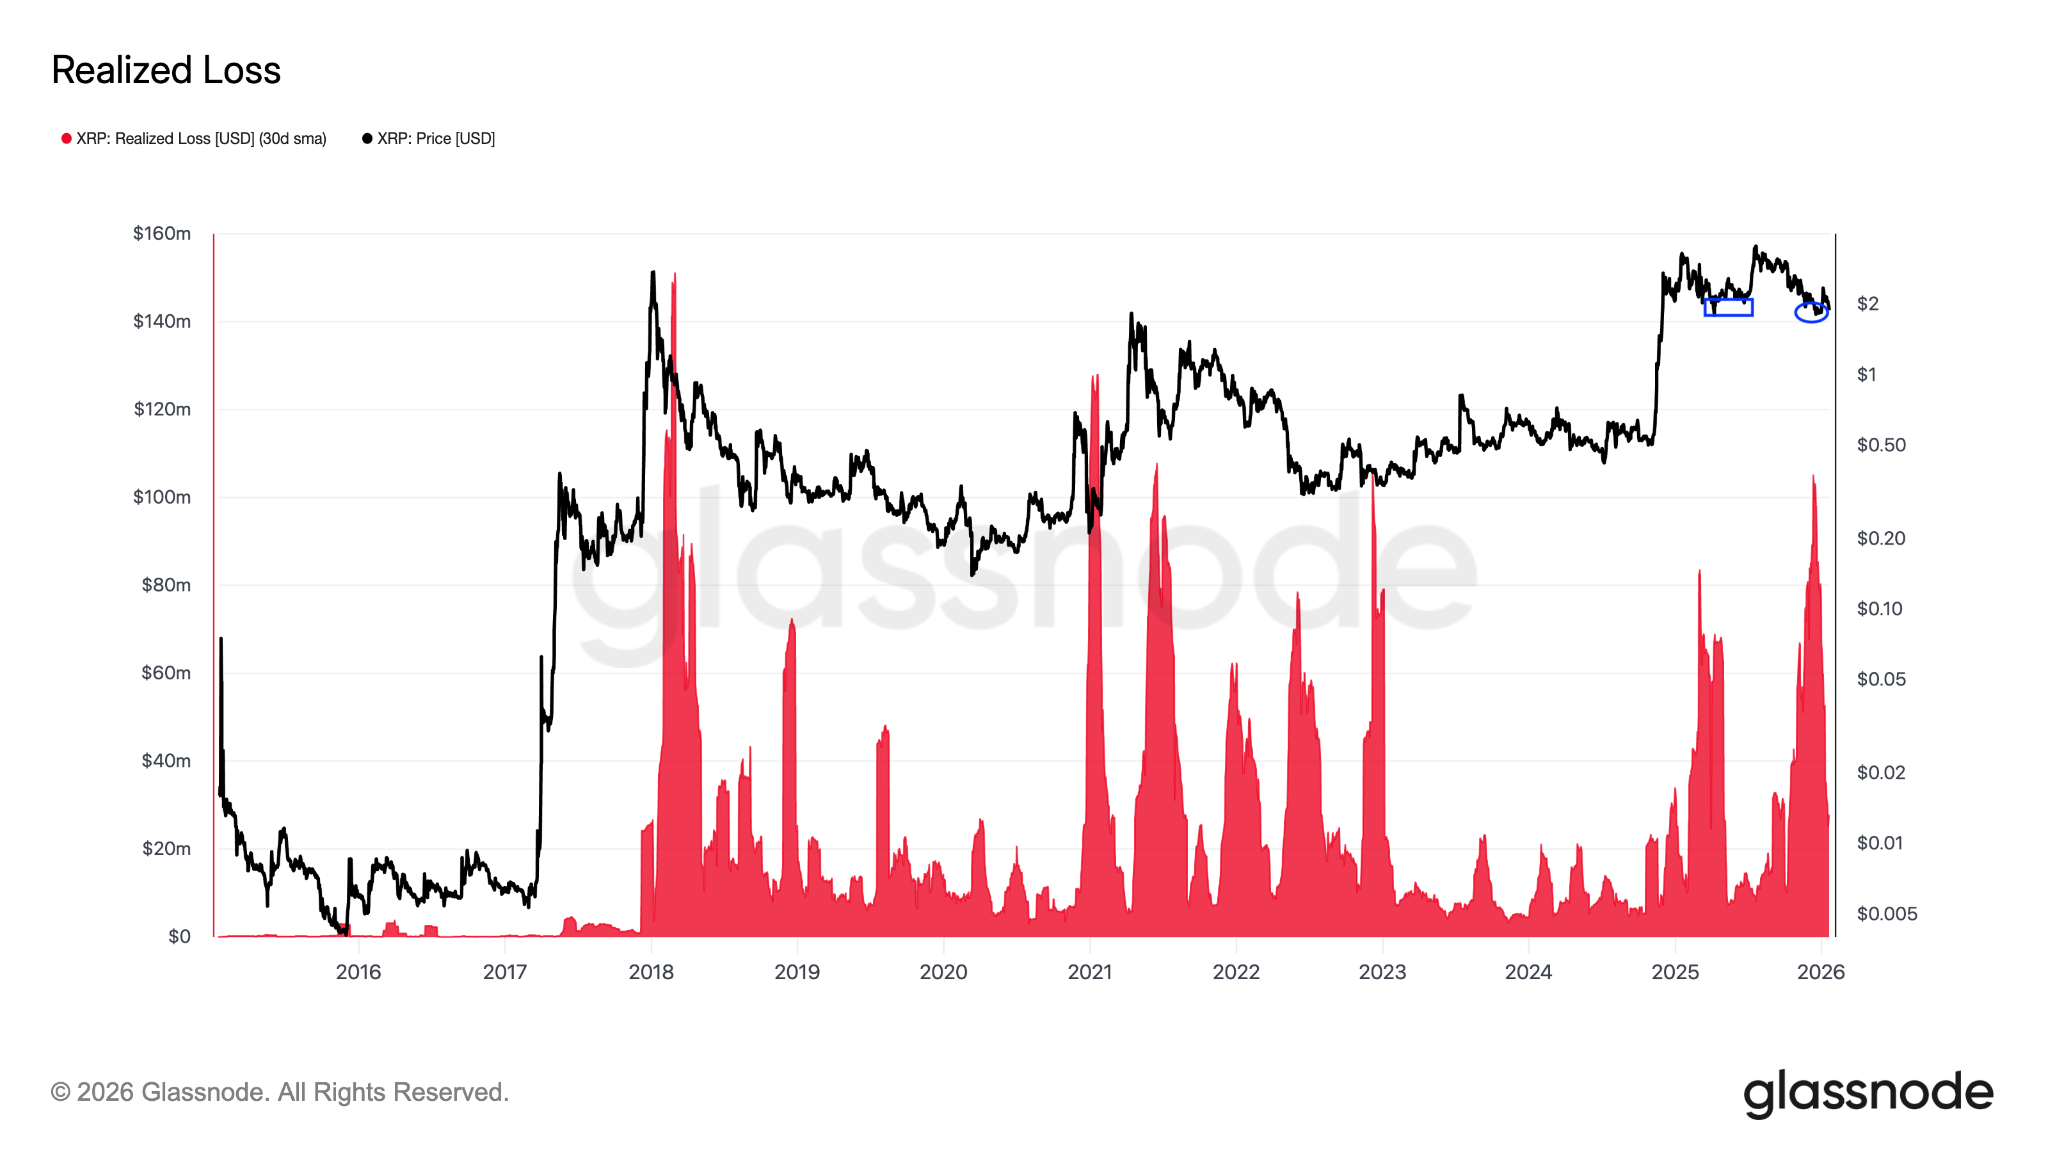
The $2 mark serves as a key psychological threshold for XRP in the short to medium-term. Previous analysis by Glassnode indicated that every retest of this level since early 2025 has involved realized losses ranging from $500 million to $1.2 billion weekly, as holders opted to exit positions to mitigate losses.
“This underscores how heavily this level influences spending behavior.”
 XRP Realized Loss
XRP realized loss. Source: Glassnode
When prices dip below this critical threshold, pressures build on holders who purchased at higher levels, while newer buyers are accumulating at lower prices. A fractal from 2022 emphasizes the significance of this support level, suggesting that failure to reclaim this might lead to a larger price correction.
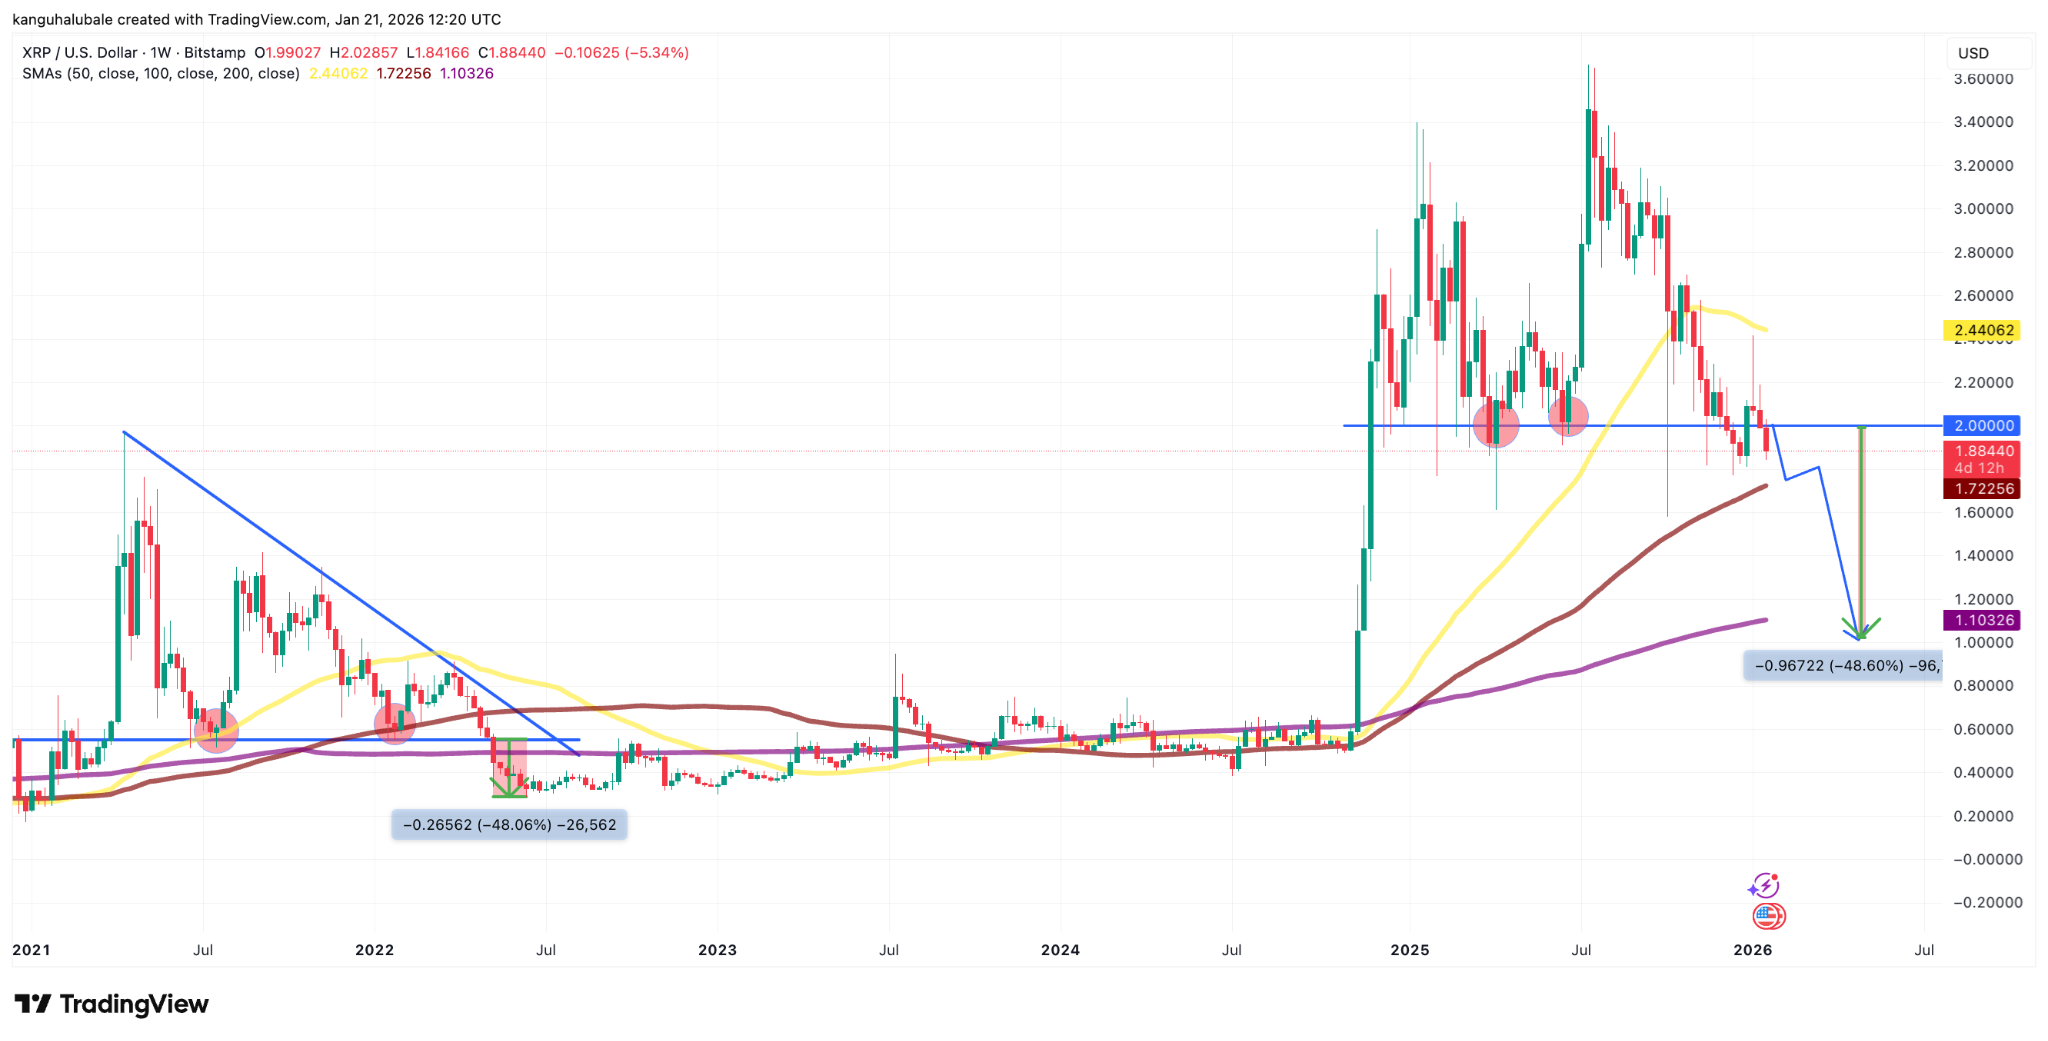
In early analyses, a different critical support level at $0.55 was noted, which held the price from April 2021 until May 2022 before breaking and causing a 48% decline to $0.28.
Breaking below the $2 support might trigger a similar drop, possibly bottoming near the 200-week moving average at $1.03, akin to what occurred in 2022.
 XRP/USD Weekly Chart
XRP/USD weekly chart. Source: Cointelegraph/
As previously reported, XRP’s descent beneath the 50-day simple moving average at $2 indicates a return of bearish sentiment, with risks extending down to $1.25.
XRP ETFs Experience Significant Outflows
On Tuesday, spot XRP ETFs marked their second consecutive day of outflows since their introduction, amounting to $53 million, surpassing a prior outflow day of $40 million on January 7. These outflows indicate a cautious stance among institutional investors or potential profit-taking amid wider market weakness, contributing to increased selling pressure.
 Spot XRP ETF Flows Chart
Spot XRP ETF flows chart. Source: SoSoValue
This article does not provide investment advice. All investments carry risks, and readers should research independently before making decisions. Cointelegraph aims to deliver accurate and timely information but does not assure the reliability or completeness of any details shared.
