Ethereum's Price Outlook: Analyzing Support Levels Amid Market Adjustments
This article examines Ethereum's recent price movements and the critical support levels amid a bearish trend.


Ethereum is currently in a corrective and range-bound phase, struggling to maintain its momentum above the mid-$3,000 levels. The price movement is fluctuating between a significant demand zone near $2,700 and a supply range around $3,500, with crucial moving averages acting as resistance.
This situation indicates a lack of directional conviction and underscores the importance of support reactions during this pullback.
Ethereum Price Analysis: Daily Chart
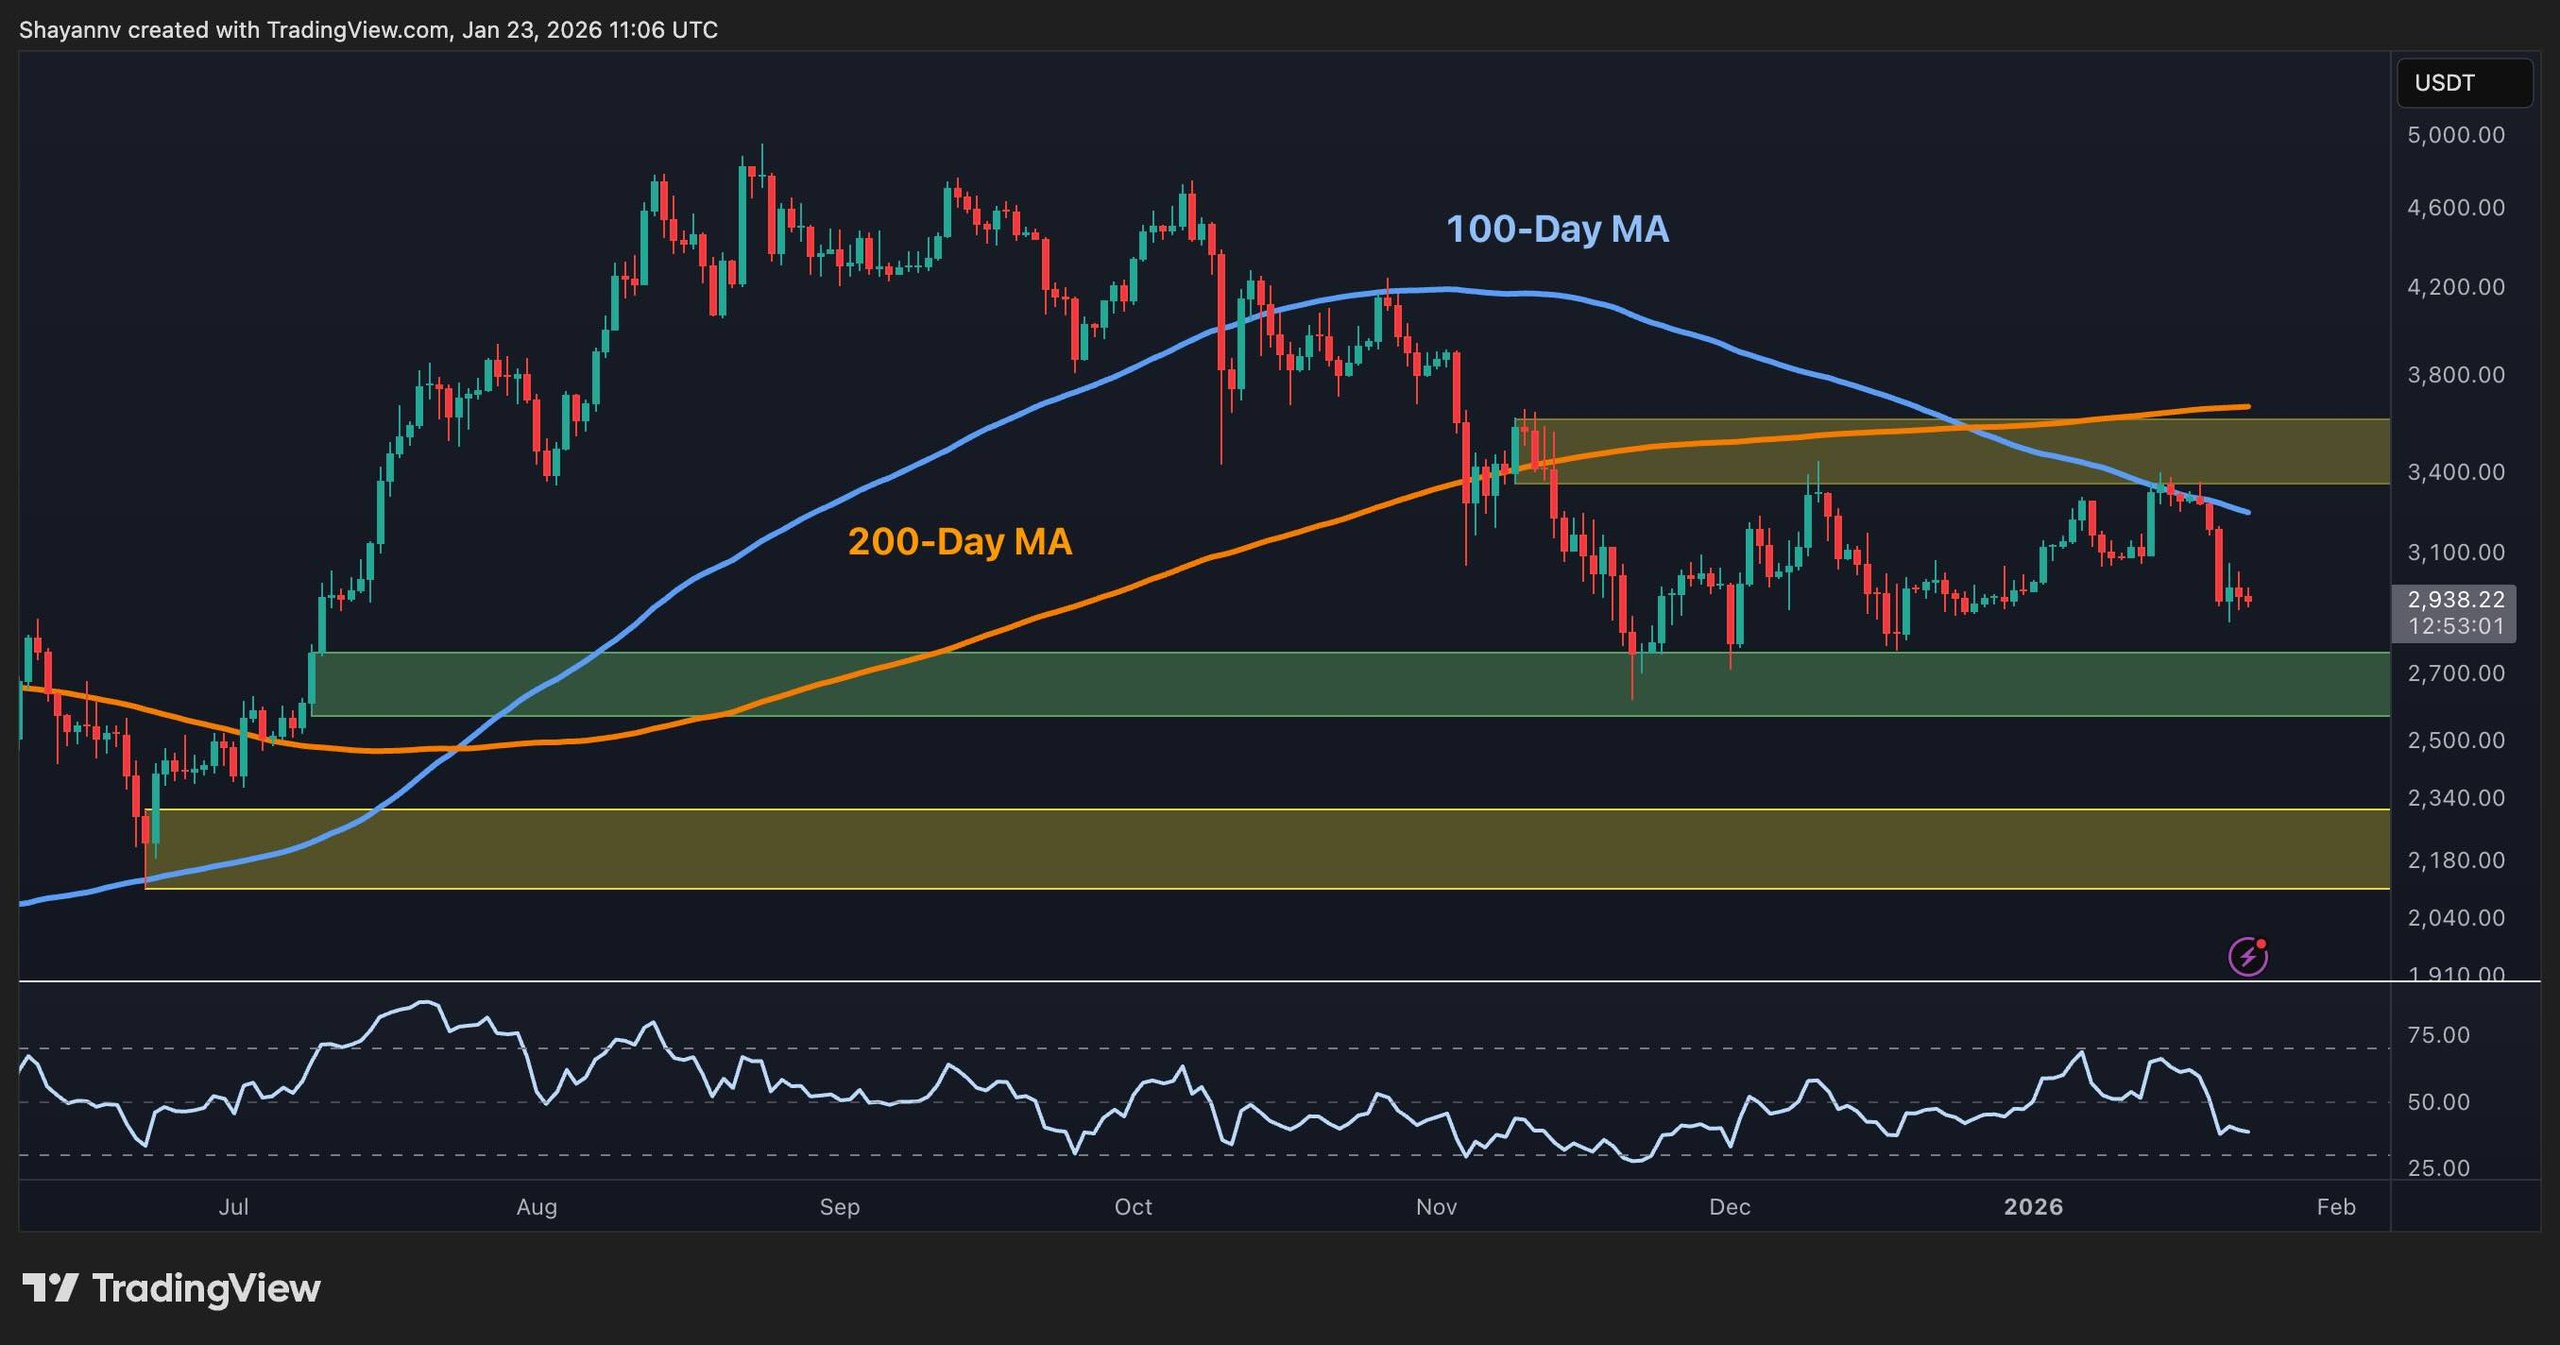
On the daily chart, ETH was rejected again from the resistance around $3,500 and the declining 100-day moving average, while the 200-day moving average is still higher at about $3,800. The drop below the 100-day average suggests the ongoing trend is corrective rather than bullish. A sustained hold above the $2,700 area is critical; failing to do so could lead to a deeper price correction toward the $2,200 level.
ETH/USDT 4-Hour Chart
The 4-hour chart indicates a clear breakdown from the previous uptrend that lifted prices from roughly $2,800 to a peak around $3,400. With the local support levels at $3,000–$3,100 lost, ETH is currently on a downtrend marked by lower highs and lows. The key level to watch is around the breakdown area of $3,000–$3,100. A recovery above this could ignite a path back to $3,400, while rejection here may push prices toward $2,900 or the $2,600–$2,700 demand area.

Sentiment Analysis
Recently, the Coinbase Premium Index for Ethereum has turned significantly negative, signifying a trend where prices on Coinbase are trading at a discount to those on Binance. This situation suggests reduced buy interest from U.S. investors and often corresponds with distribution phases. While lower premiums could lead to a rebound as weaker hands exit, the current discount supports the notion that the ongoing downturn stems from technical resistance and a cautious disposition among U.S. investors.

For more information, use this data at your own risk after conducting necessary research.
