Ethereum (ETH) Reversal Pattern Suggests a Rally to $3.6K Soon
Ethereum is forming a diamond pattern around $2.9K as whales accumulate, indicating a potential rally towards $3,600.


Ethereum (ETH) is currently trading near $2,900, reflecting a daily decline of over 3%. In the last week, it has dropped nearly 12%, dipping below the crucial $3,000 threshold.
Despite this short-term weakness, patterns in the charts and the actions of significant holders are igniting interest in a possible rebound toward $3,600.
Diamond Formation on Lower Time Frame
A chart released by analyst Bryant shows a diamond formation on Ethereum’s 1-hour chart. Following a clear downtrend, the price has entered a tight range of $2,900 to $2,985, and this shape, often associated with reversals, is garnering attention as the asset continues to consolidate within this range.
This diamond pattern rests within a demand zone, a region where previous buying activity suggests interest. If ETH surpasses its upper boundary, a movement to $3,600 could follow. The analyst emphasized that it’s their first time identifying such a structure, recommending cautious interpretation.
On the broader monthly chart, Ethereum illustrates a larger trend spanning several years. Analyst Trader Tardigrade highlighted a completed double bottom pattern, noting that ETH has recently crossed above the neckline. This formation signals a recovery that commenced after the lows of 2022 and could pave the way for prolonged upward movement if momentum gathers.
Twitter: A tweet from Trader Tardigrade — “$ETH/monthly - Double bottom pattern with a brewing smaller inverse head and shoulders. 💥 This is super bullish for #Ethereum 🔥 pic.twitter.com/3748O73Zcb”
An inverse head-and-shoulders pattern also developed within this second bottom, featuring the traditional left shoulder, head, and right shoulder arrangement. These patterns are commonly observed in markets as potential indicators of trend reversals.
Current Pressure Below Key Trend Level
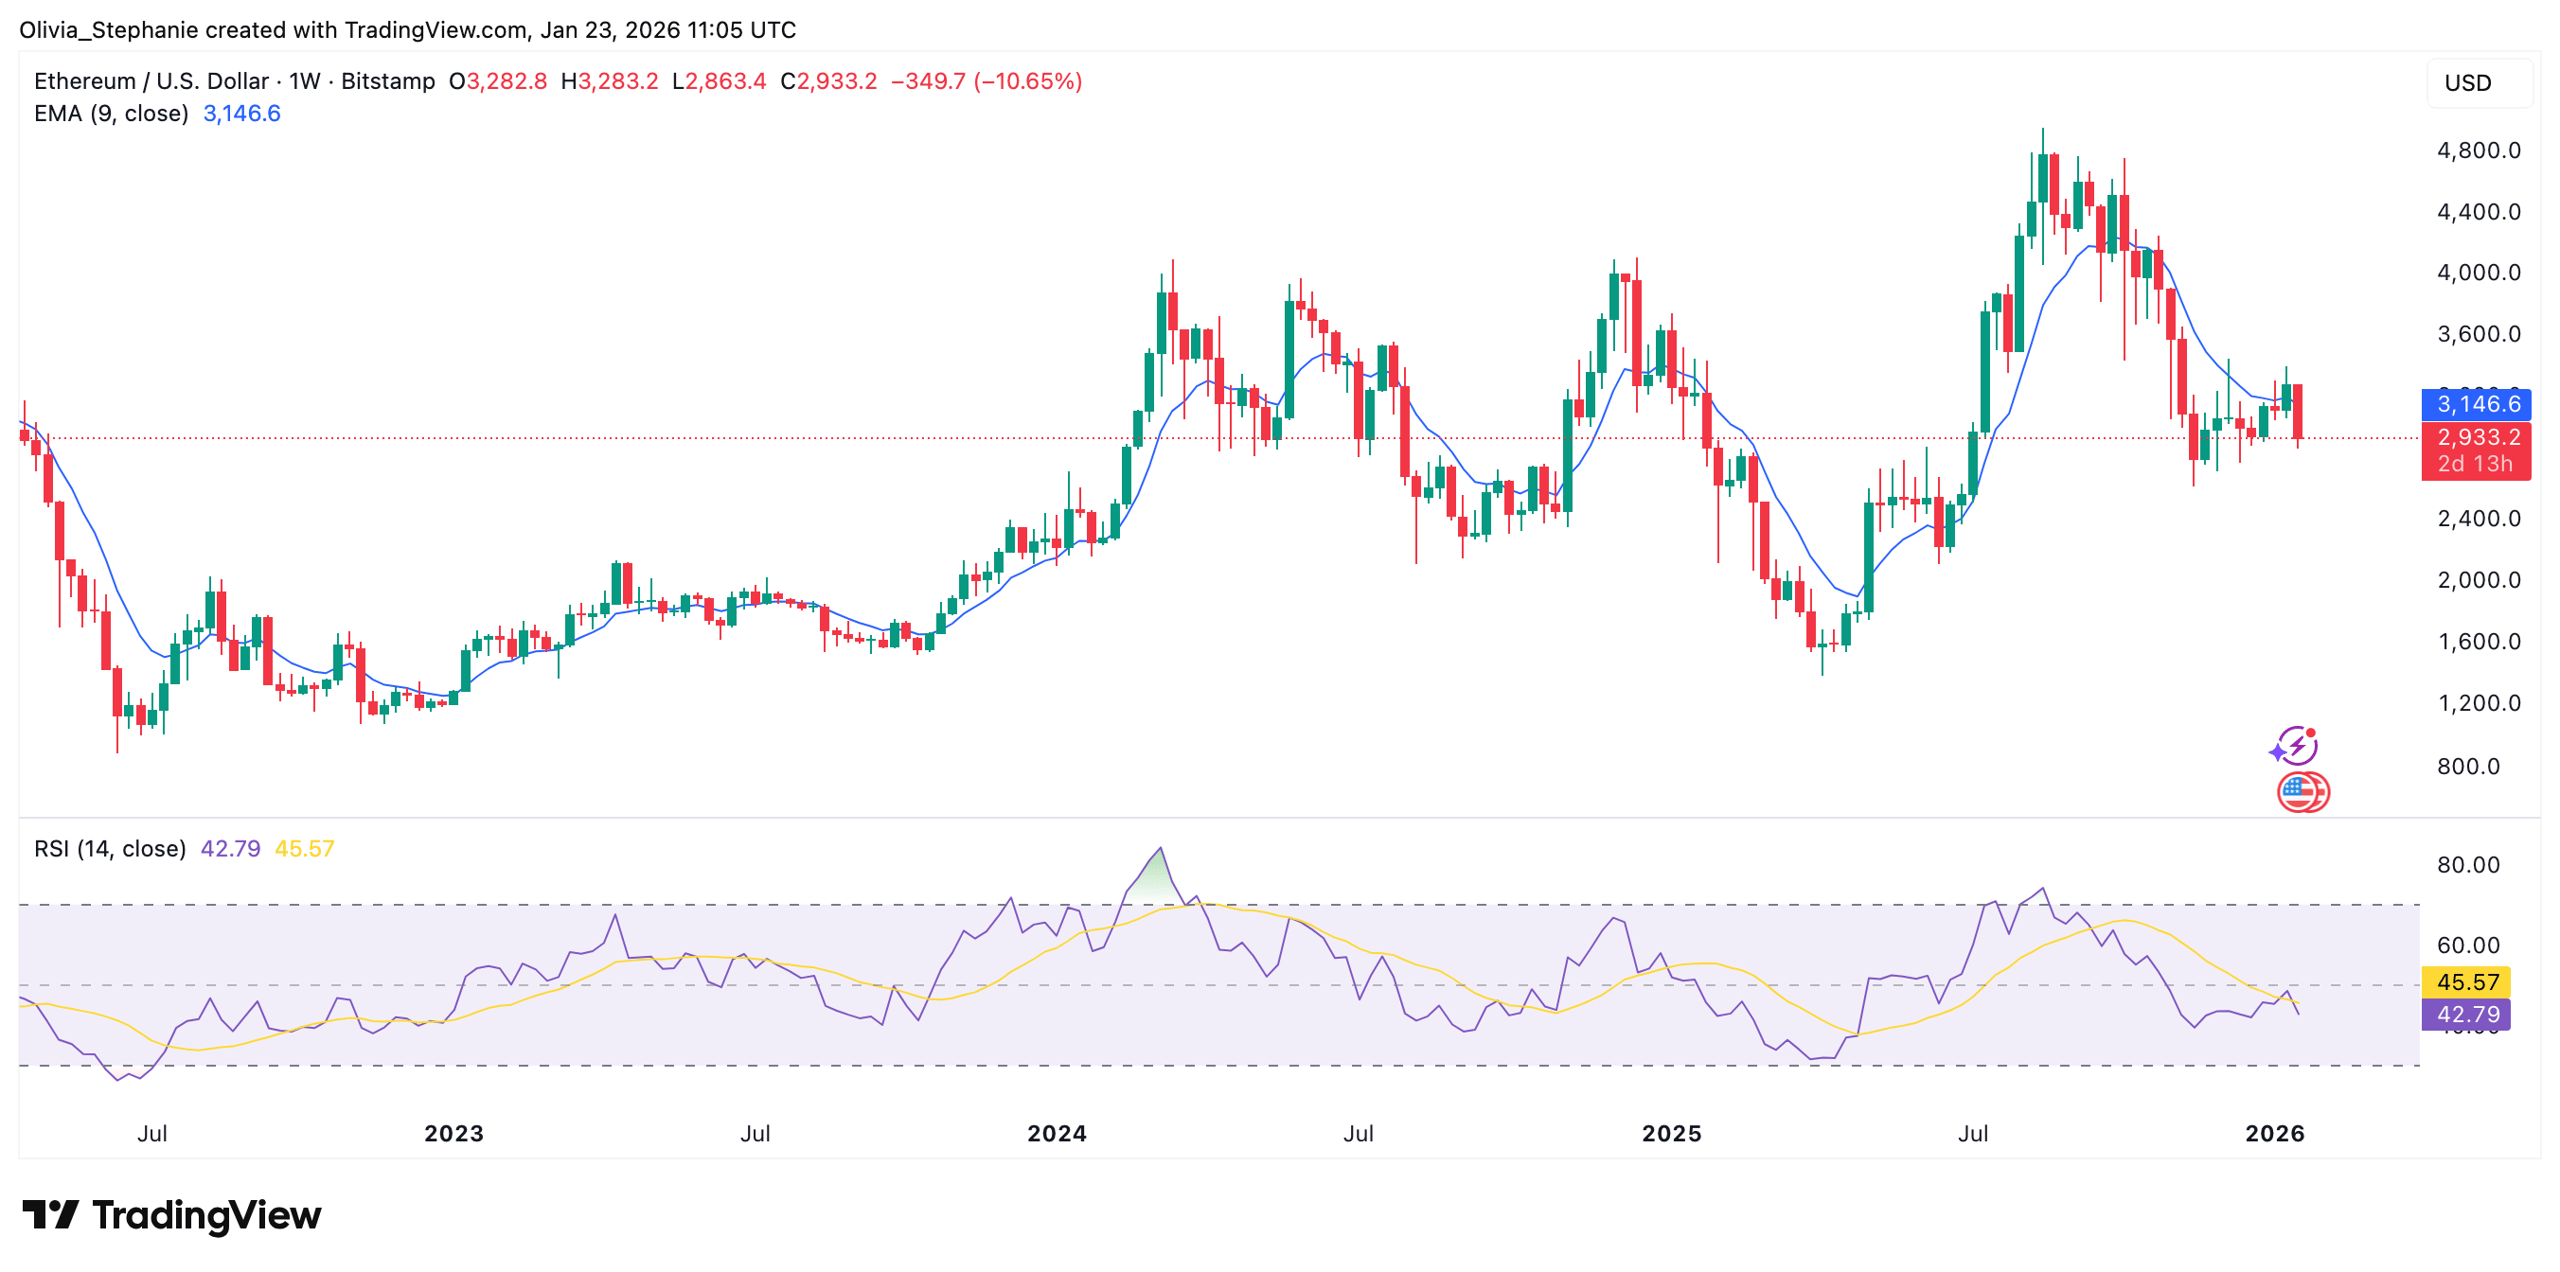
Currently, ETH remains beneath the 9-week exponential moving average, which hovers around $3,150. Staying under this level implies that the short-term trend is still under pressure, necessitating a reclaim of this line for momentum to return.
Ethereum (ETH) Price Chart
The Relative Strength Index (RSI) is positioned at 43, remaining below the 50 mark. It has also slipped under its signal line, indicating weak buying power. Presently, no divergence is noticeable, but the RSI is approaching levels historically aligned with short-term price floors.
Continuous Accumulation Despite Weak Pricing
Major holders are increasing their ETH positions via OTC channels. A significant address recently acquired over 20,000 ETH, approximating a $59 million investment. Though this activity has yet to significantly influence the market, it contributes to a larger trend of quiet accumulation.
As reported by CryptoPotato, on-chain metrics indicate the realized price of assets held in accumulation wallets now closely aligns with the current market value. This suggests that while the pricing appears weak, stronger investors continue to position themselves discreetly.
