Bitcoin Price Outlook: BTC Faces Challenges After 7% Weekly Drop Below $90,000
An analysis of Bitcoin's recent price behavior following a significant weekly decline, looking at potential future movements and market dynamics.


Bitcoin is currently undergoing a correction, having struggled to maintain a breakout above the mid-$90,000 levels. The latest fluctuations suggest a pullback rather than a definitive trend reversal. Key moving averages and supply zones have influenced the immediate risk balance, pointing towards further consolidation or potential declines before a new uptrend can be anticipated.
Bitcoin Price Analysis: Daily Chart
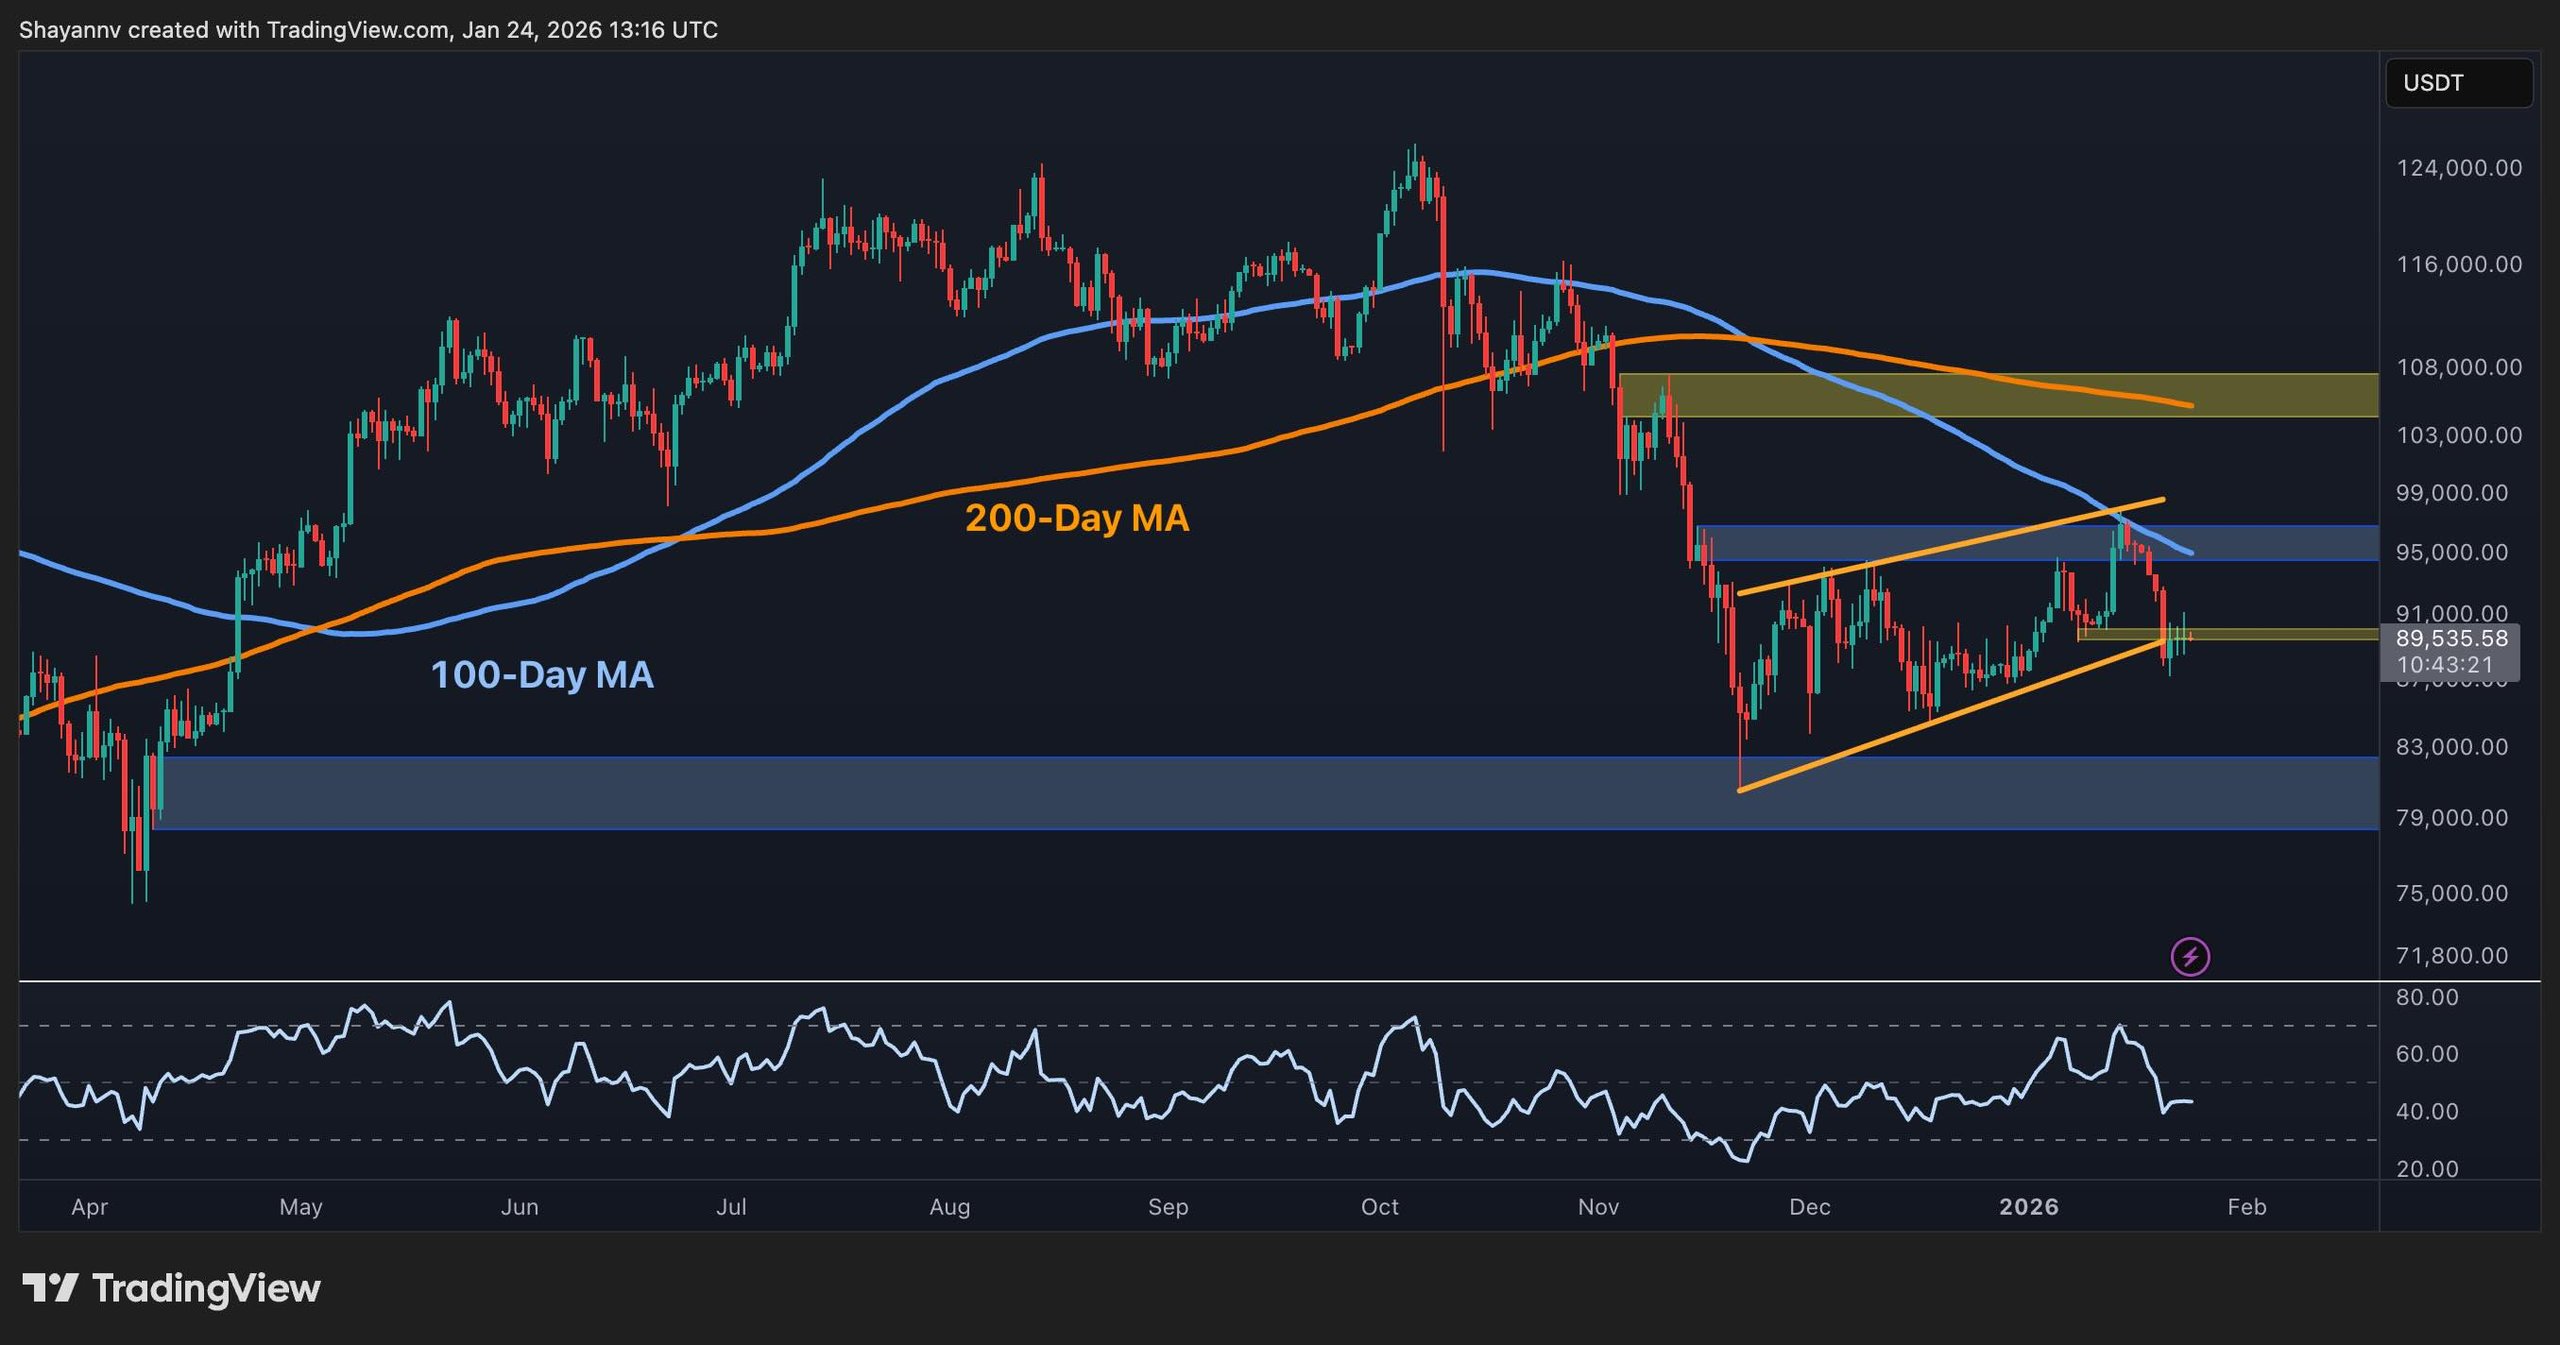
The daily chart reveals that the cryptocurrency has retracted from the resistance around $95,000, coinciding with the 100-day moving average’s underside, and well below the declining 200-day average. The previous ascending wedge formed from the $82,000 demand area has recently collapsed, with Bitcoin trading near essential breakout and local support zones around $89,000-$90,000.
As long as Bitcoin’s price remains below the 100-day moving average and fails to regain its previous wedge structure, market conditions are likely to oscillate between the $82,000-$84,000 demand zone and the $95,000-$97,000 supply area, with increasing risks that price might test the lower boundary again.
BTC Daily Chart
BTC/USDT 4-Hour Chart
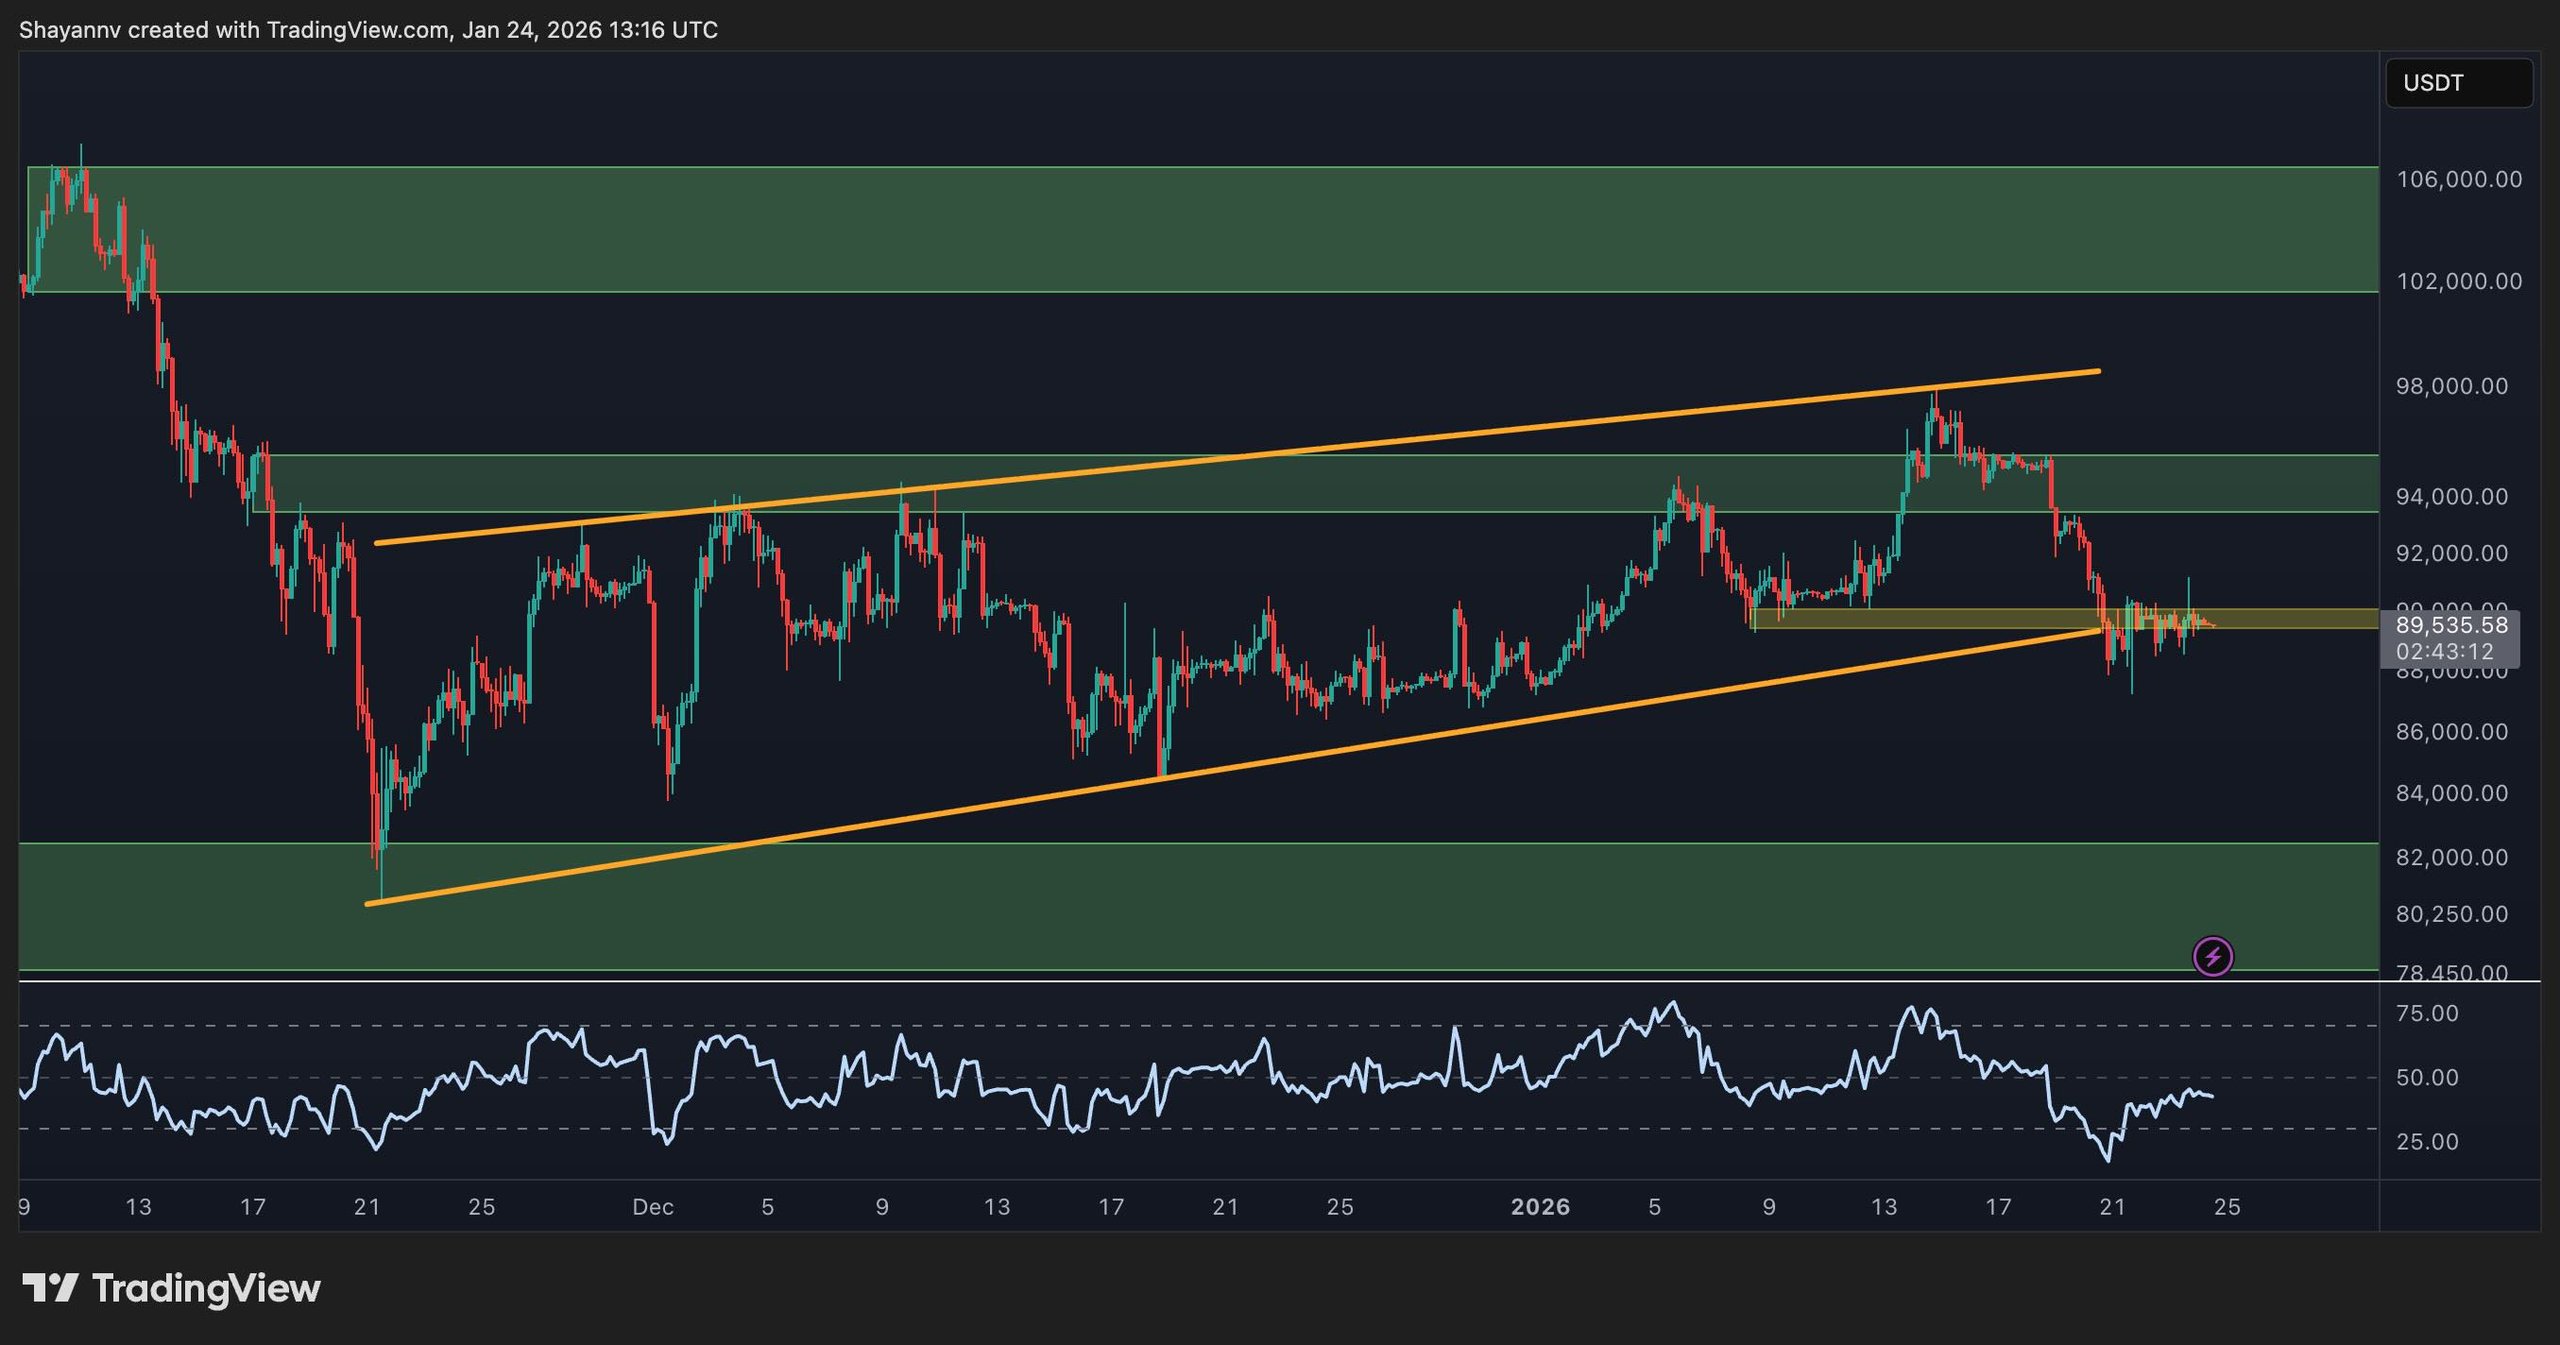
The 4-hour chart illustrates the breakdown from the upward channel that supported the price climb from approximately $84,000 to the recent high of $96,000. After losing it along with the $90,000 intraday pivot, a tentative support has been established near $88,000–$89,000, which aligns with the start of the latest upward movement.
Momentum indicators on the 4-hour RSI have shown a recovery from oversold conditions, yet they remain below previous highs, indicating only a temporary correction within a short downtrend. A sustained recovery above $92,000 could lead to a retest of $95,000, while failing to hold $88,000–$89,000 may heighten the likelihood of a move towards the $82,000 daily demand area, or even lower.
 BTC 4-Hour Chart
On-Chain Analysis
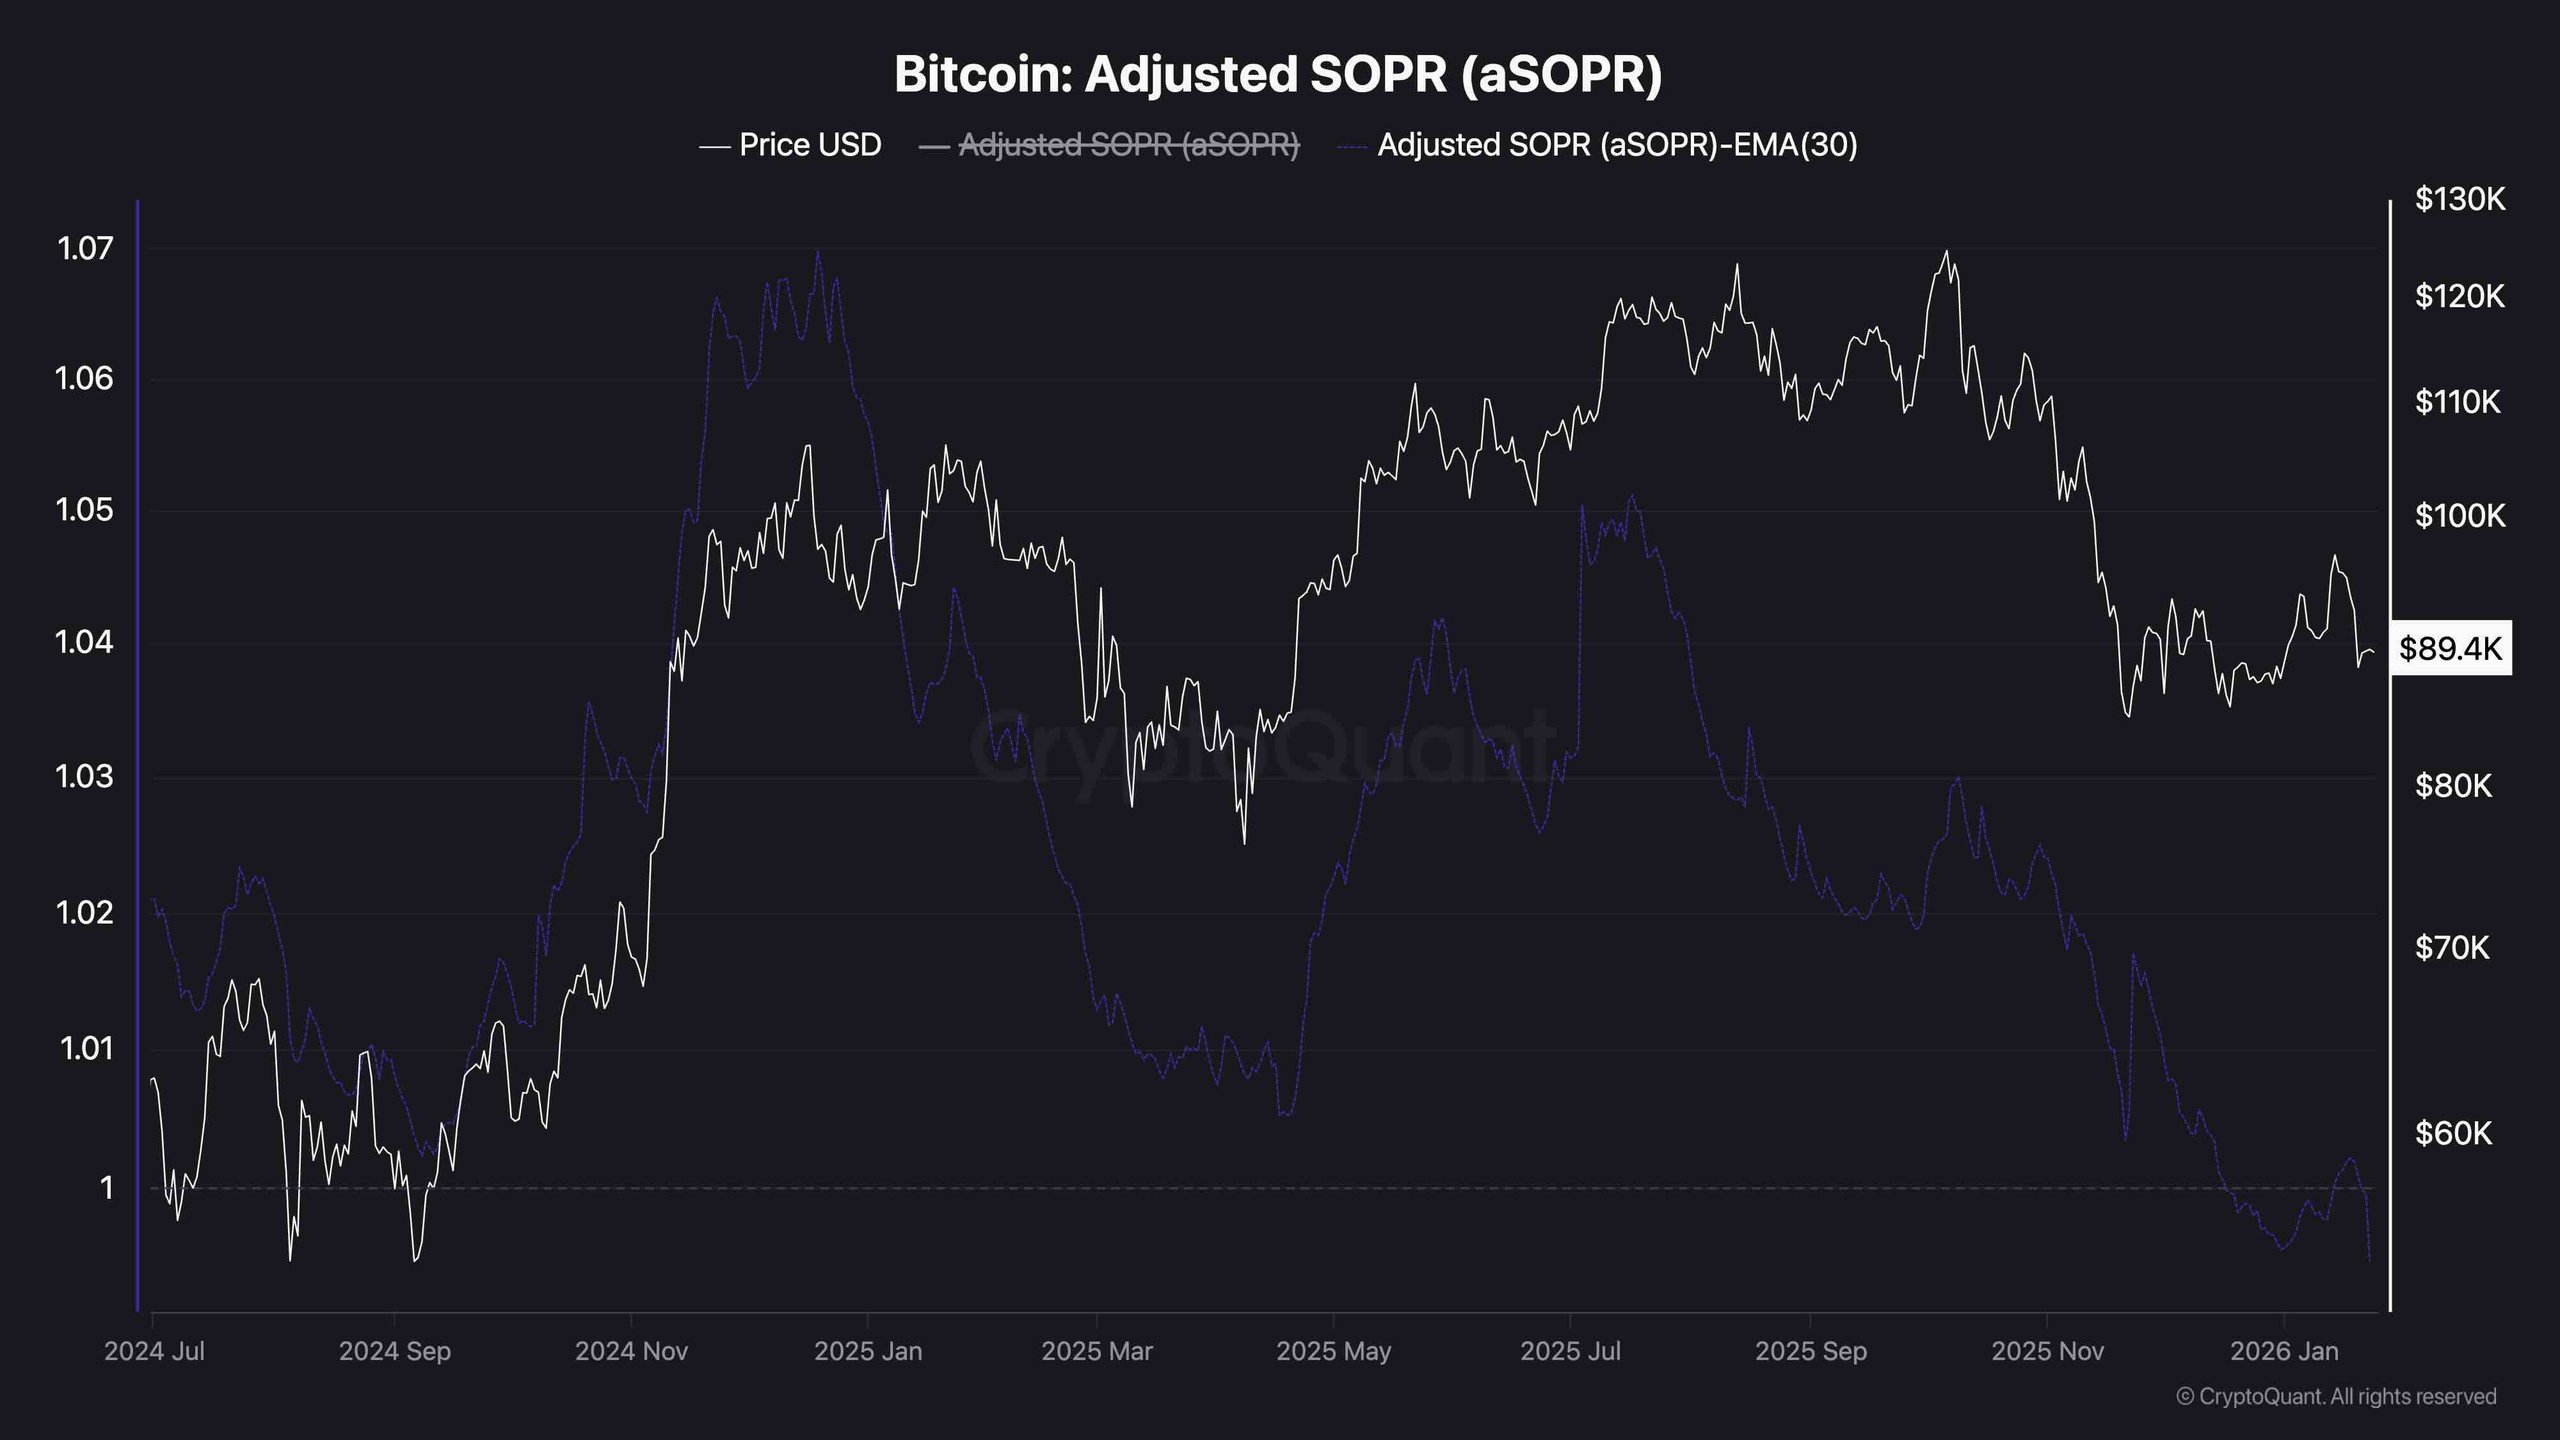
The adjusted SOPR (aSOPR) and its 30-day EMA have been declining for several months, dipping from a secure profit zone above 1.02 to below the neutral band around 1.00. A trend indicating that profits on spent outputs are being gradually compressed as a greater portion of coins are sold near breakeven, leading to periodic losses when the aSOPR falls below 1. Such patterns often signify a late-cycle or post-euphoria phase where speculative excess is unwinding and weaker holders are exiting the market.
Should the aSOPR stabilize above 1 while prices secure higher-timeframe support, this would indicate a healthier market correcting itself without broad capitulation. Conversely, a sustained decline of aSOPR below 1 could imply more extensive profit-taking and losses, extending the corrective phase.
 Adjusted SOPR
Special Offer: Exclusive partnership bonus for CryptoPotato readers: Use this link to register and unlock $1,500 in exclusive BingX Exchange rewards (limited time offer).
Disclaimer: The views and opinions expressed in this article are strictly those of the authors quoted and do not represent the official opinions of CryptoPotato. Always conduct your own research before making any investment decisions.
