Ethereum Price Forecast: Consequences of Losing $2.9K Support
The article analyzes the current price trends of Ethereum and the potential impacts of breaking the $2.9K support level.


Ethereum is currently in a broad sideways structure, with the spot price trading below key moving averages while on-chain activity shows signs of stabilization. The overall market sentiment is neutral-to-cautious, with some downside risk. However, there are support zones that could allow for recovery once selling pressure eases.
Ethereum Price Analysis: The Daily Chart
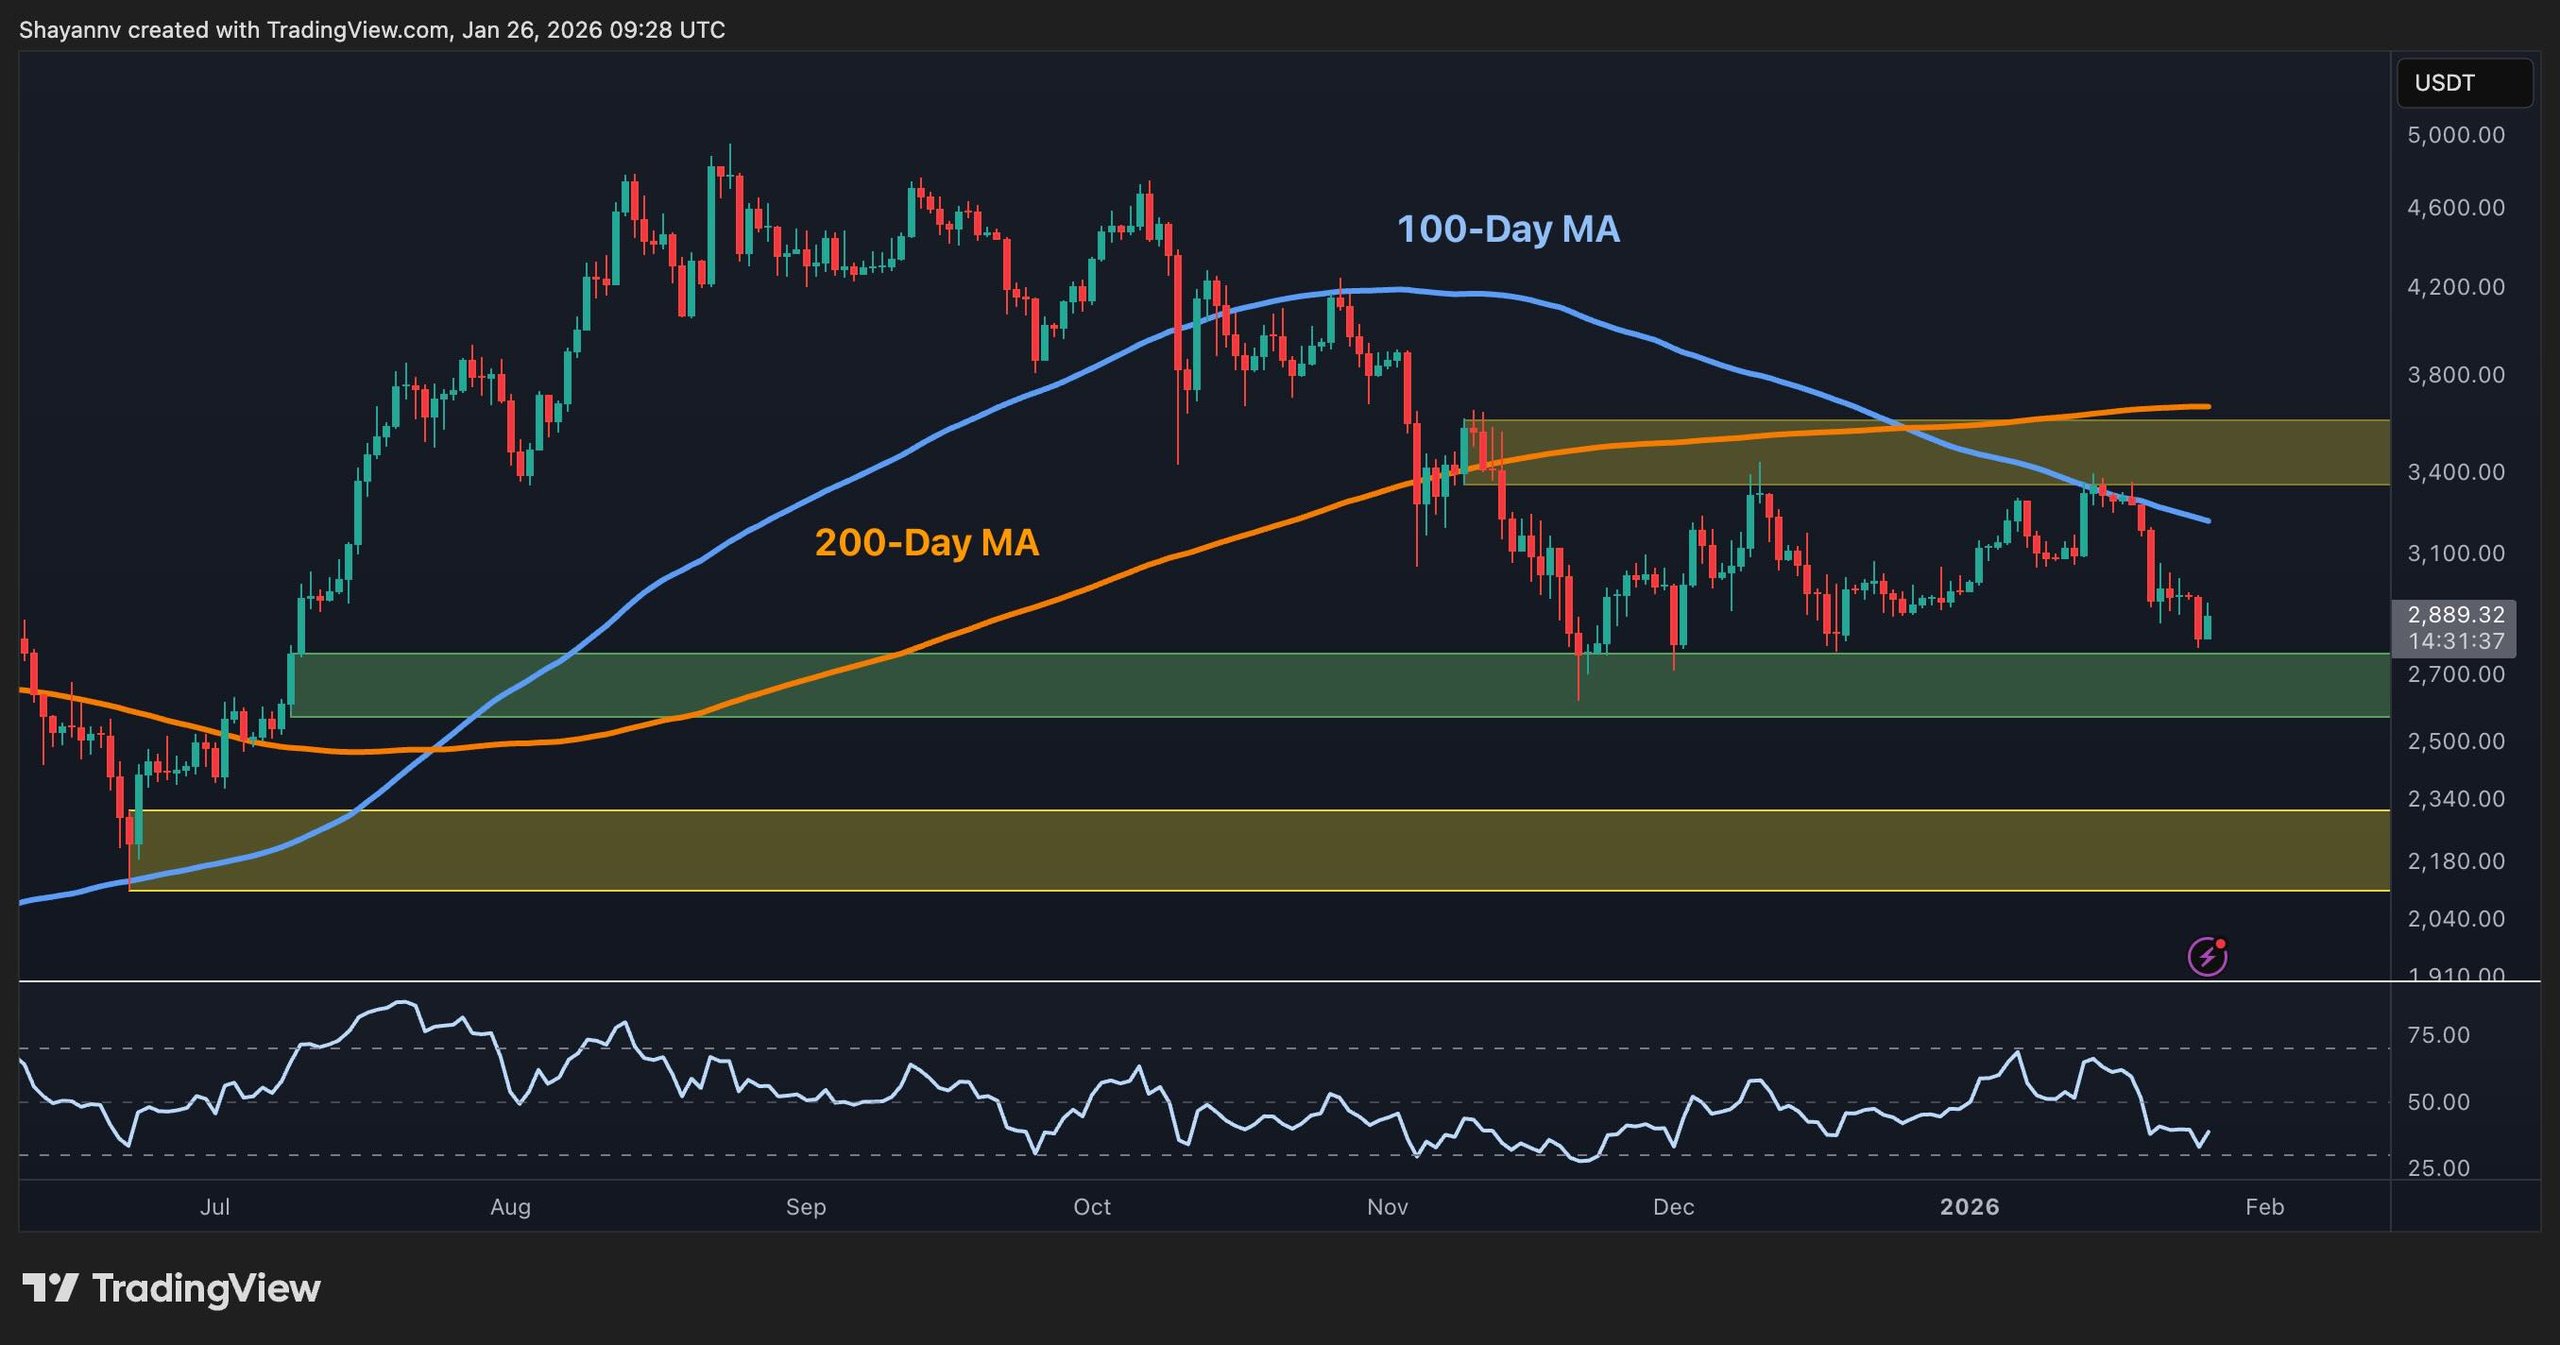
In the daily timeframe, ETH has faced rejection below its declining 100-day moving average, with a medium-term downtrend remaining evident due to its position relative to the 200-day moving average. Currently, the price hovers around $2,900 after facing opposition from the $3,400-$3,500 supply zone, marking $2,600-$2,700 as the primary demand area. A failure to maintain above $2,700 could lead to a drop to the $2,200 support zone. The daily RSI appears to be moving towards oversold levels, indicating a bearish momentum, yet there could be signs of slowing if new selling does not materialize.
Daily Chart
ETH/USDT 4-Hour Chart
The 4-hour chart indicates that ETH has breached the rising trendline linked to prior higher lows since the bottom in November, disrupting the symmetrical triangle structure. It remains below the previous $3,000 support, now acting as resistance. Continuous struggles to reclaim this level might lead to targeted intraday support at $2,800, and potentially a deeper dive towards the $2,500-$2,600 demand region.
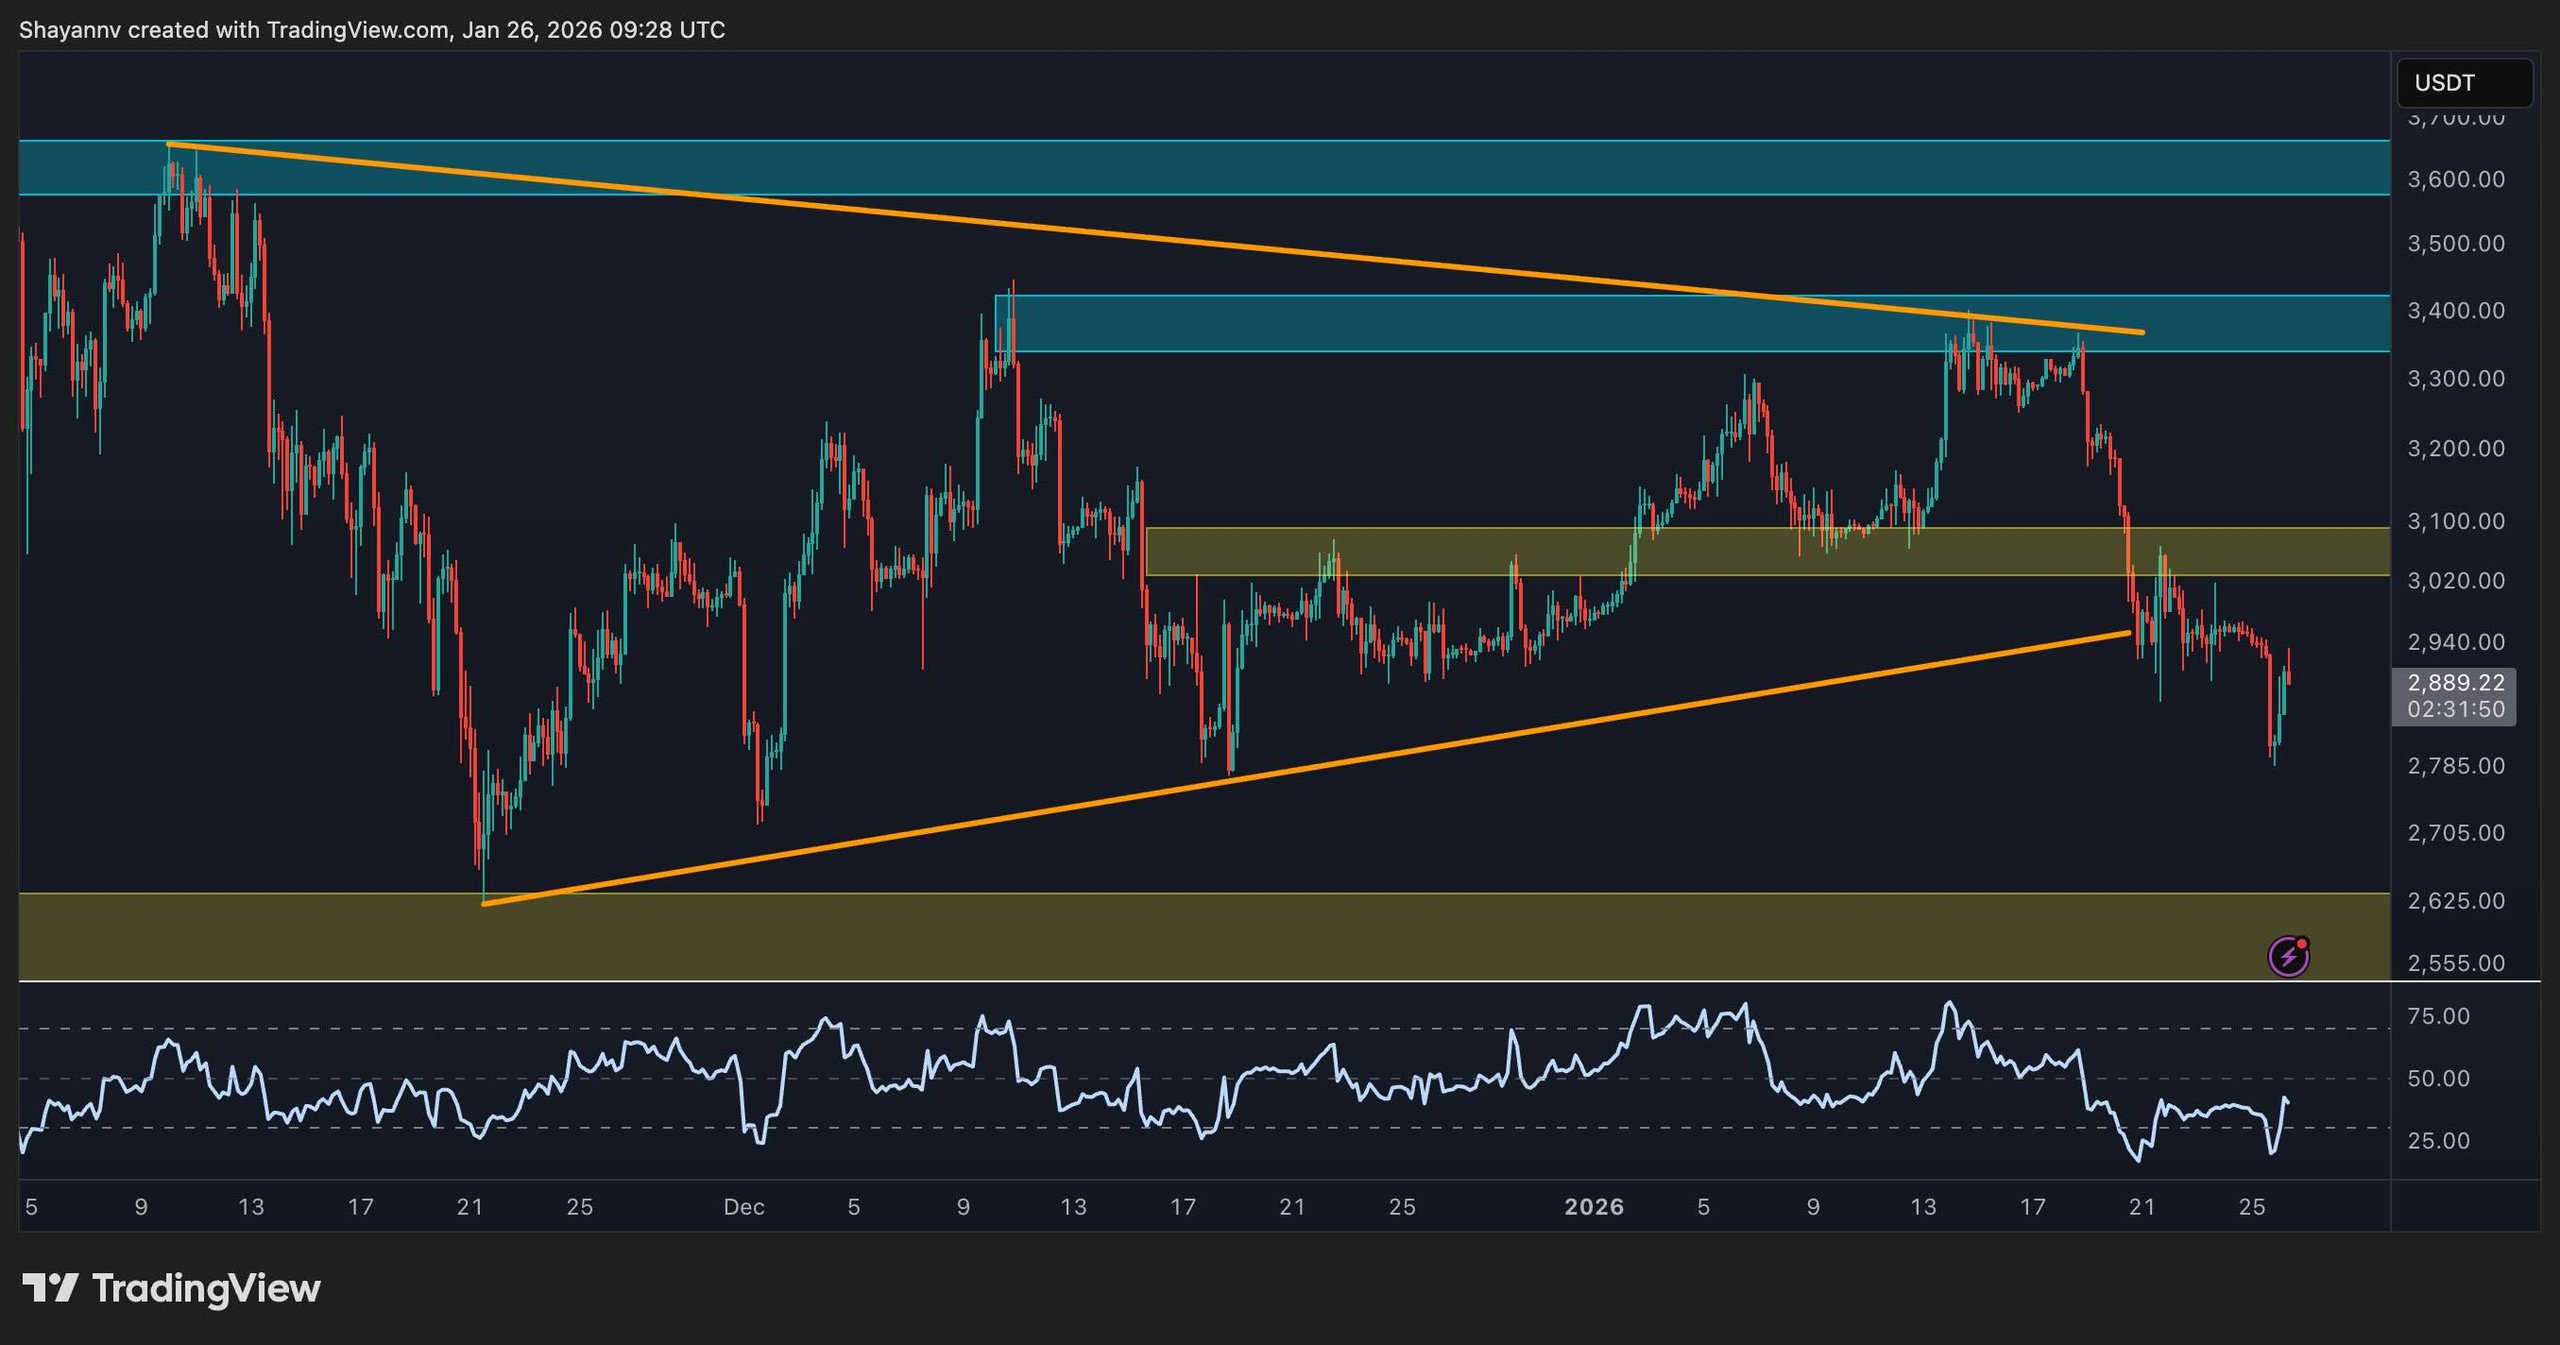 4-Hour Chart
On-Chain Analysis
Analyzing on-chain metrics shows an uptick in Ethereum’s total transaction count and 30-day EMA, suggesting that even while prices fall back toward $2,900, there’s a shift from speculative activity towards genuine network usage as weaker investors exit, leaving engaged users behind. If transaction counts uphold or rise while prices stabilize above critical demand zones, this may hint at significant market health. Conversely, inactivity might signal a recovery driven more by technical aspects than fundamental strength.
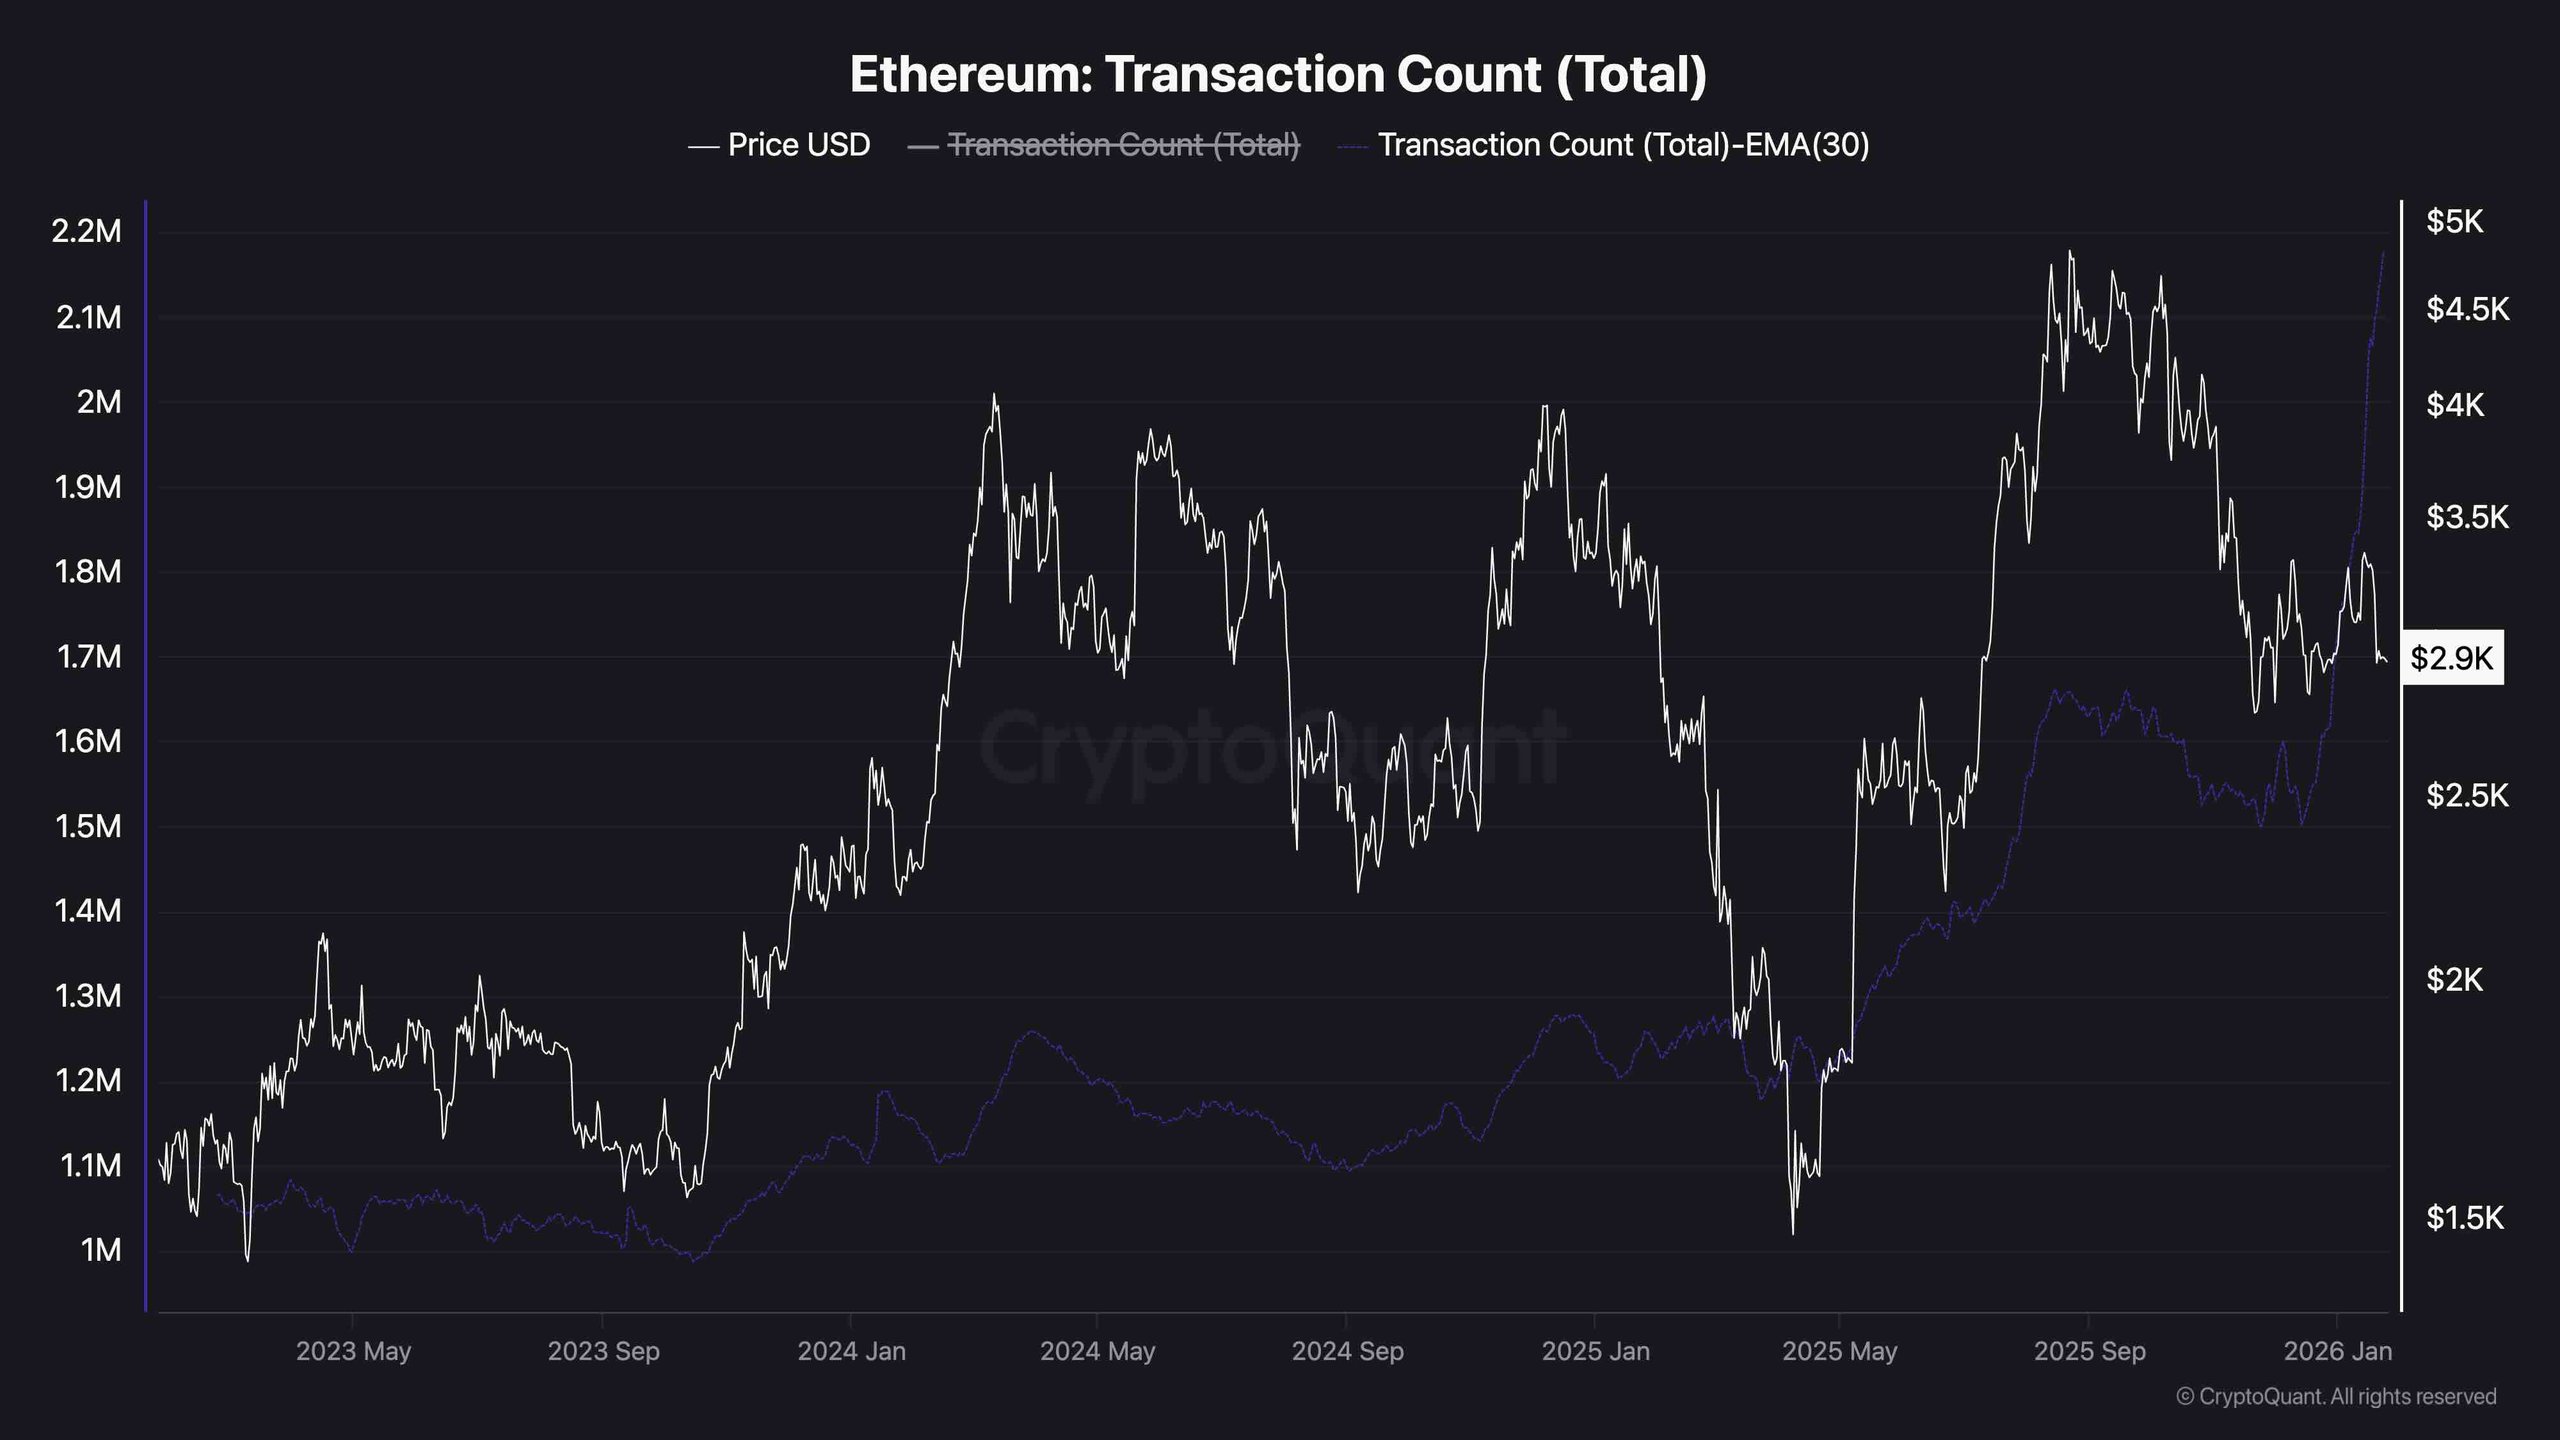 Transaction Count
