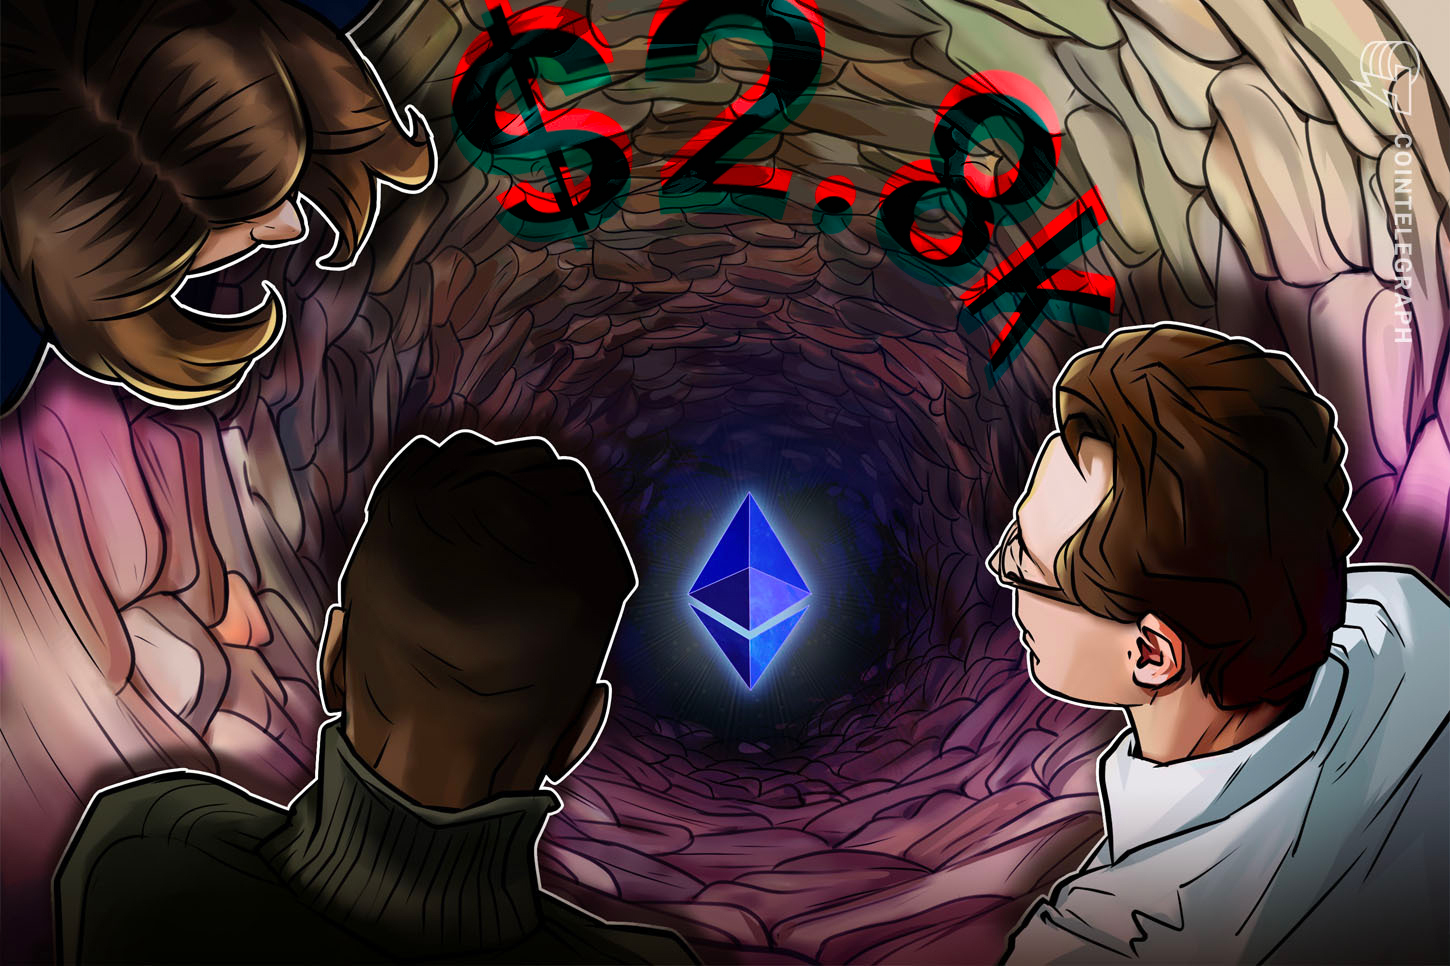


Ethereum (ETH) has recently fallen below the pivotal support level of $2,800, raising concerns about a potential decrease toward $2,100. Historical trends and technical analysis suggest that further declines may be on the horizon.
Key Insights:
- Technical Patterns: Both descending and symmetrical triangle formations are indicating a price target around $2,100.
- Market Sentiment: Currently, Ether is positioned at levels that have historically led to significant price corrections.
Technical Analysis at $2,100
The value of the ETH/USD pair has dropped by more than 10% over the previous three days, falling below the critical $2,800 support, a level not crossed since December 3, 2025. This breach could signify further price declines.
“A failure to hold here confirms the bearish dominance, potentially opening the doors to the $2,500 mid-range,” said Metacryptox.
Translation: “If this level cannot be maintained, it confirms a prevailing bearish trend, leading potentially to ranges near $2,500.”
Further analyses suggest that the next major support level is at $2,500, aligned with the 200-week simple moving average (SMA). Below that, predictions estimate a drop towards $2,150, translating to a 20% decline from the current price level.
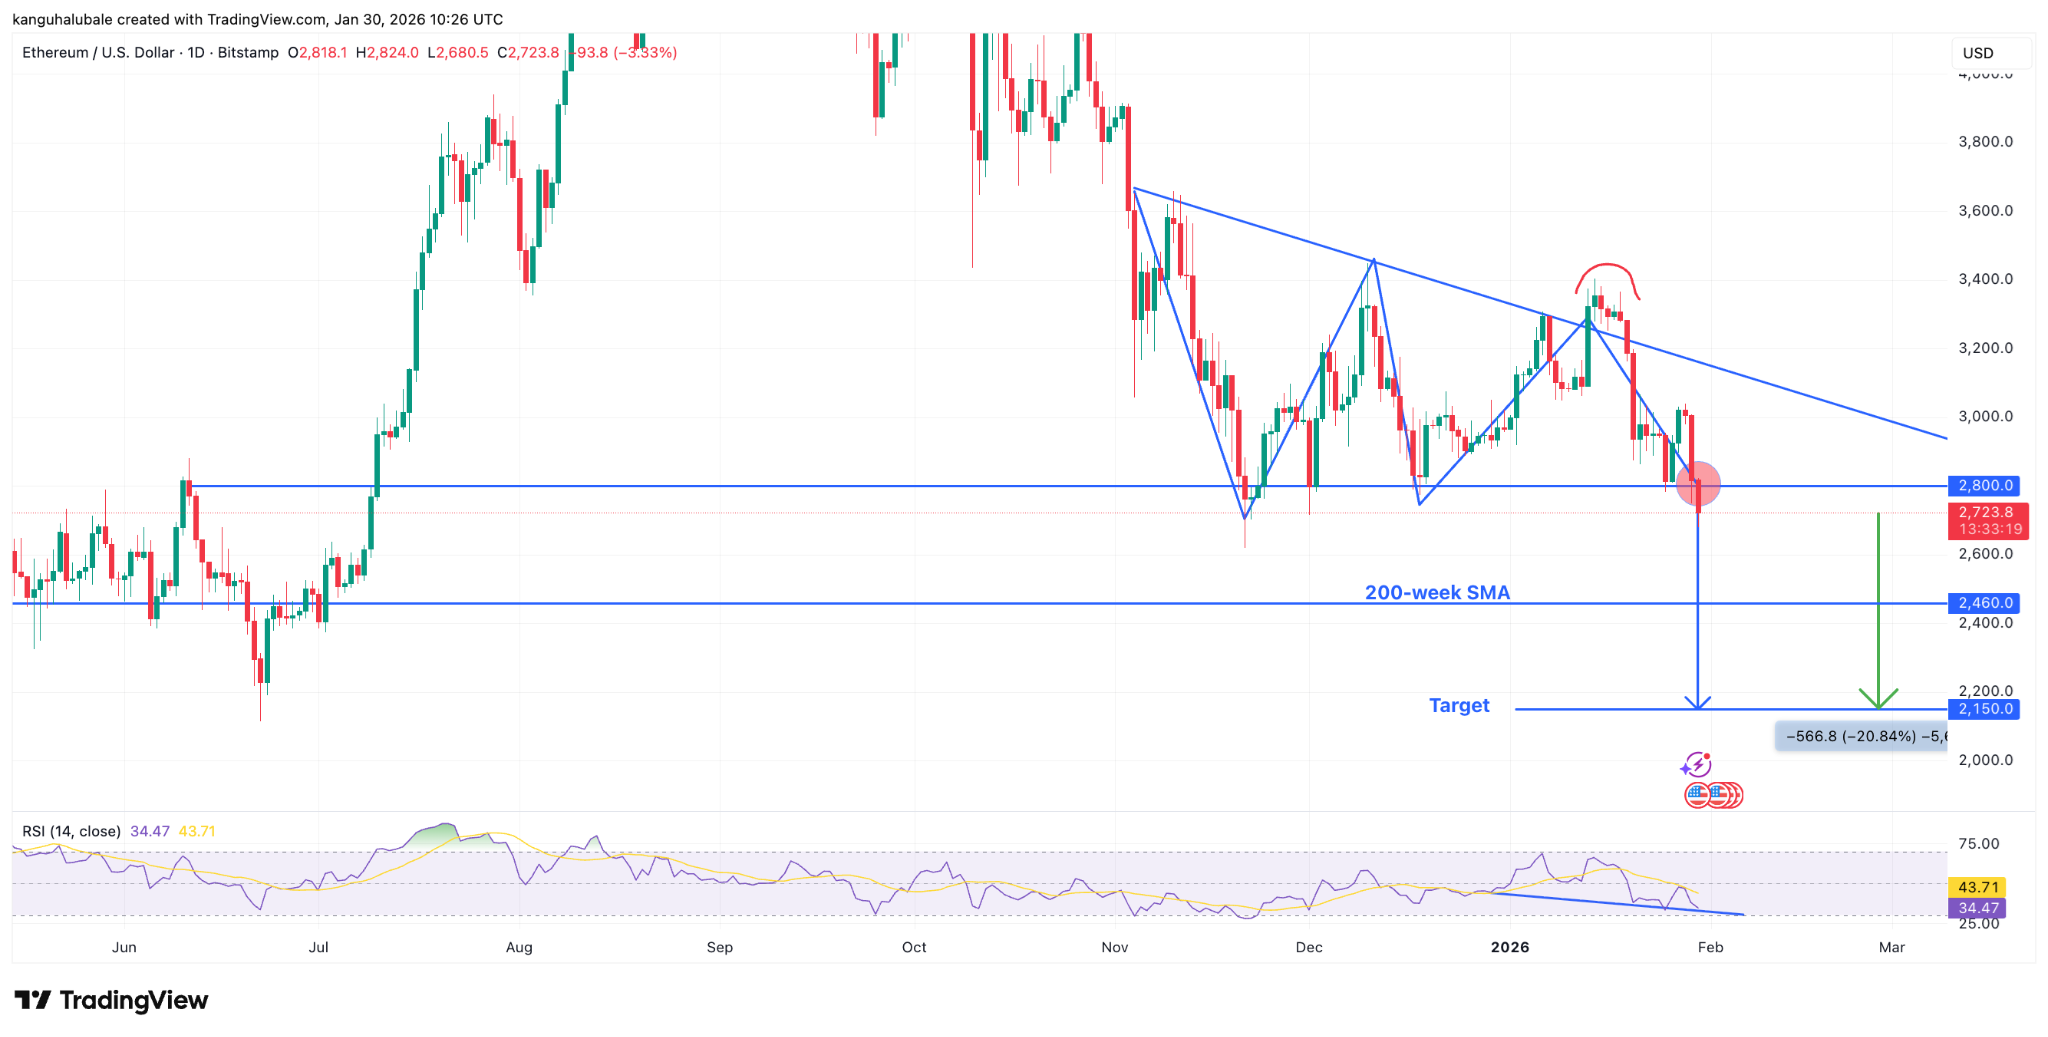 ETH/USD daily chart
. Source: Cointelegraph/TradingView
ETH/USD daily chart
ETH/USD daily chart. Source: Cointelegraph/TradingView
Moreover, sentiment indicators suggest a bearish divergence, with the relative strength index (RSI) showing a decline from 68 to 34, indicating waning price momentum.
Peter Brandt, a veteran trader, mentioned that the shift from bullish to bearish sentiment puts pressure on Ether post the breach of key technical levels.
Convergence with Past Market Trends
Current on-chain data reflects similarities between Ether’s present market position and past bear cycles. The net unrealized profit/loss (NUPL) indicator has shifted from a state of anxiety to the fear zone, often a precursor to bear markets.
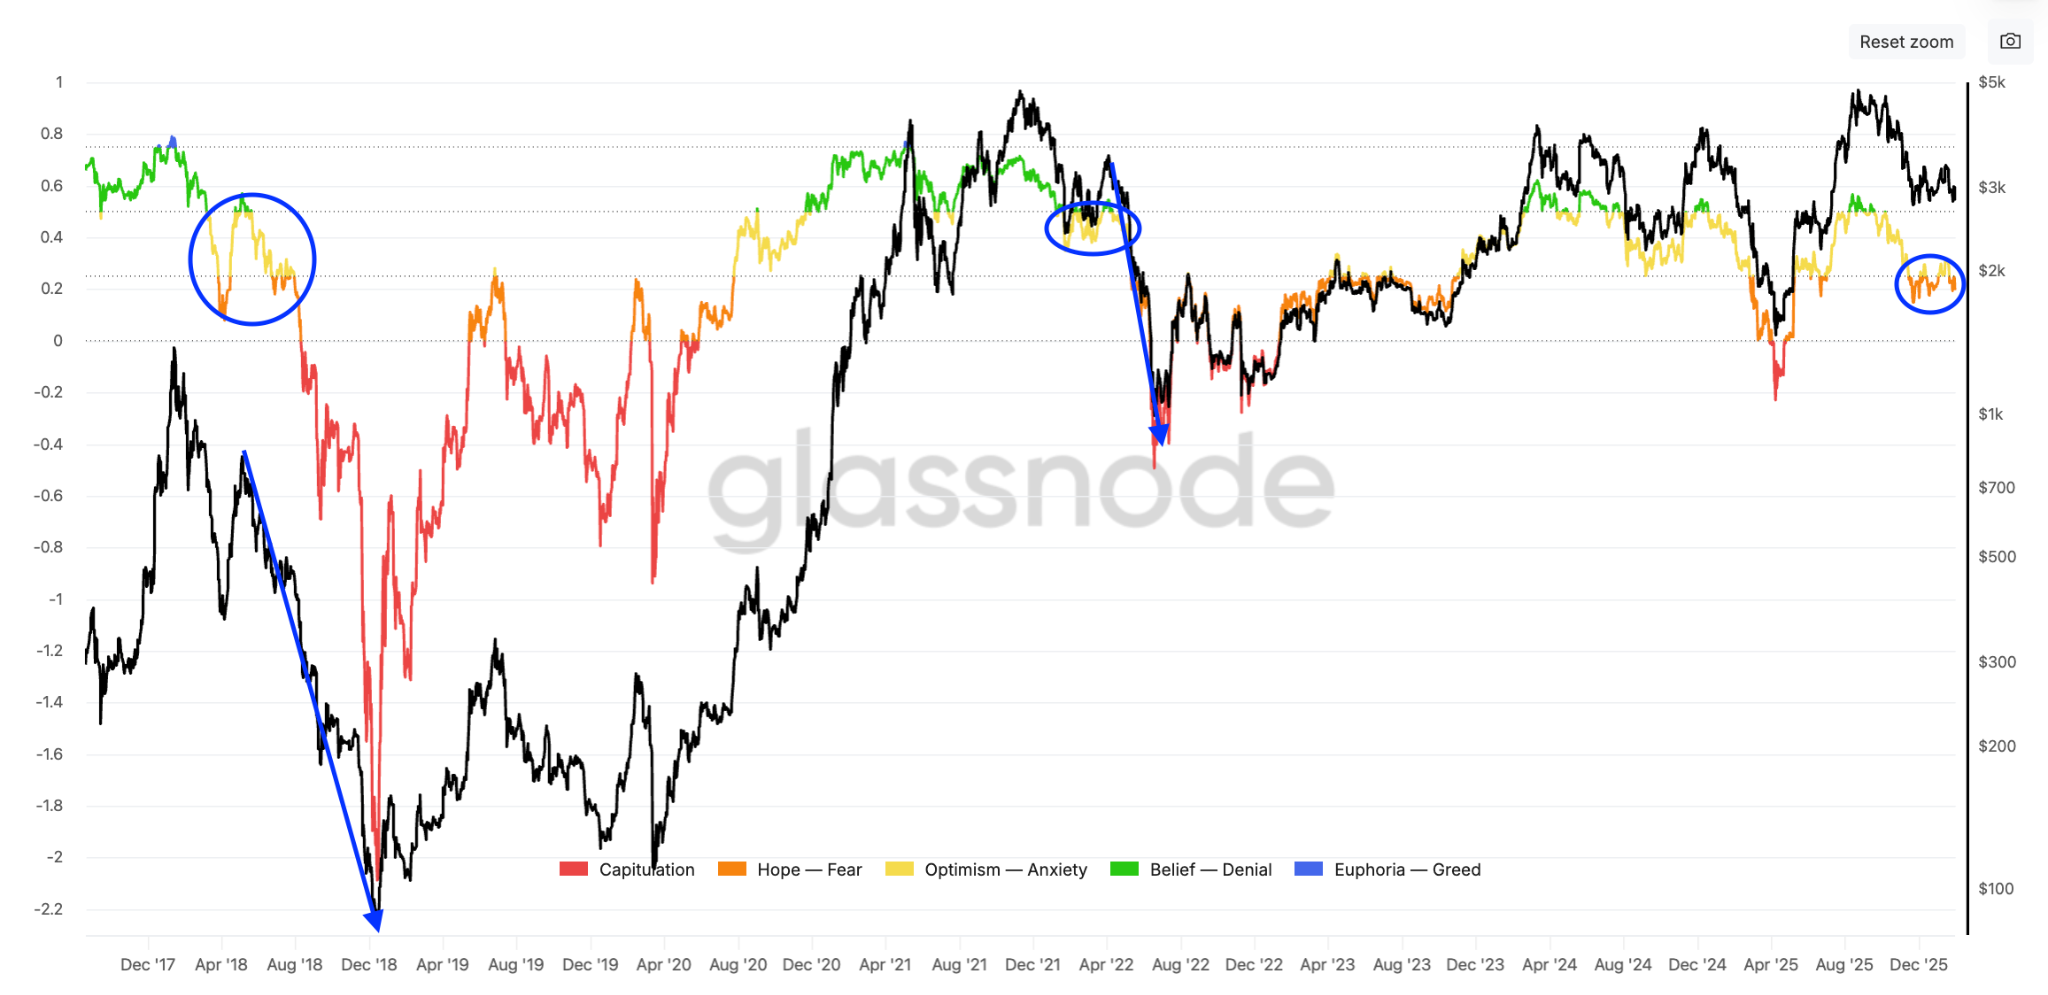 ETH: net unrealized profit/loss
. Source: Glassnode
ETH: net unrealized profit/loss
ETH: net unrealized profit/loss. Source: Glassnode
With the 111-day moving average traded below the 200-day moving average, historical data indicates that such crossovers could signify deeper price withdrawals, referencing similar occurrences in 2018 and 2022.
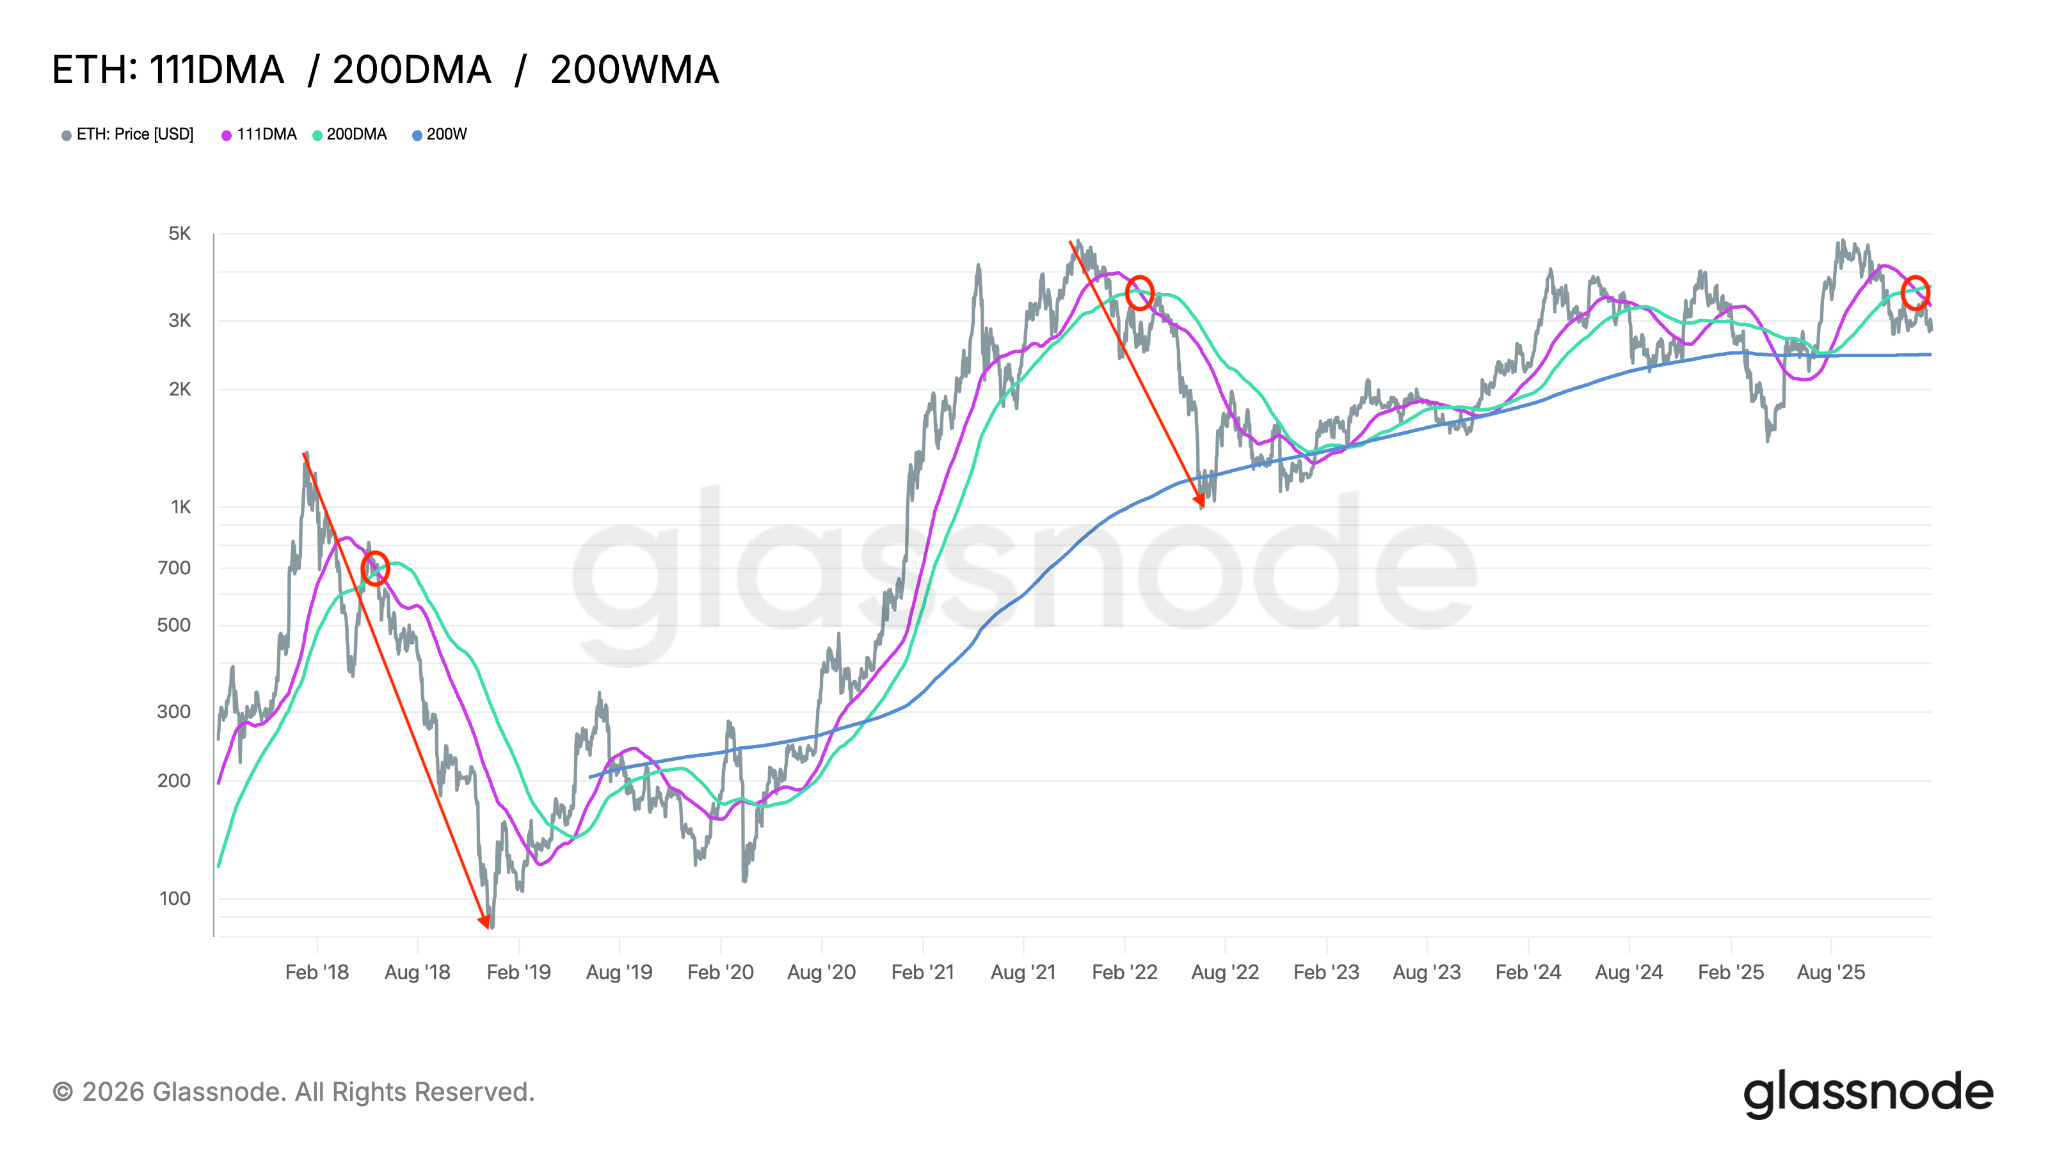 Ether’s 111-day MA vs. 200-day MA
. Source: Glassnode
Ether’s 111-day MA vs. 200-day MA
Ether’s 111-day MA vs. 200-day MA. Source: Glassnode
This article contains no investment recommendations. All trading carries risk and requires thorough personal investigation before decisions are made.
