
Bitcoin May Take Months to Bounce Back to $100K After Recent Dip
Analysis indicates Bitcoin's recovery from its recent drop below $75,000 could extend over several months, rather than a swift rebound.


Bitcoin (BTC) recently closed its weekly candle at $76,931, which marks the first time it has dipped below its 100-week moving average since October 2023. Analysts are debating whether this signals the onset of a bear market and its implications for Bitcoin’s future recovery.
Key Takeaways:
- Bitcoin has closed a weekly candle beneath the 100-week simple moving average, a trend that typically coincides with prolonged declines.
- Historical instances of dropping below this trend line have lasted between 182 and 532 days.
- Significant trading volume has occurred between $85,000 and $95,000, suggesting this could emerge as a major resistance area.
Bitcoin Falls Below Long-Term Trends
Bitcoin’s move below its 100-week SMA signifies a loss of momentum for the cryptocurrency at around $87,500. Crypto advocate Brett highlights that, excluding the COVID-19 flash crash, Bitcoin has often lingered below the 100-week SMA for substantial durations. For example, during the 2014-2015 cycle, prices were stuck under this level for 357 days, oscillating between $200 and $600 following the 2013 bull market.
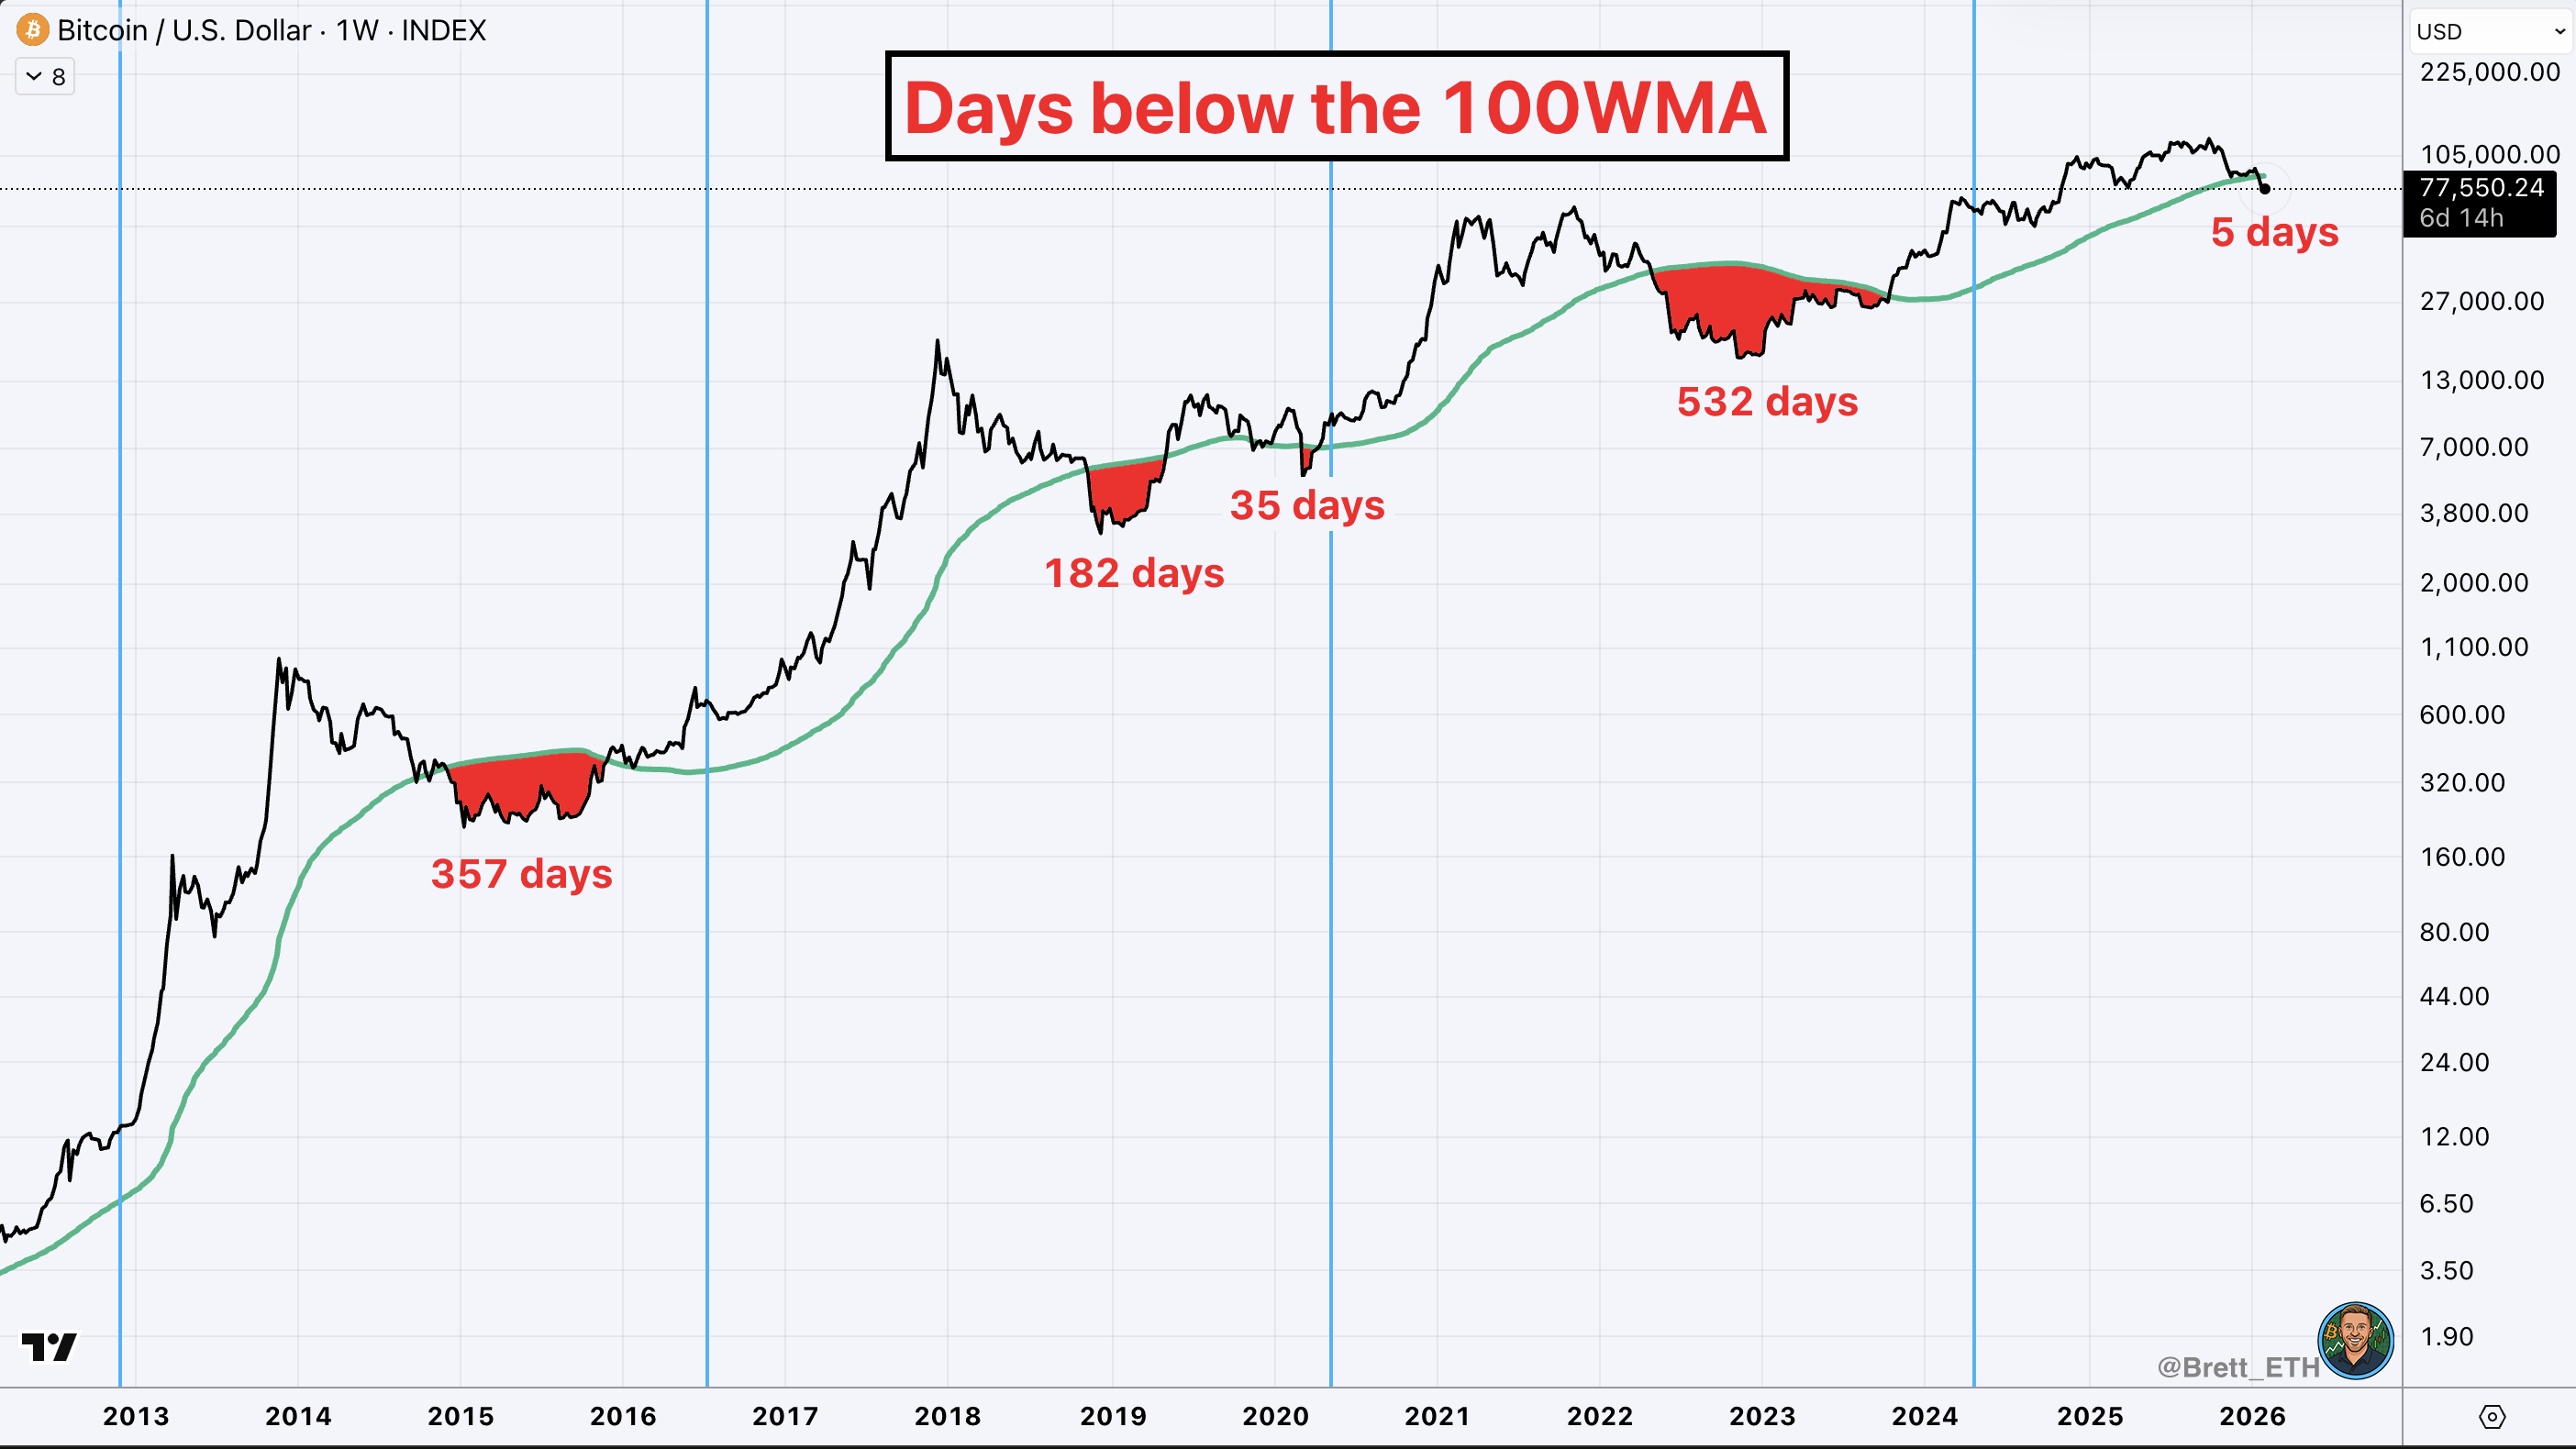 Bitcoin days below the 100W SMA. Source: Brett/X
In 2018-2019, Bitcoin remained under the average for 182 days, aligning with its bear market bottom around $3,000 to $6,000. In 2022, it spent 532 days beneath this key level post FTX collapse, stabilizing between $16,000 and $25,000. Each of these events led to periods of consolidation rather than rapid recoveries, indicating that time is an essential factor ahead of future bullish phases.
Rising USDT Dominance and $85,000 Resistance Heighten Bear Market Concerns
Crypto analyst Sherlock suggests that a bear market could materialize after USDT dominance surpasses 7.2%. Previous cycles have observed bearish conditions confirmed by levels above 6.7%, making the recent rise noteworthy since it’s the first spike in over two and a half years.
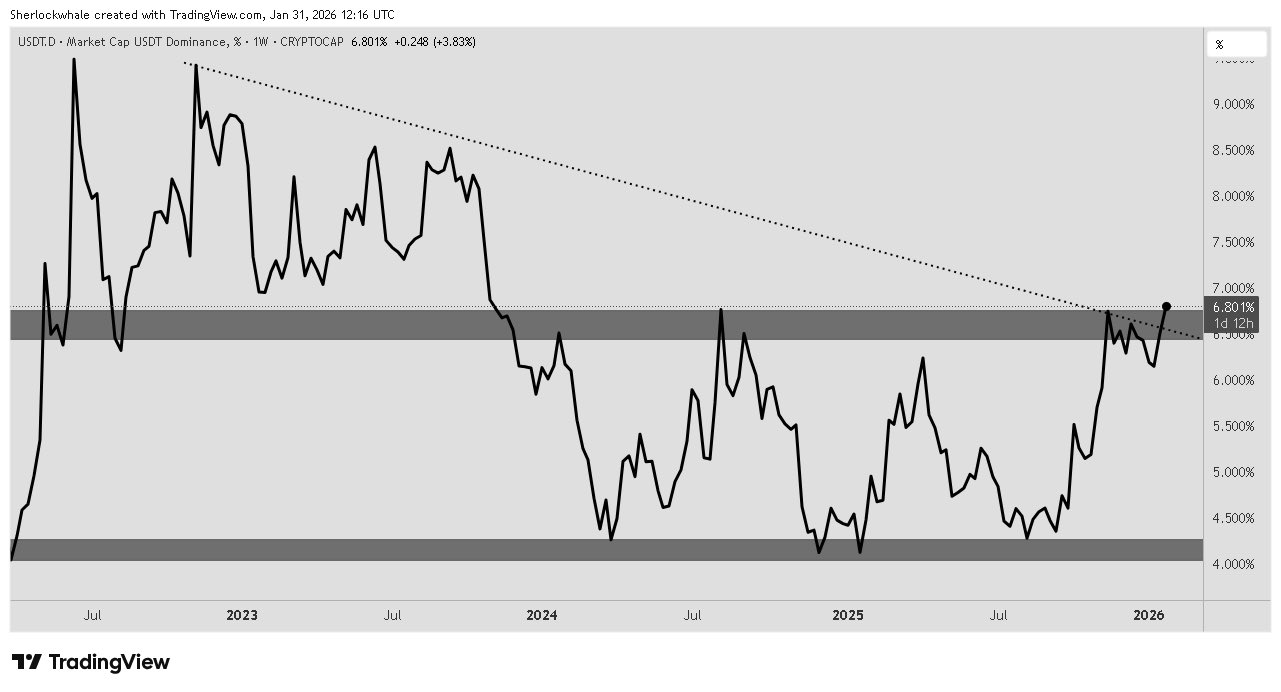 USDT dominance chart analysis by Sherlock. Source: X
Sherlock identifies $85,000 as a crucial resistance region. Approximately $120 billion in trading volume exchanged hands between $85,000 and $95,000 in Q4, 2025, leaving many BTC investors at a loss. With the current price nearing $78,000, any movement toward $85,000 might encounter persistent selling pressures as traders aim to exit with no losses, with the average purchase price for holders of one to three months sitting around $91,500.
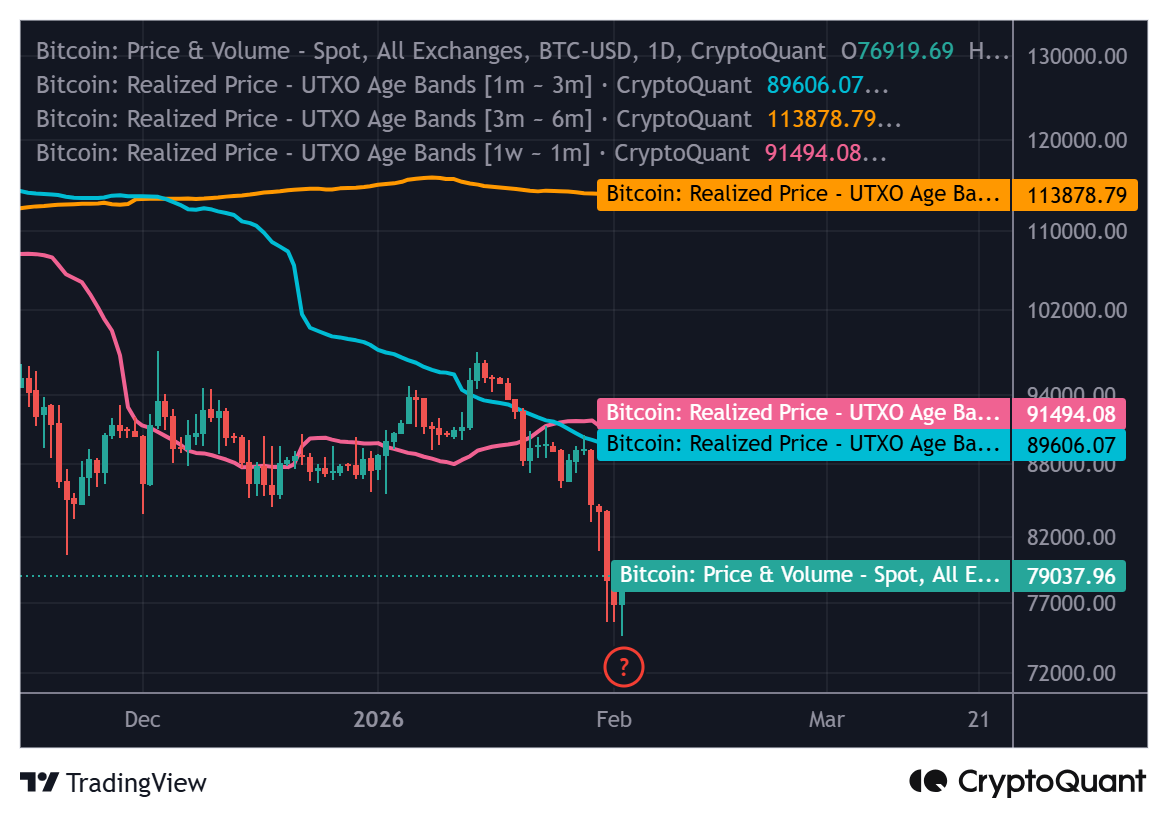 Bitcoin realized price of 1m-3m holder cohorts. Source: CryptoQuant
BTC Fractal Structure Reflects Previous Market Dip
Comparative analysis reveals that Bitcoin’s current weekly behavior resembles its dip in 2022. At that time, it formed lower highs, dropped below the 100-week SMA, and failed to maintain a recovery before entering a deeper correction.
 BTC/USDT one-week chart with head and shoulders pattern. Source: TradingView
A similar pattern is emerging in 2026. Should this trend persist, Bitcoin could revert to the $40,000 to $45,000 mark, a recognized demand area. While fractals lack predictive power, this situation indicates that downside risks remain high unless Bitcoin decisively regains the 100-week SMA.
