Recent Bitcoin Price Insights: Assessing the Path Forward After $74K Dip
An analysis of Bitcoin's price movements and future predictions following its recent drop to $74K.


Bitcoin’s recent downturn has paused after hitting a significant demand zone around $74K, which might lead to a period of consolidation. While immediate downward pressure appears to have abated, the overall market structure hints that a corrective uptick followed by a fallback into various supply zones is plausible, allowing time for the market to stabilize before the next major shift.
Bitcoin Price Analysis: Daily Overview
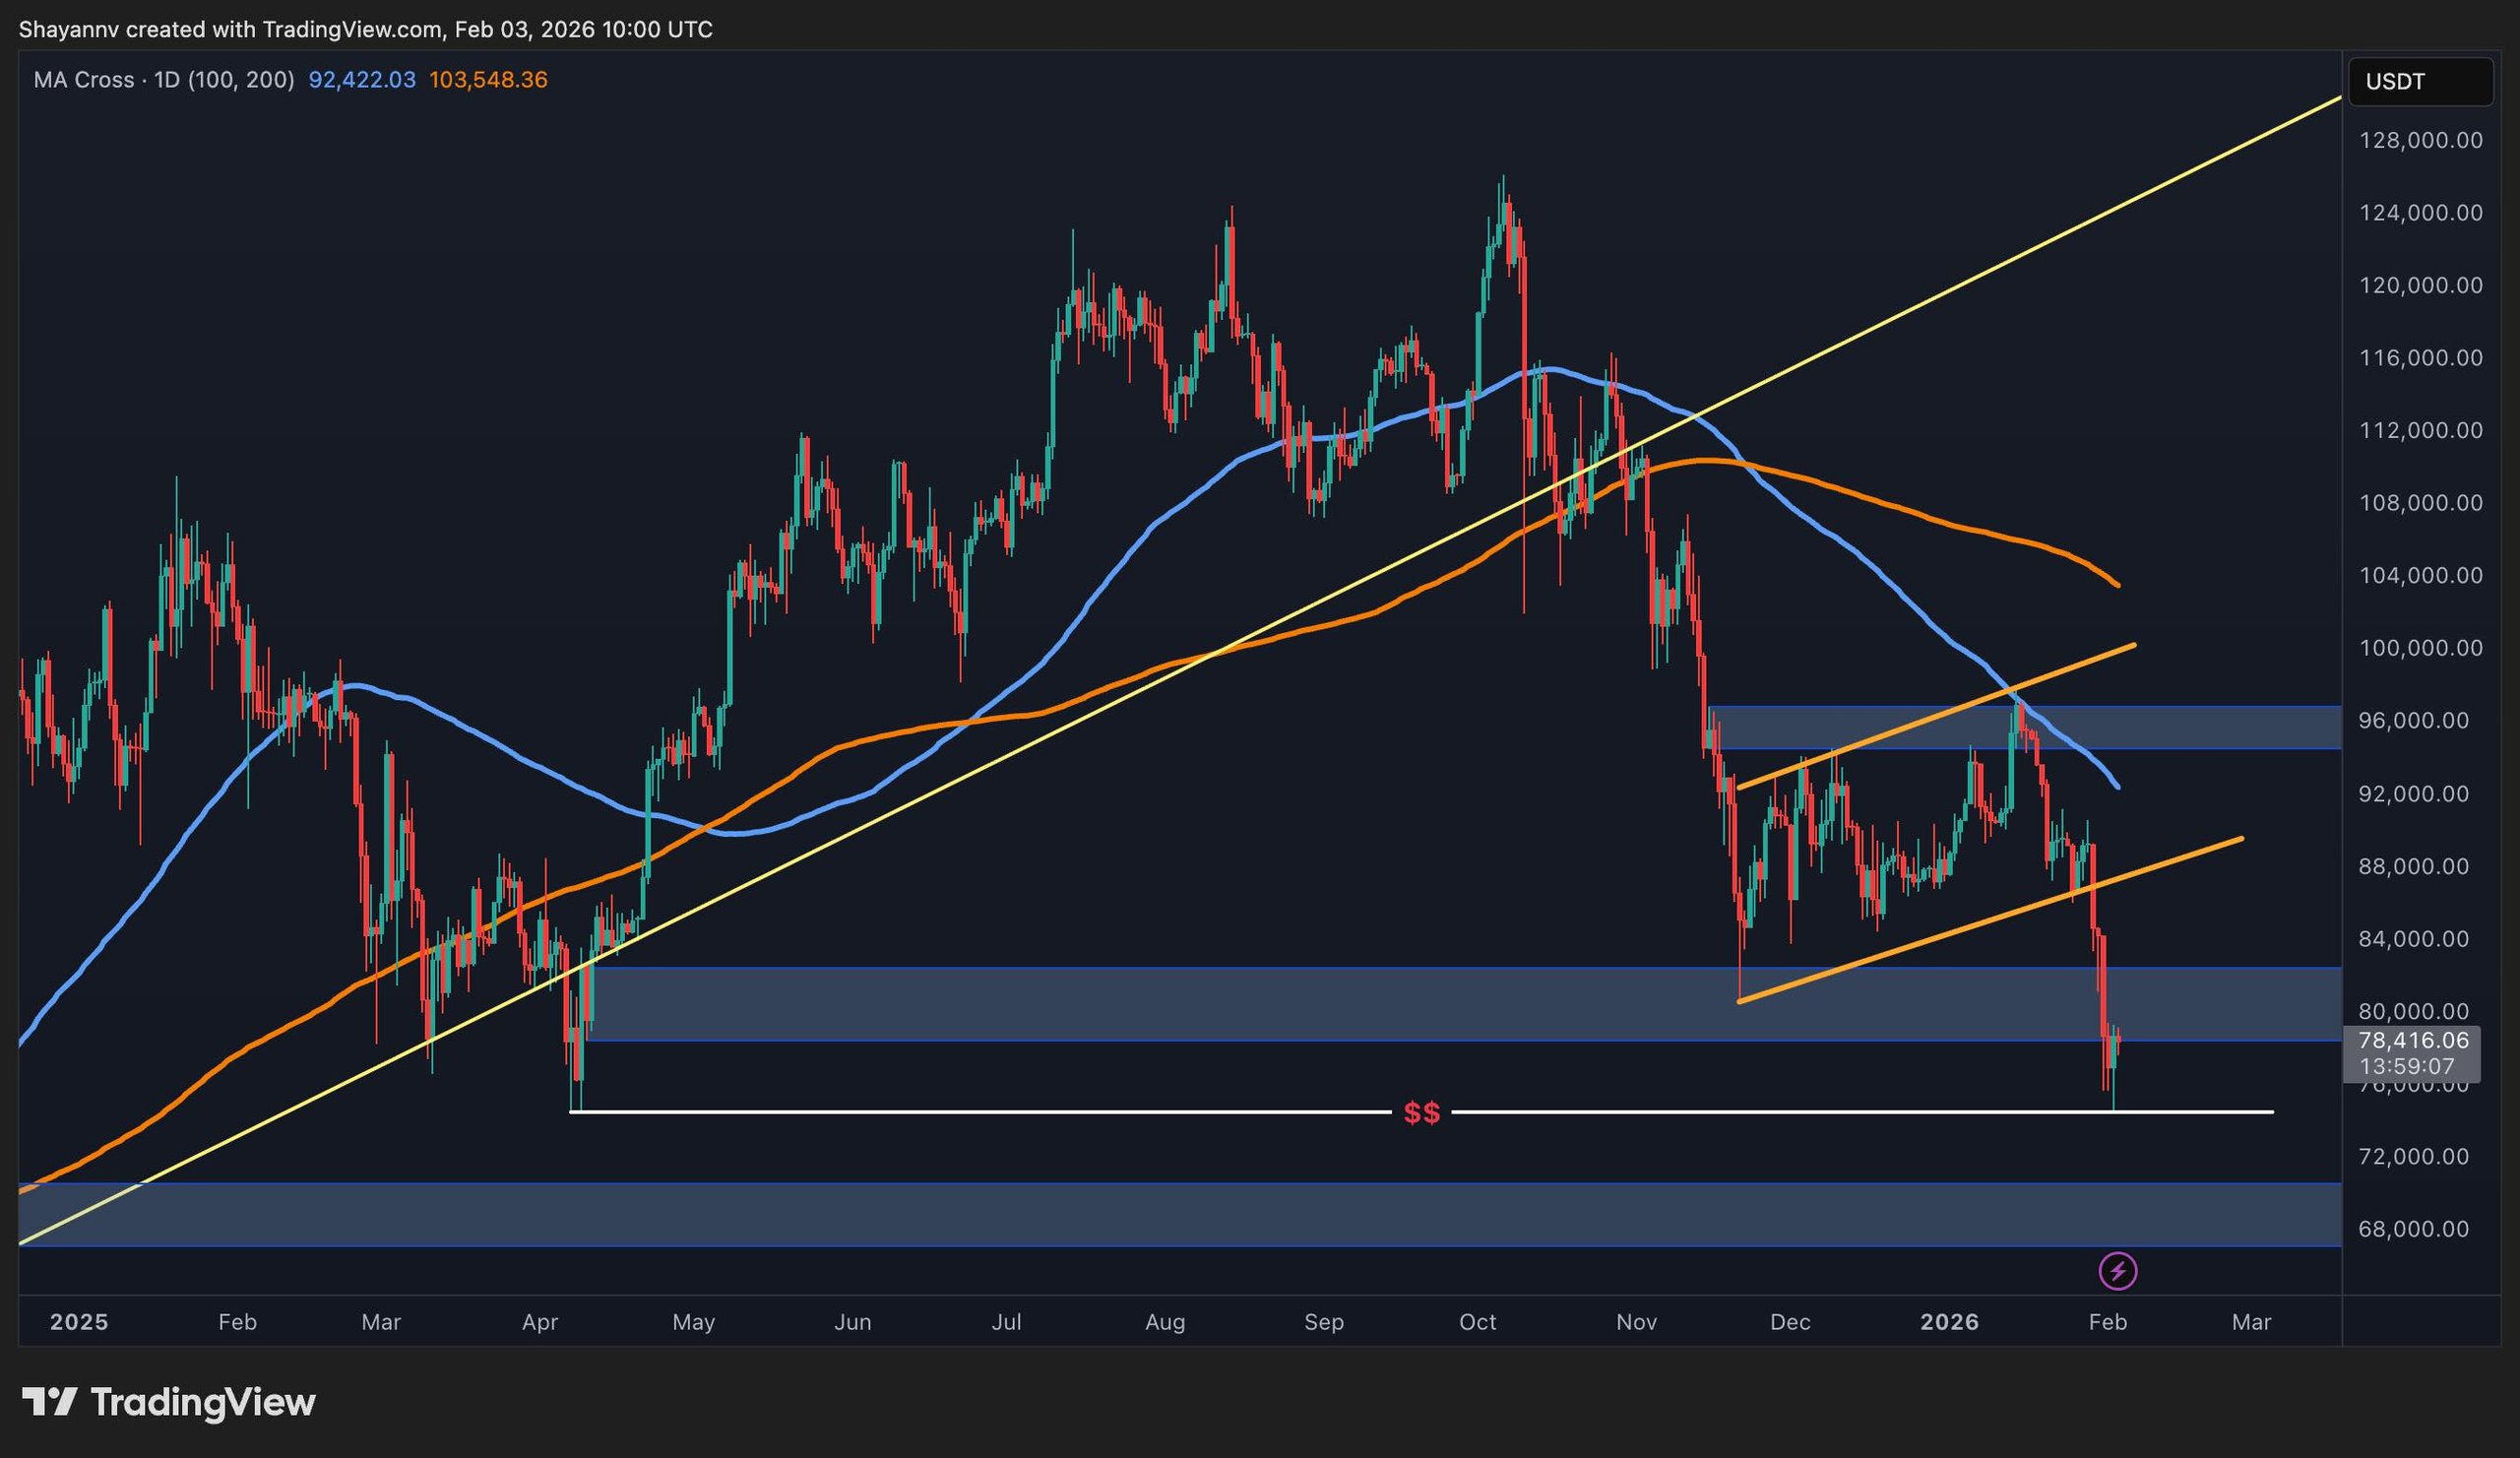
On the daily chart, Bitcoin continues to experience considerable selling pressure after a pronounced fall into the $74K demand zone. This zone aligns with a critical weekly swing low, establishing its importance as a crucial barrier for buyers.
Just beneath this support lies a substantial liquidity cluster mainly consisting of long liquidation points. The market activity in this vicinity will be key in determining the subsequent phase; a definitive bearish break would likely incite another wave of sell-offs, leading to additional long position liquidations.
Conversely, from a short-term viewpoint, a period of consolidation followed by a bullish retracement towards the previously broken wedge’s lower boundary, close to $90K, seems to be the more likely development.
BTC Daily Chart
BTC/USDT 4-Hour Chart
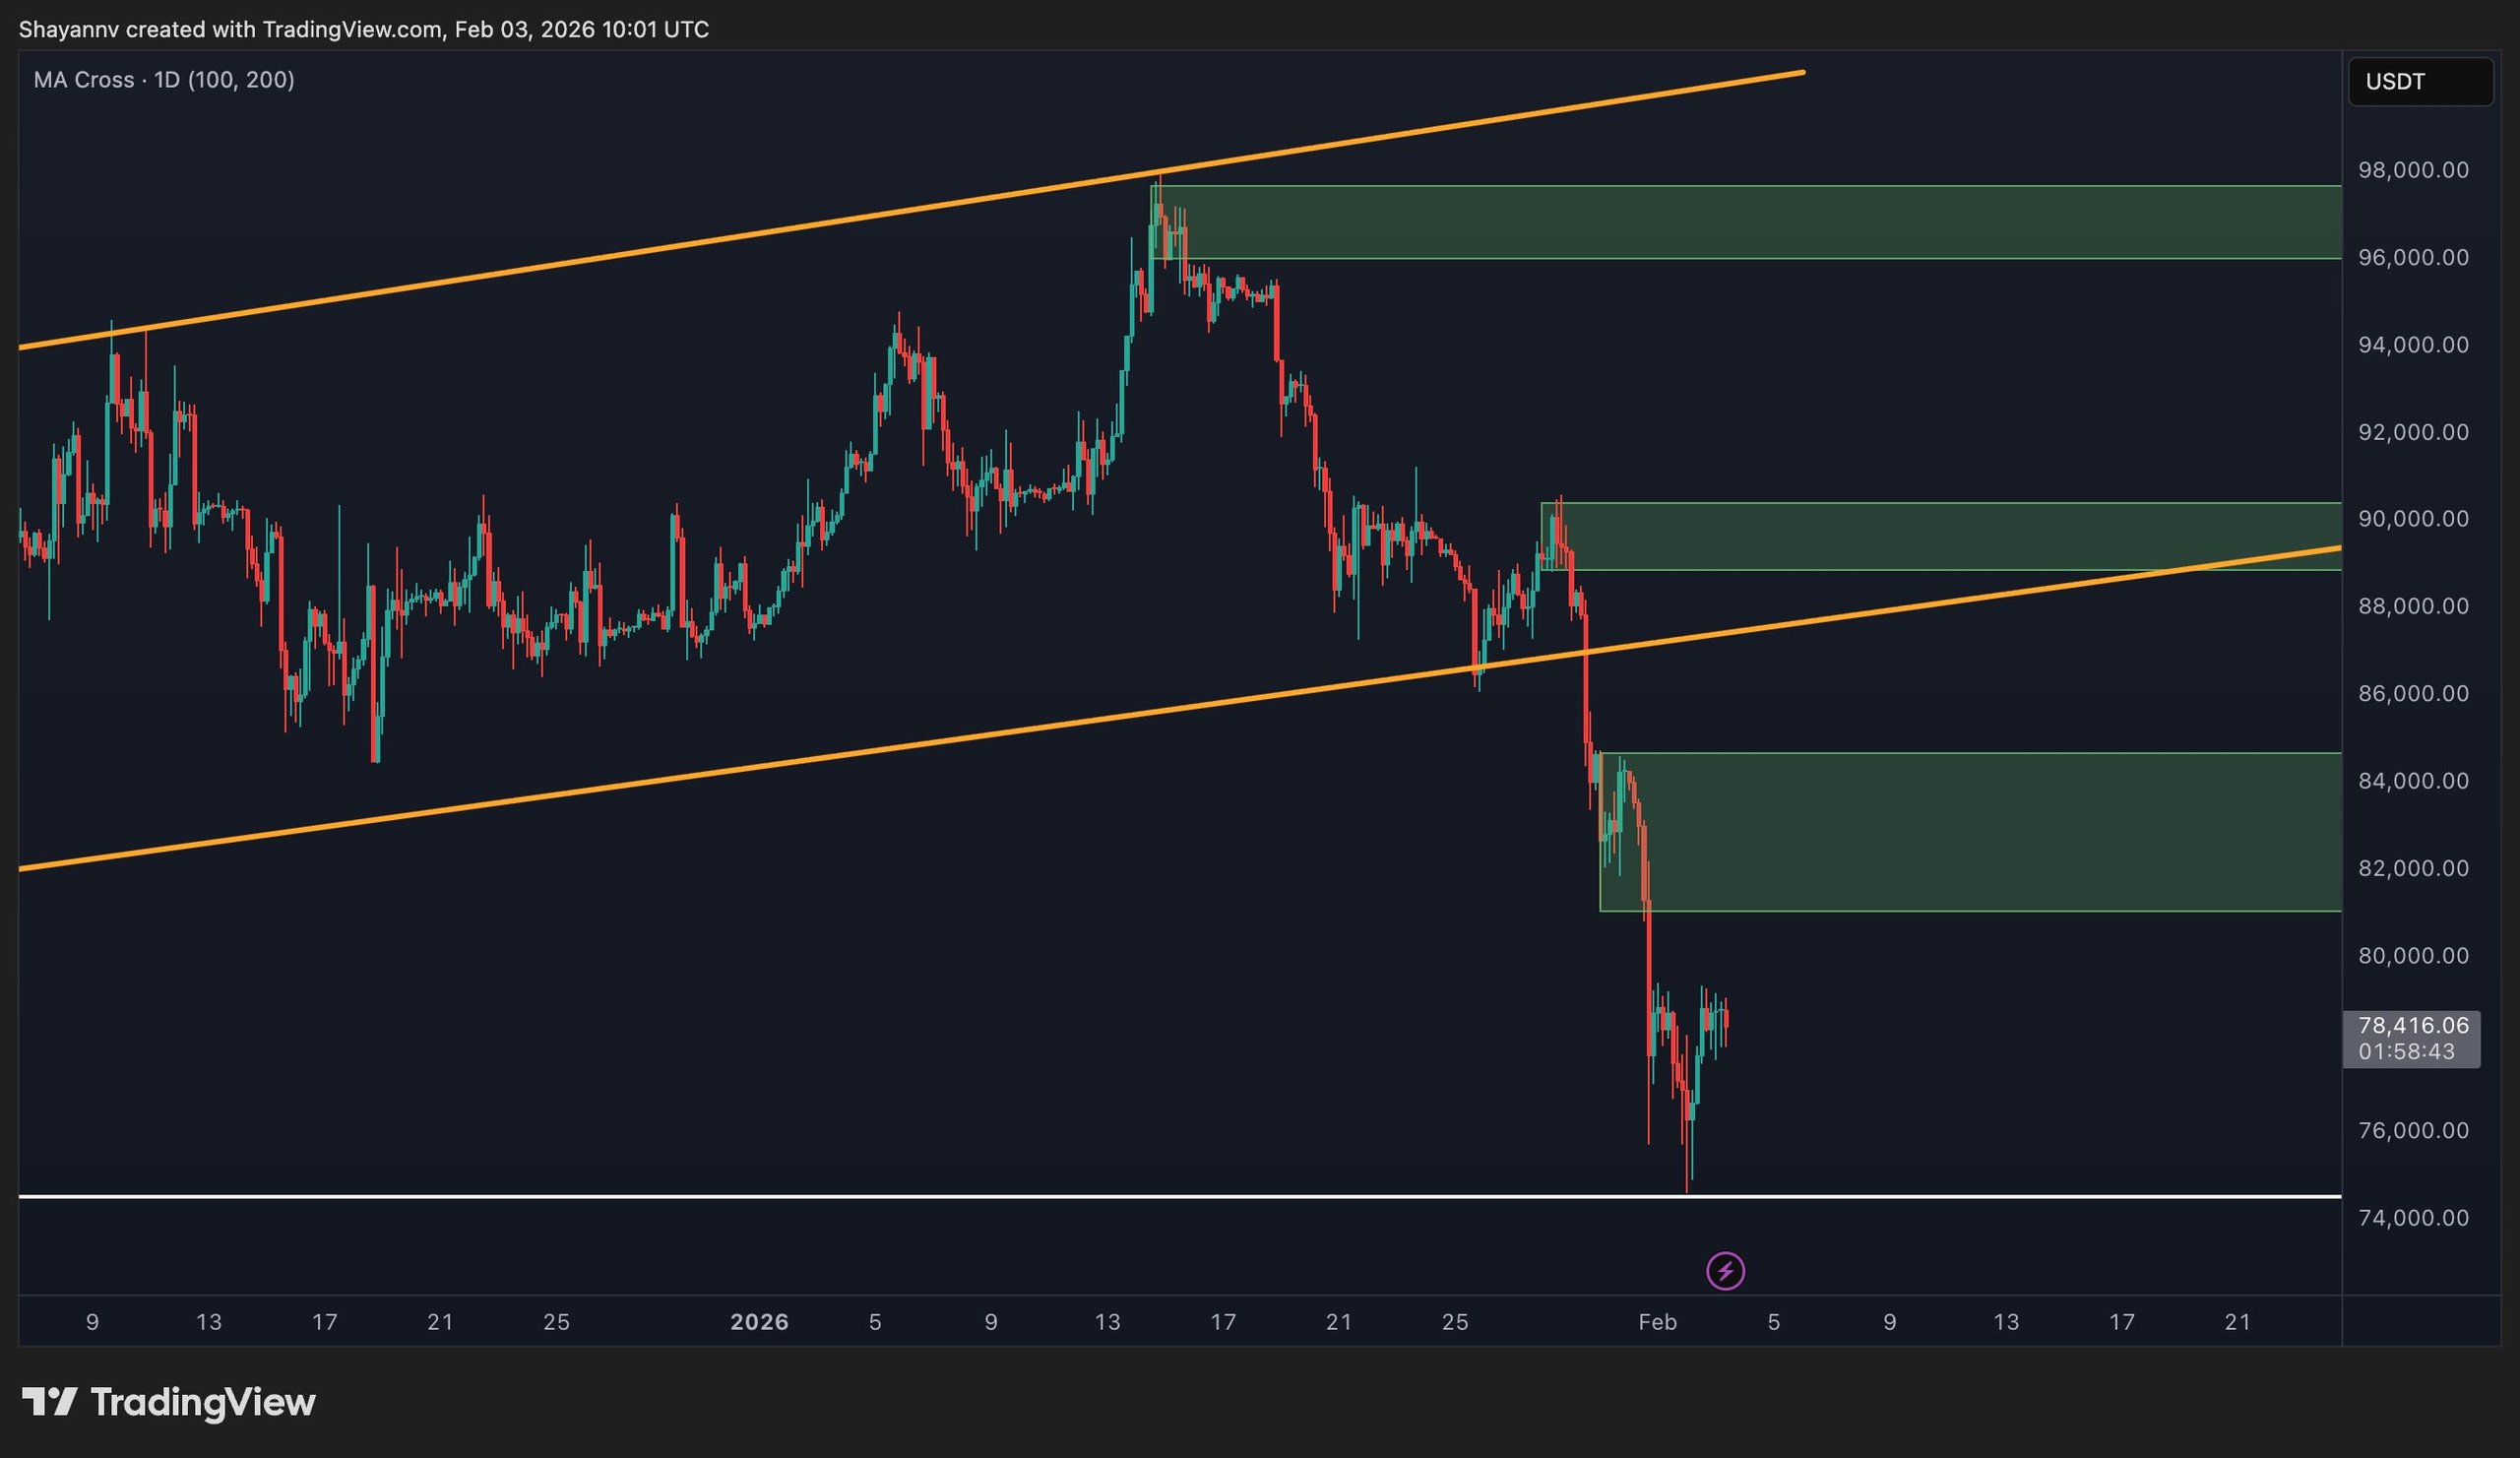
A closer inspection of the 4-hour chart indicates that BTC has likely entered a consolidating phase around the $73K level. Following steep declines, markets generally shift into a corrective range to absorb selling forces and regain momentum.
In this context, Bitcoin seems poised for a temporary range-bound movement, with a potential pullback towards the internal supply zones around $83K and $89K. Until a definitive breakout occurs, price fluctuations are anticipated to remain confined within the $73K–$89K range, with the next directional movement dependent on market reactions at these significant levels.
 BTC 4H Chart
Sentiment Analysis
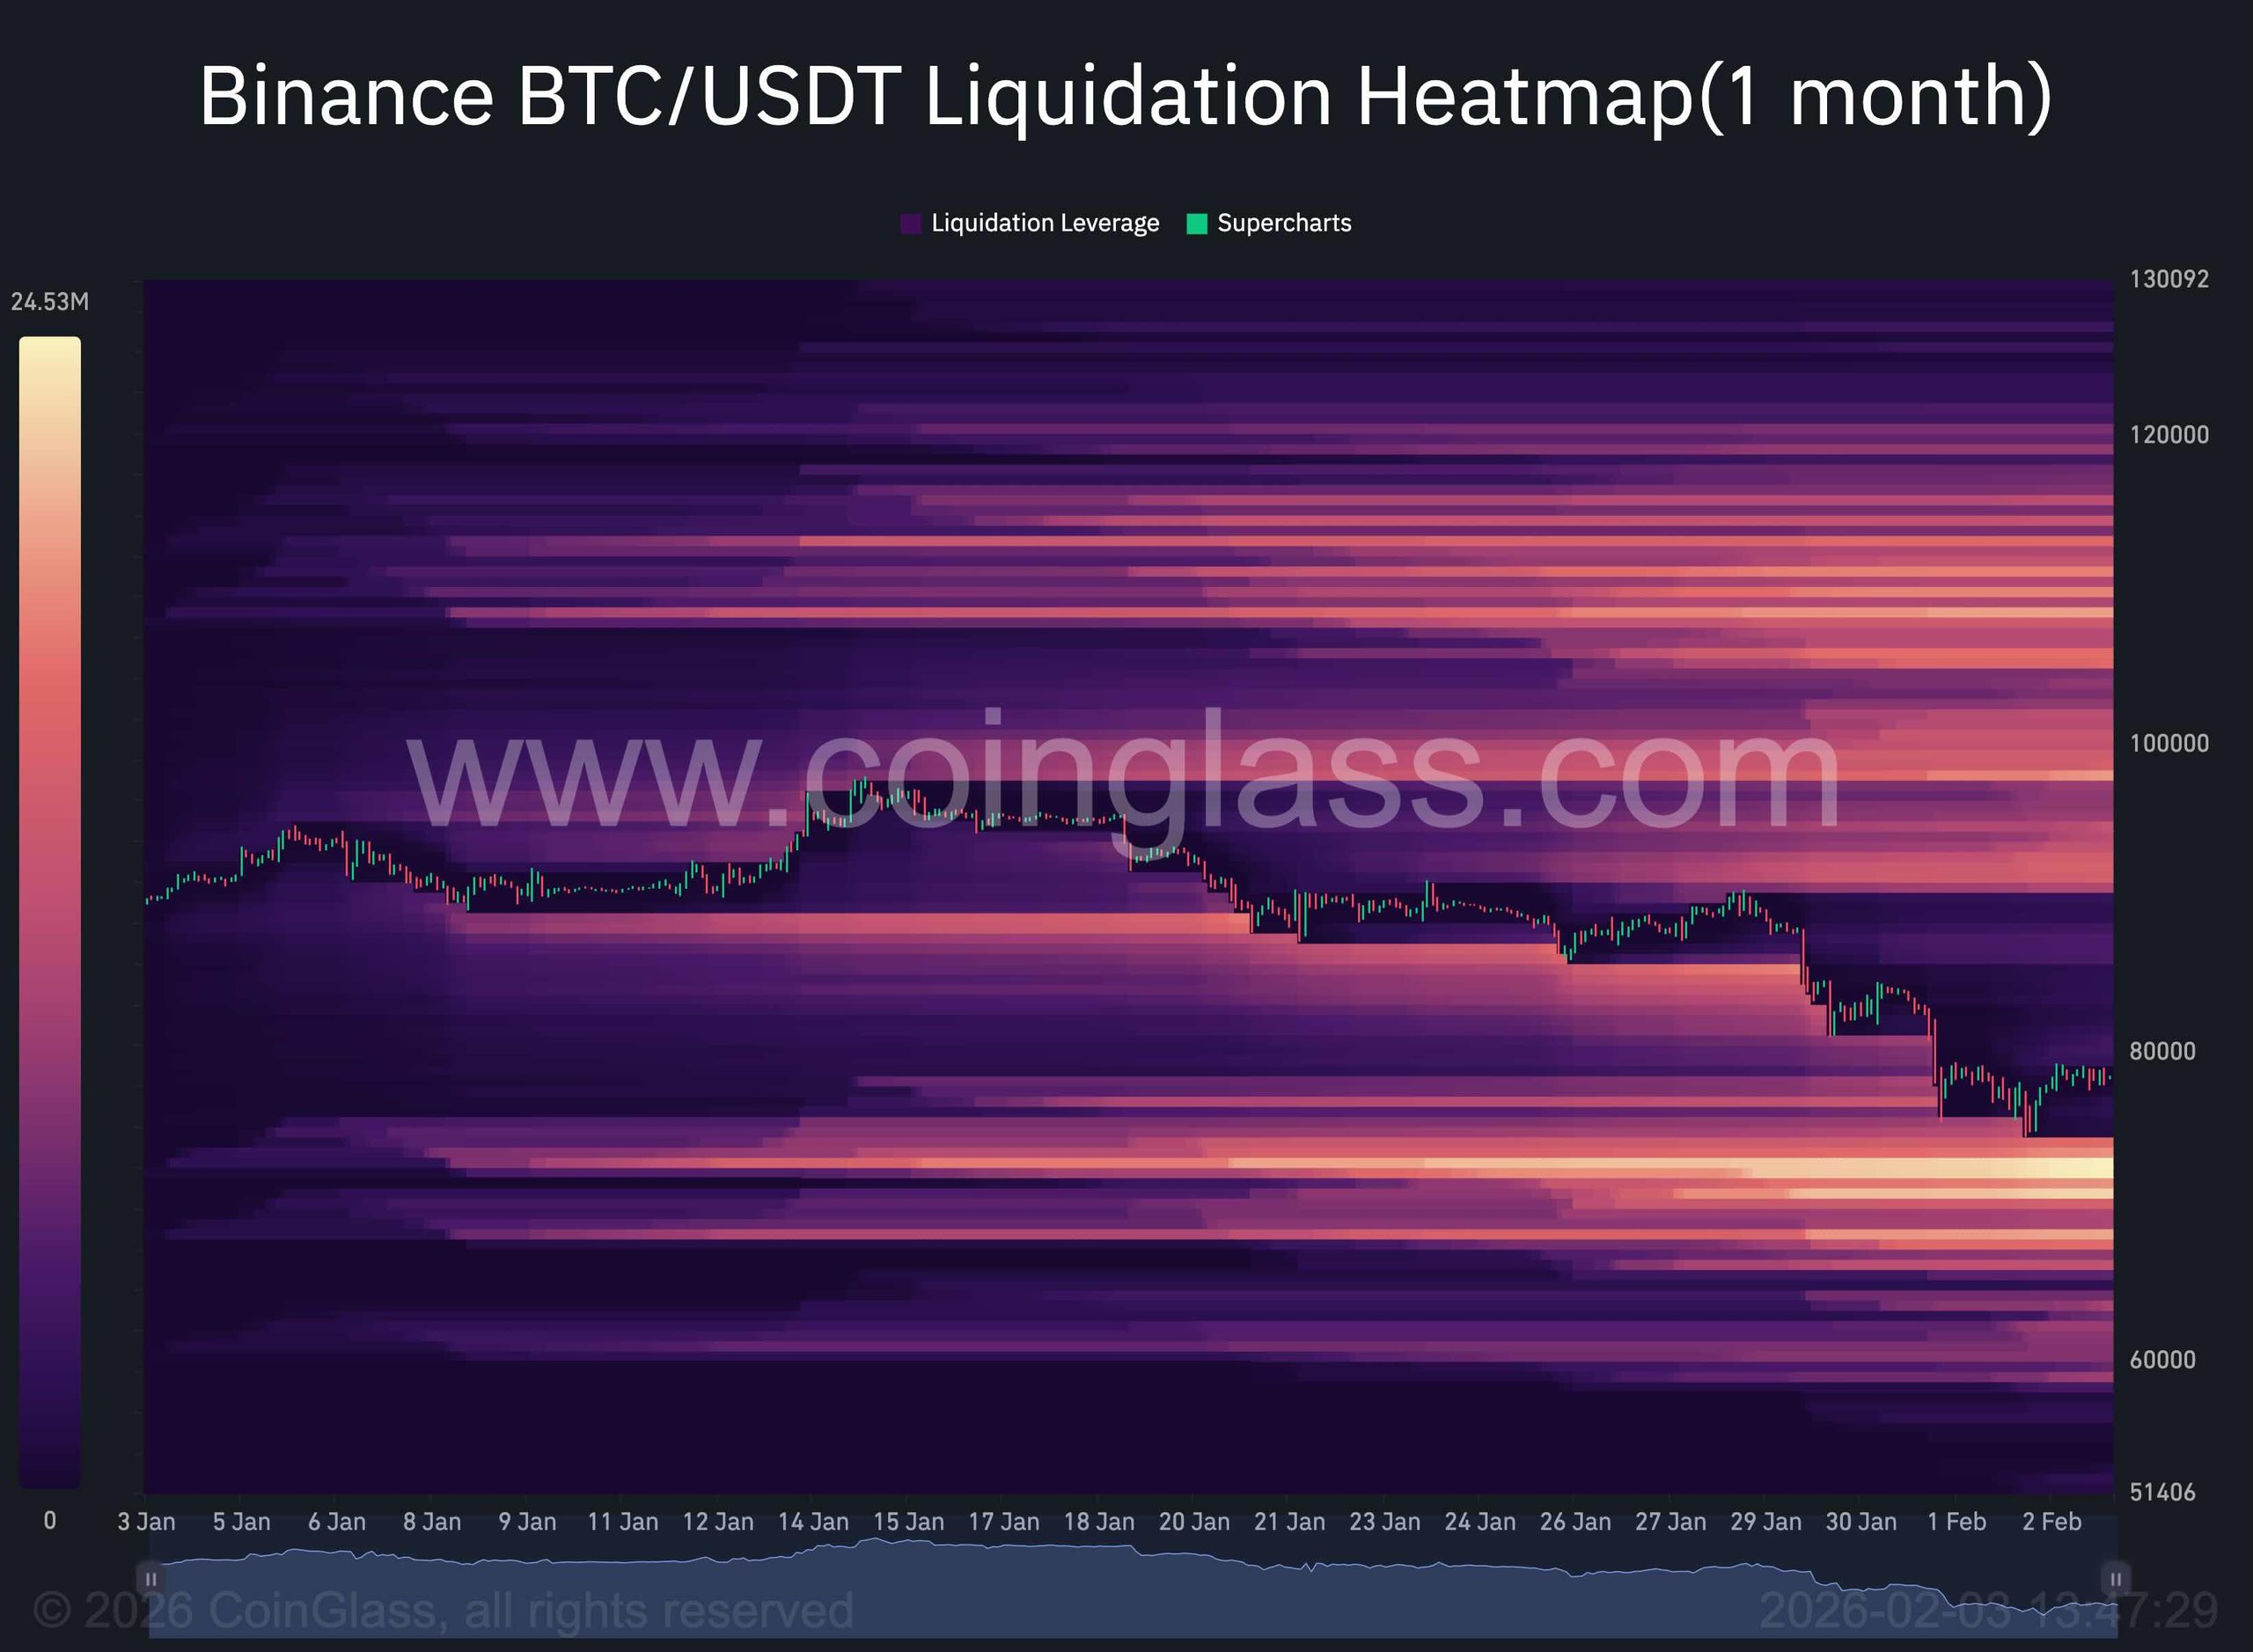
The liquidation heatmap illustrates a distinct liquidity cluster beneath the recent market low, with the heaviest concentration extending towards the $70K area. This domain holds a large cache of leverage connected to at-risk long positions. In bearish or risk-averse conditions, such liquidity pockets tend to act as targets, as market prices generally gravitate toward levels where forced liquidations can supply liquidity to larger players.
Although the recent downturn has initiated a liquidation cascade, the heatmap indicates that the complete clearing of downside liquidity has yet to occur. After a brief thinning of liquidity below current price points, leverage significantly builds closer to $70K, increasing the odds of a deeper pullback in the coming months. Should prices remain feeble and fail to regain higher liquidity tiers, this lower cluster may ultimately function as an absorption zone, where selling pressures meet stronger buying interest, stabilizing the price after the decline.
 Liquidity Heatmap
