Ethereum Faces Significant Resistance as Bulls Struggle Below Key Level
A detailed analysis of Ethereum's price action reveals ongoing bearish trends and critical resistance levels.


Ethereum Price Dynamics
Ethereum is currently experiencing downward pressure following a significant sell-off, with prices now trading below previous support levels. Investors are closely observing Ethereum’s reaction within crucial demand and liquidity zones, especially after recent liquidations.
Daily Chart Insights
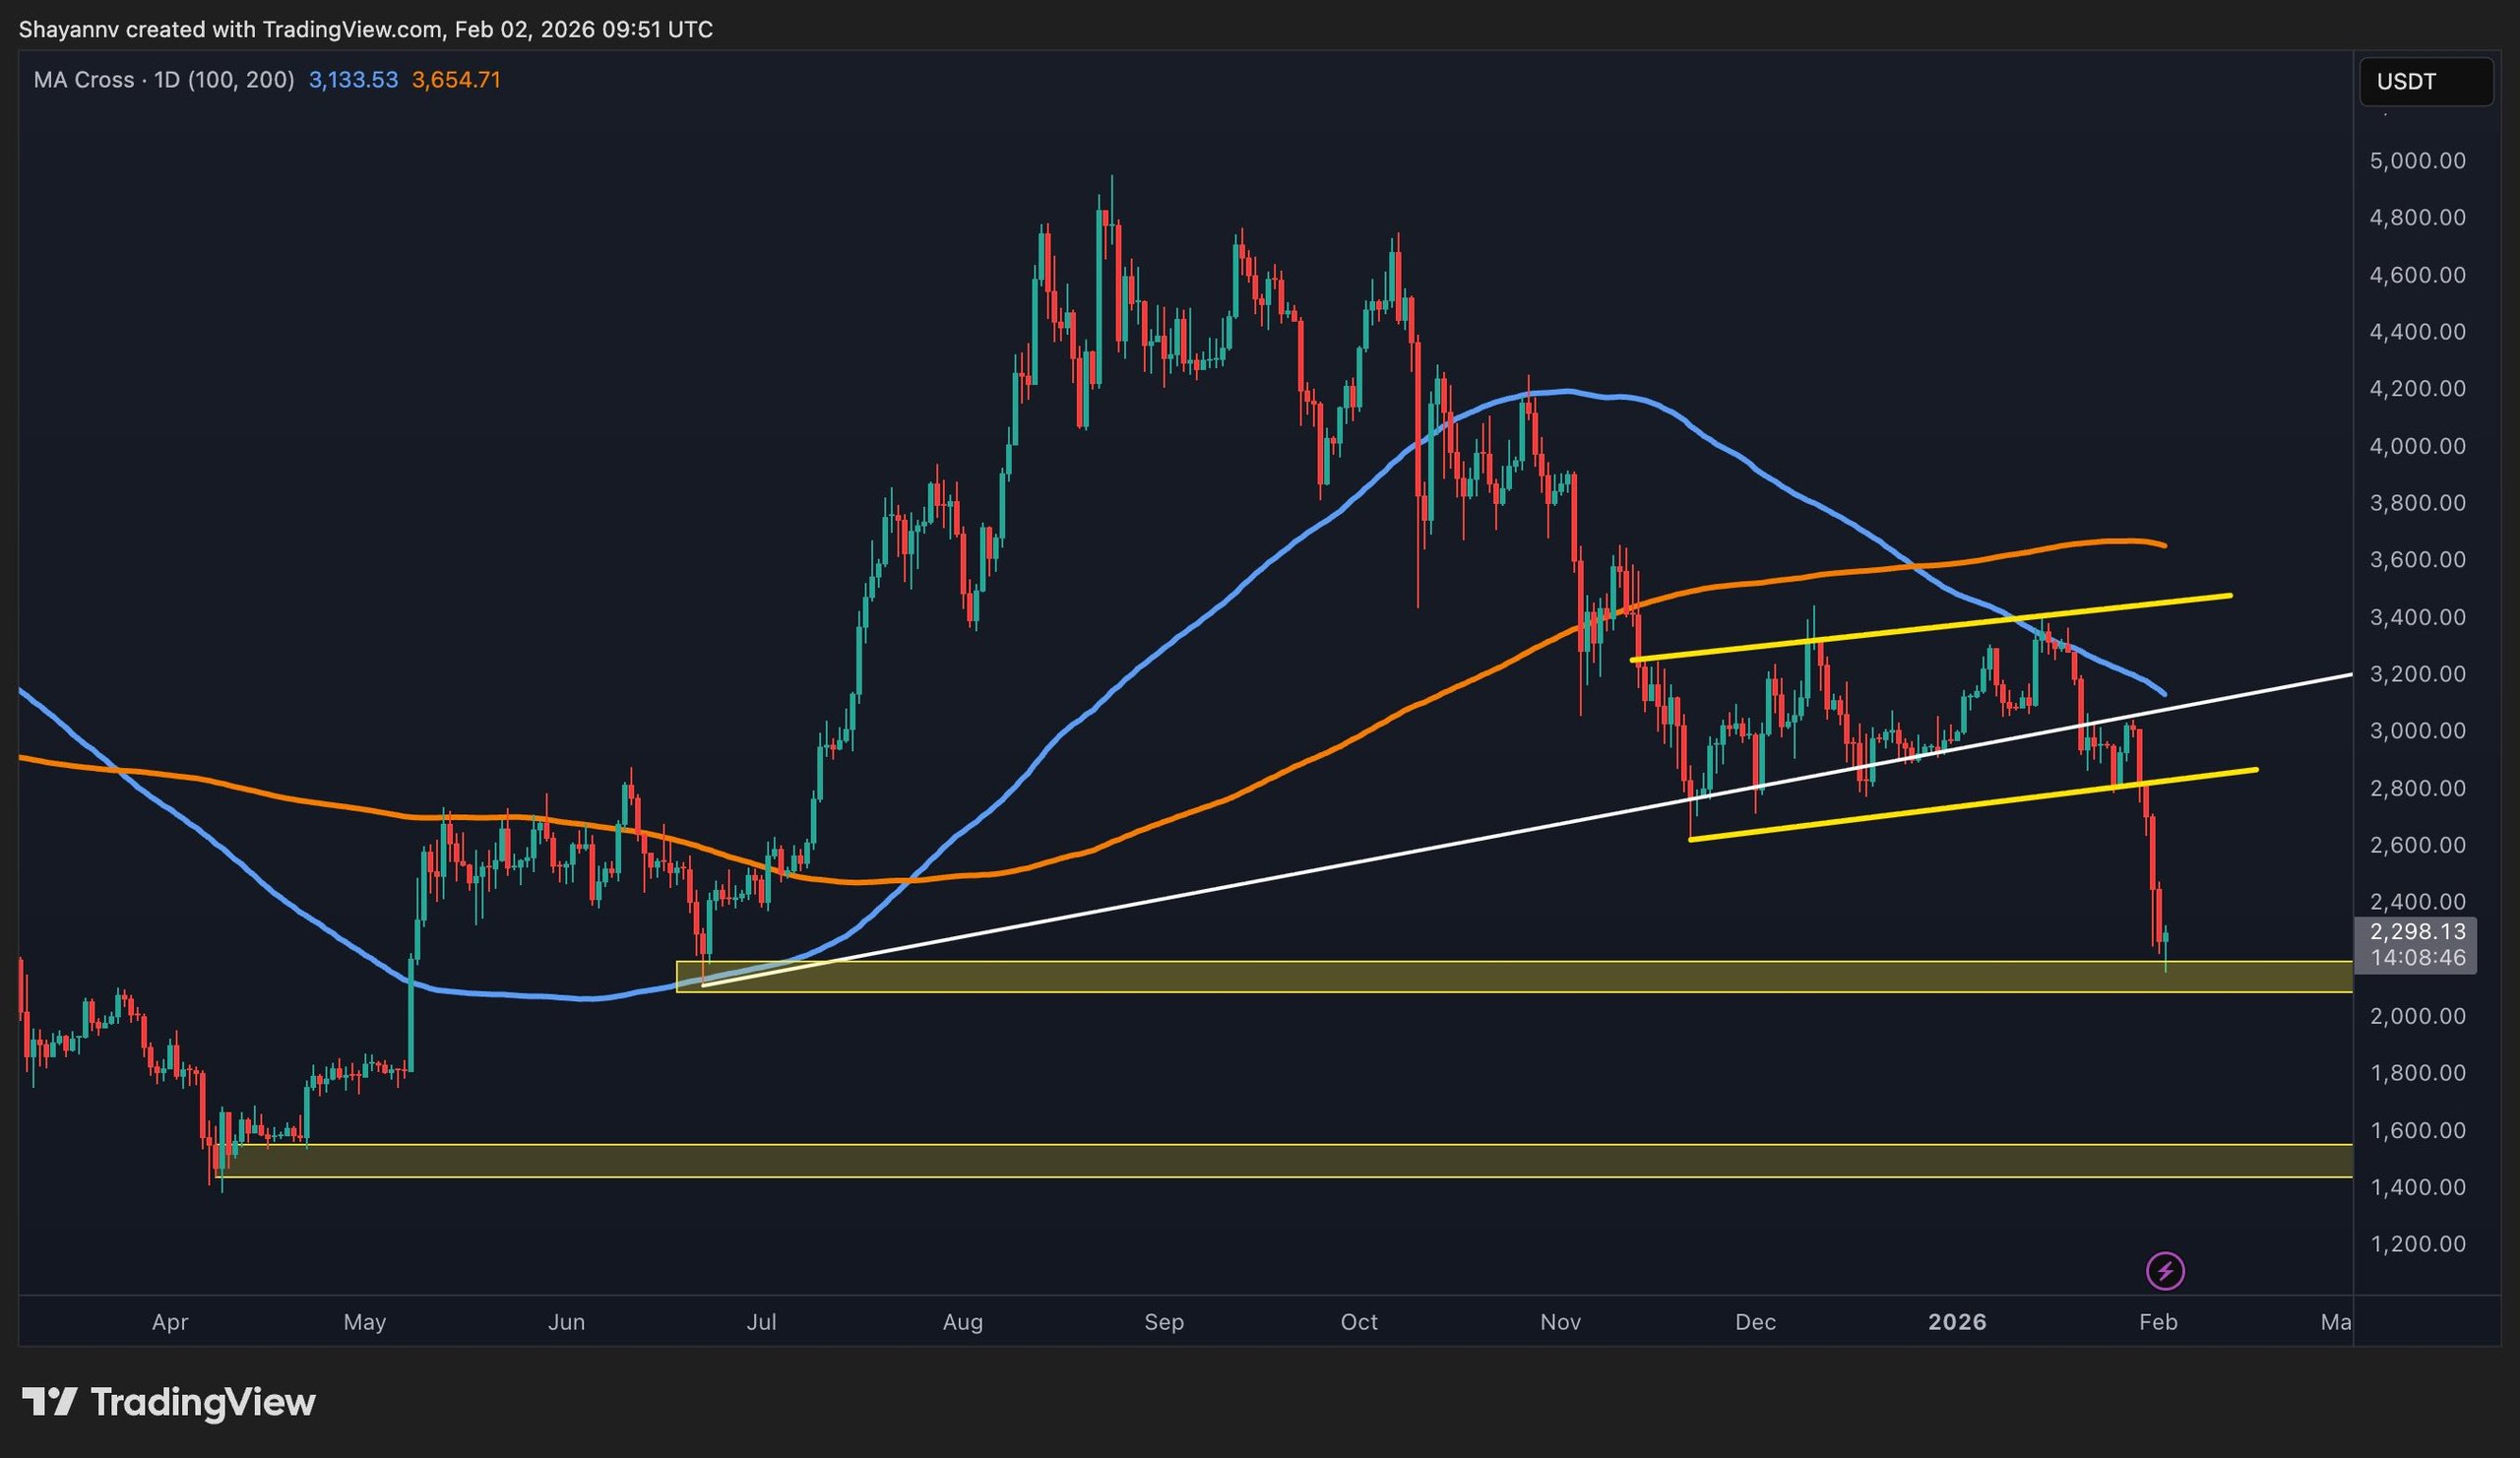
On the daily chart, Ethereum shows a bearish trend after it failed to sustain above the critical support level at $2,500. The price’s rejection from the $3,300–$3,400 range indicates that sellers have regained control.
Currently, Ethereum is testing a notable demand zone between $2,100 and $2,200, an area that has been significant in previous market behaviors. This abrupt movement into the demand zone hints at forced selling rather than a typical market distribution, raising the chances of a short-term price rebound.
Nevertheless, Ethereum’s position below the $3,000–$3,100 threshold and declining moving averages suggests that any recovery should be perceived as a correction within an overall bearish trend.
Daily Chart
4-Hour Chart Overview
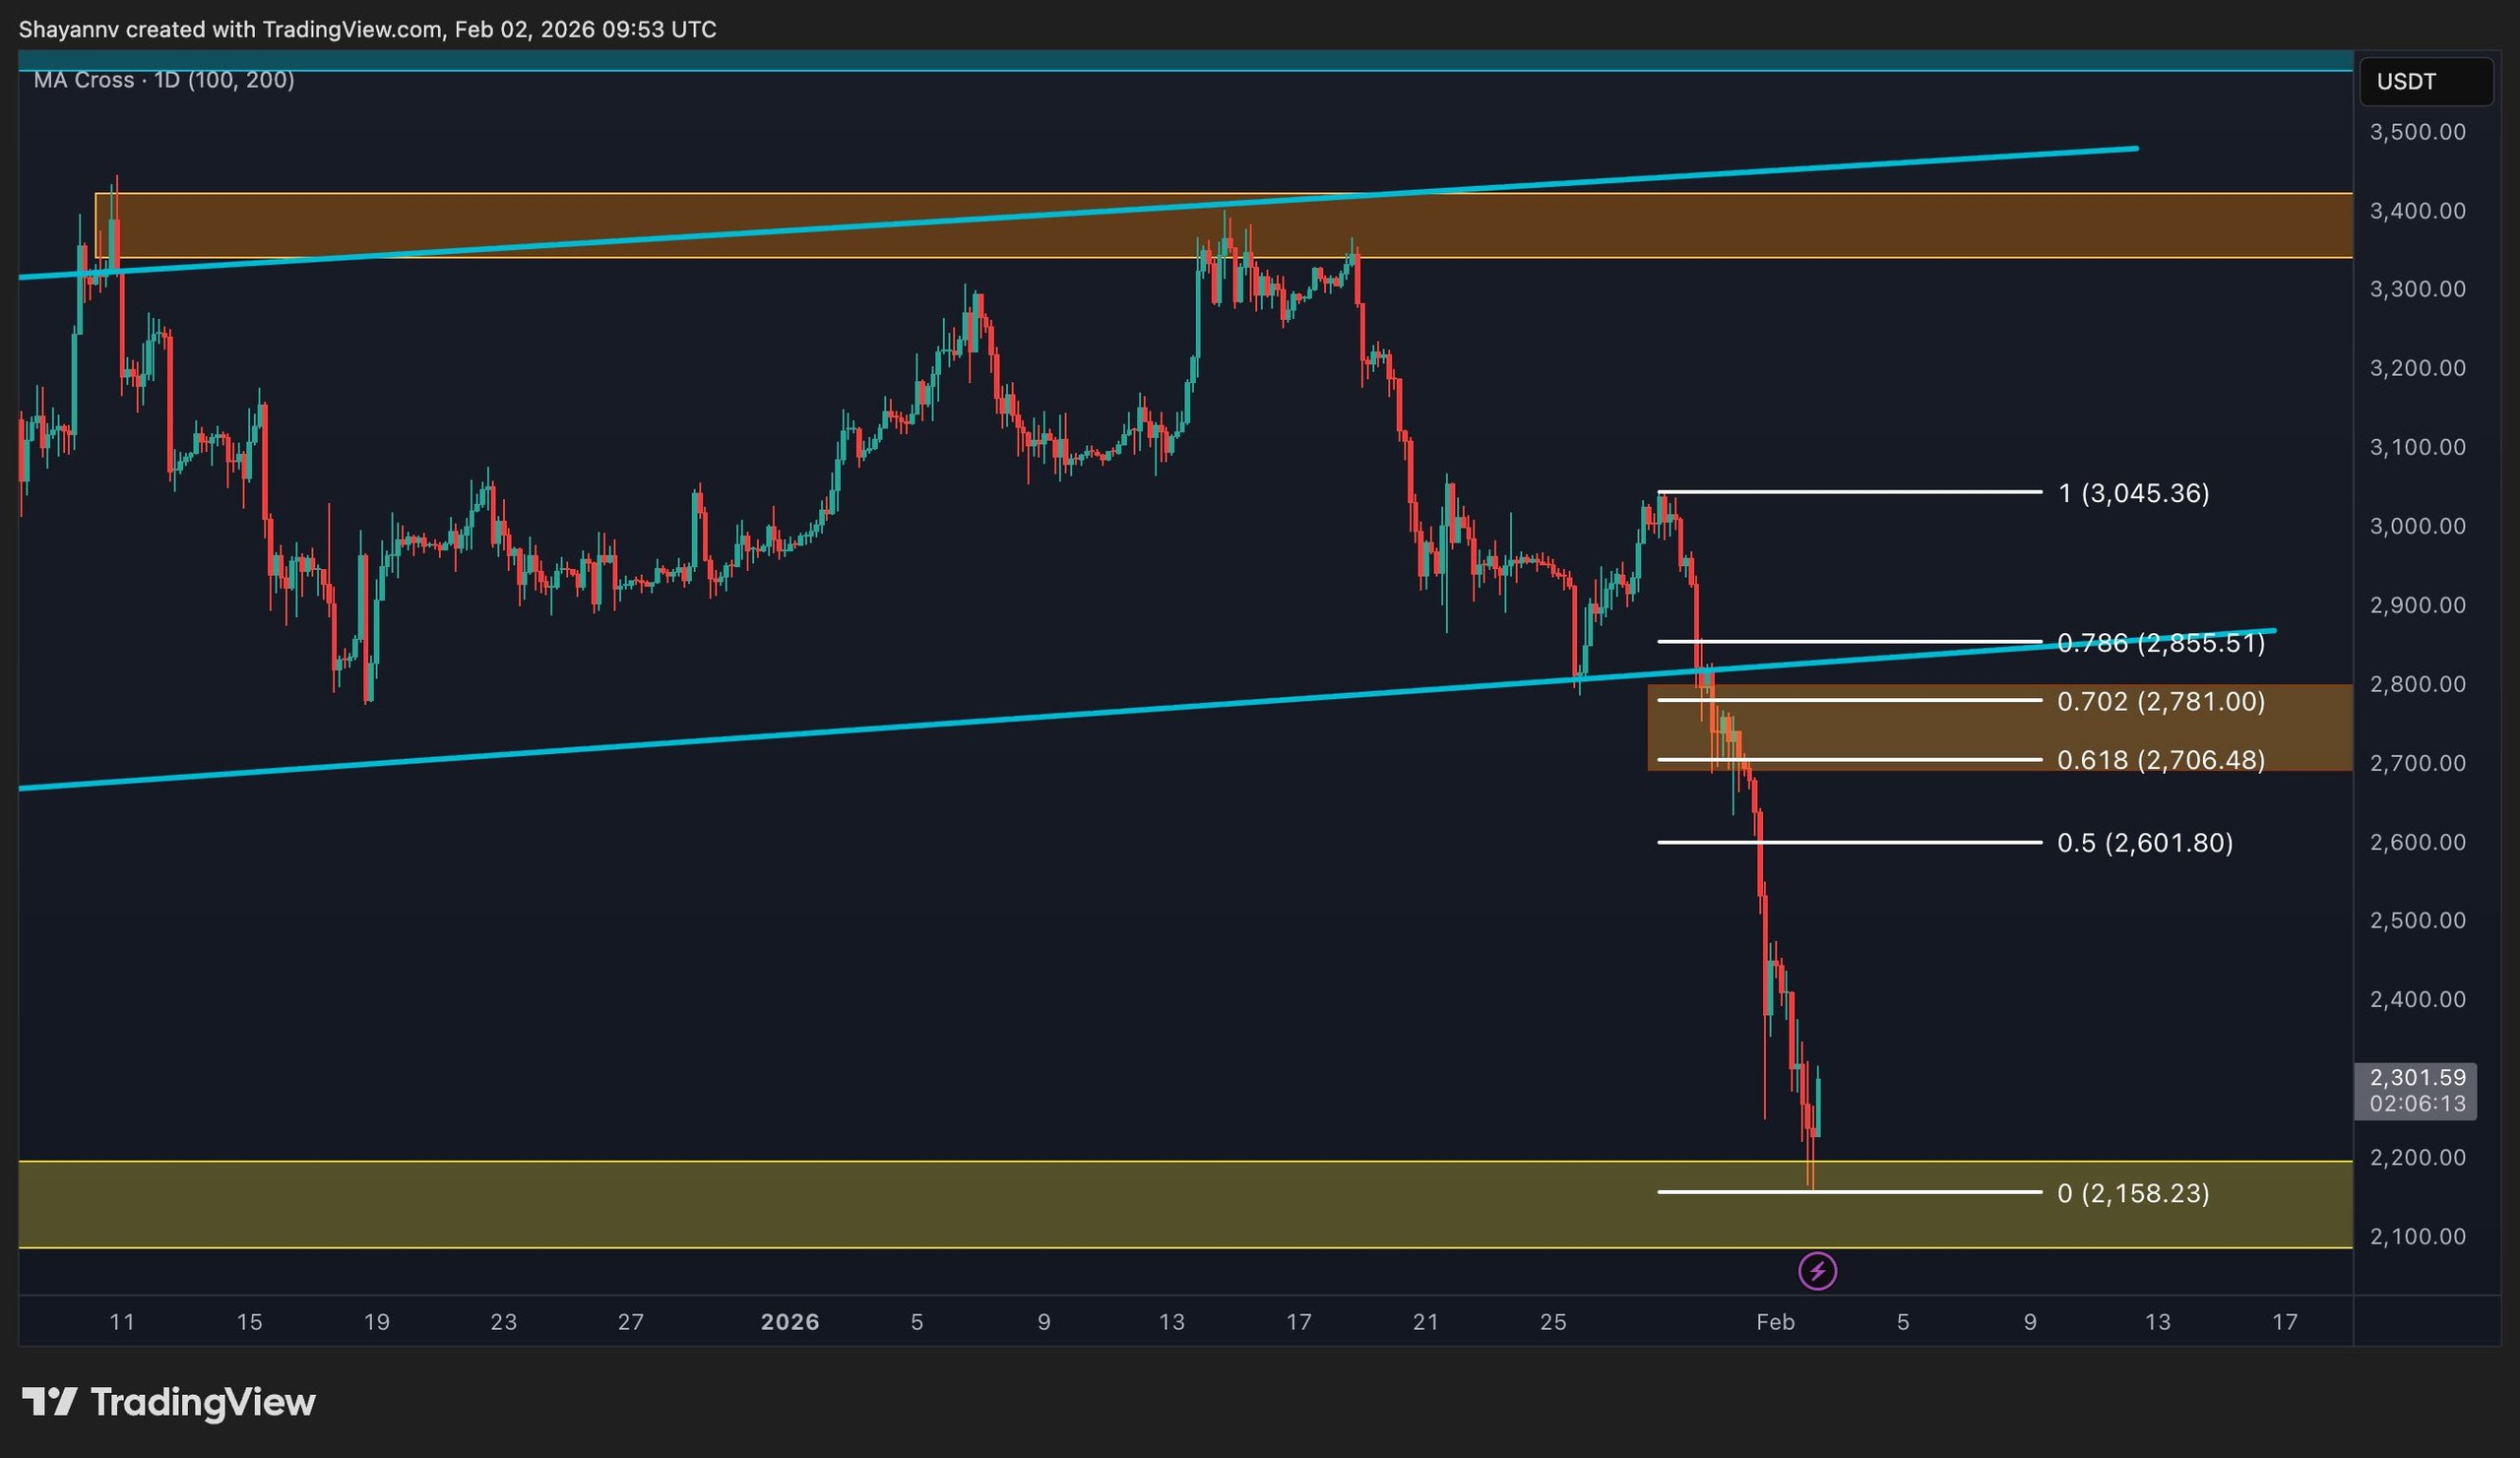
The recent sell-off on the 4-hour chart occurred almost vertically, revealing numerous untested inefficiencies and supply zones above current prices. Following the sharp drop to the $2,100 level, Ethereum is showing initial signs of stabilization, yet the prevailing structure remains firmly bearish.
A technical retracement towards the Fibonacci levels is anticipated, specifically targeting the $2,700–$2,850 zone, which aligns with previous supply issues. This level also marks broken support, suggesting it may become future resistance.
 4-Hour Chart
Sentiment Analysis
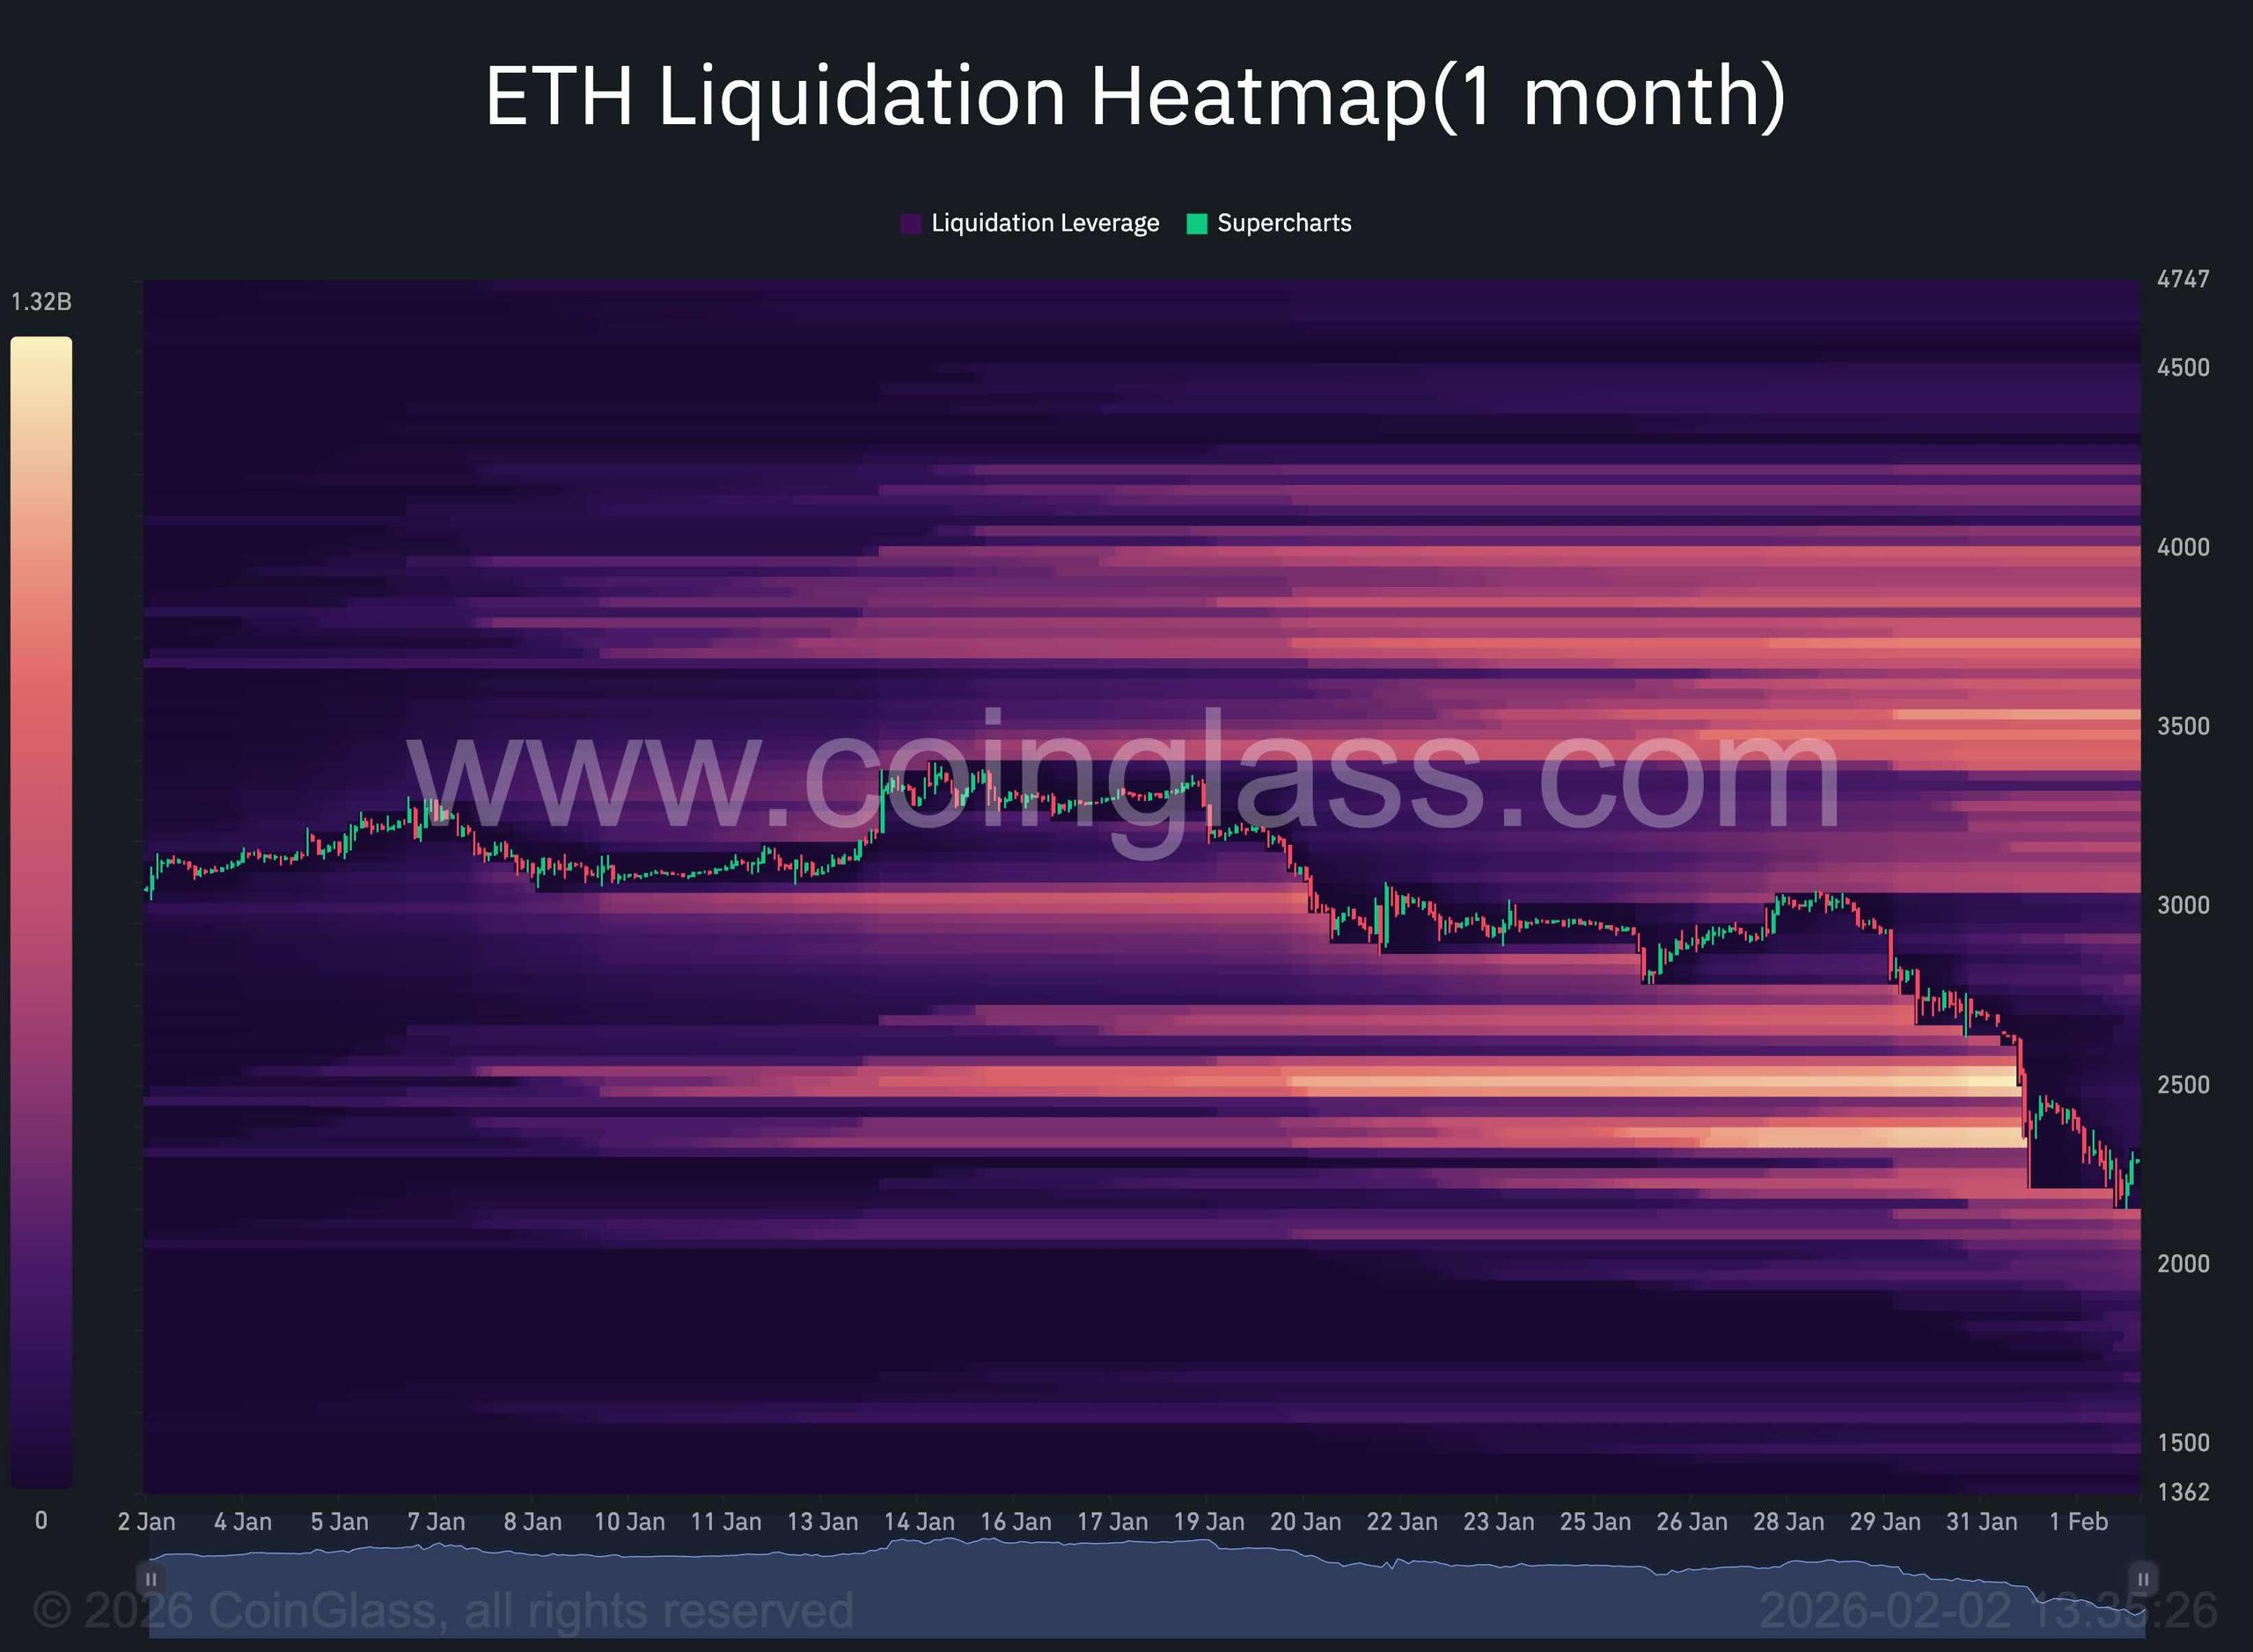
The Ethereum liquidation map indicates a significant liquidity sweep below the $2,500 level, leading to a cascade of long liquidations. This movement reflects a typical long liquidation scenario, with the price declining further as margin calls triggered the closure of leveraged positions.
While the initial sweep has taken place, residual liquidity pockets remain towards the $2,200–$2,300 region, highlighting this area as a potential short- to mid-term target within the ongoing bearish trend.
 Liquidation Heatmap
Disclaimer: The analysis presented is meant for informational purposes only and does not constitute financial advice.
