

Ripple’s XRP continues to face significant bearish pressure, consistently printing lower lows and struggling to regain crucial supply zones. The broader market structure suggests that sellers have maintained control as the price nears a vital demand area, which could influence the next major price movement.
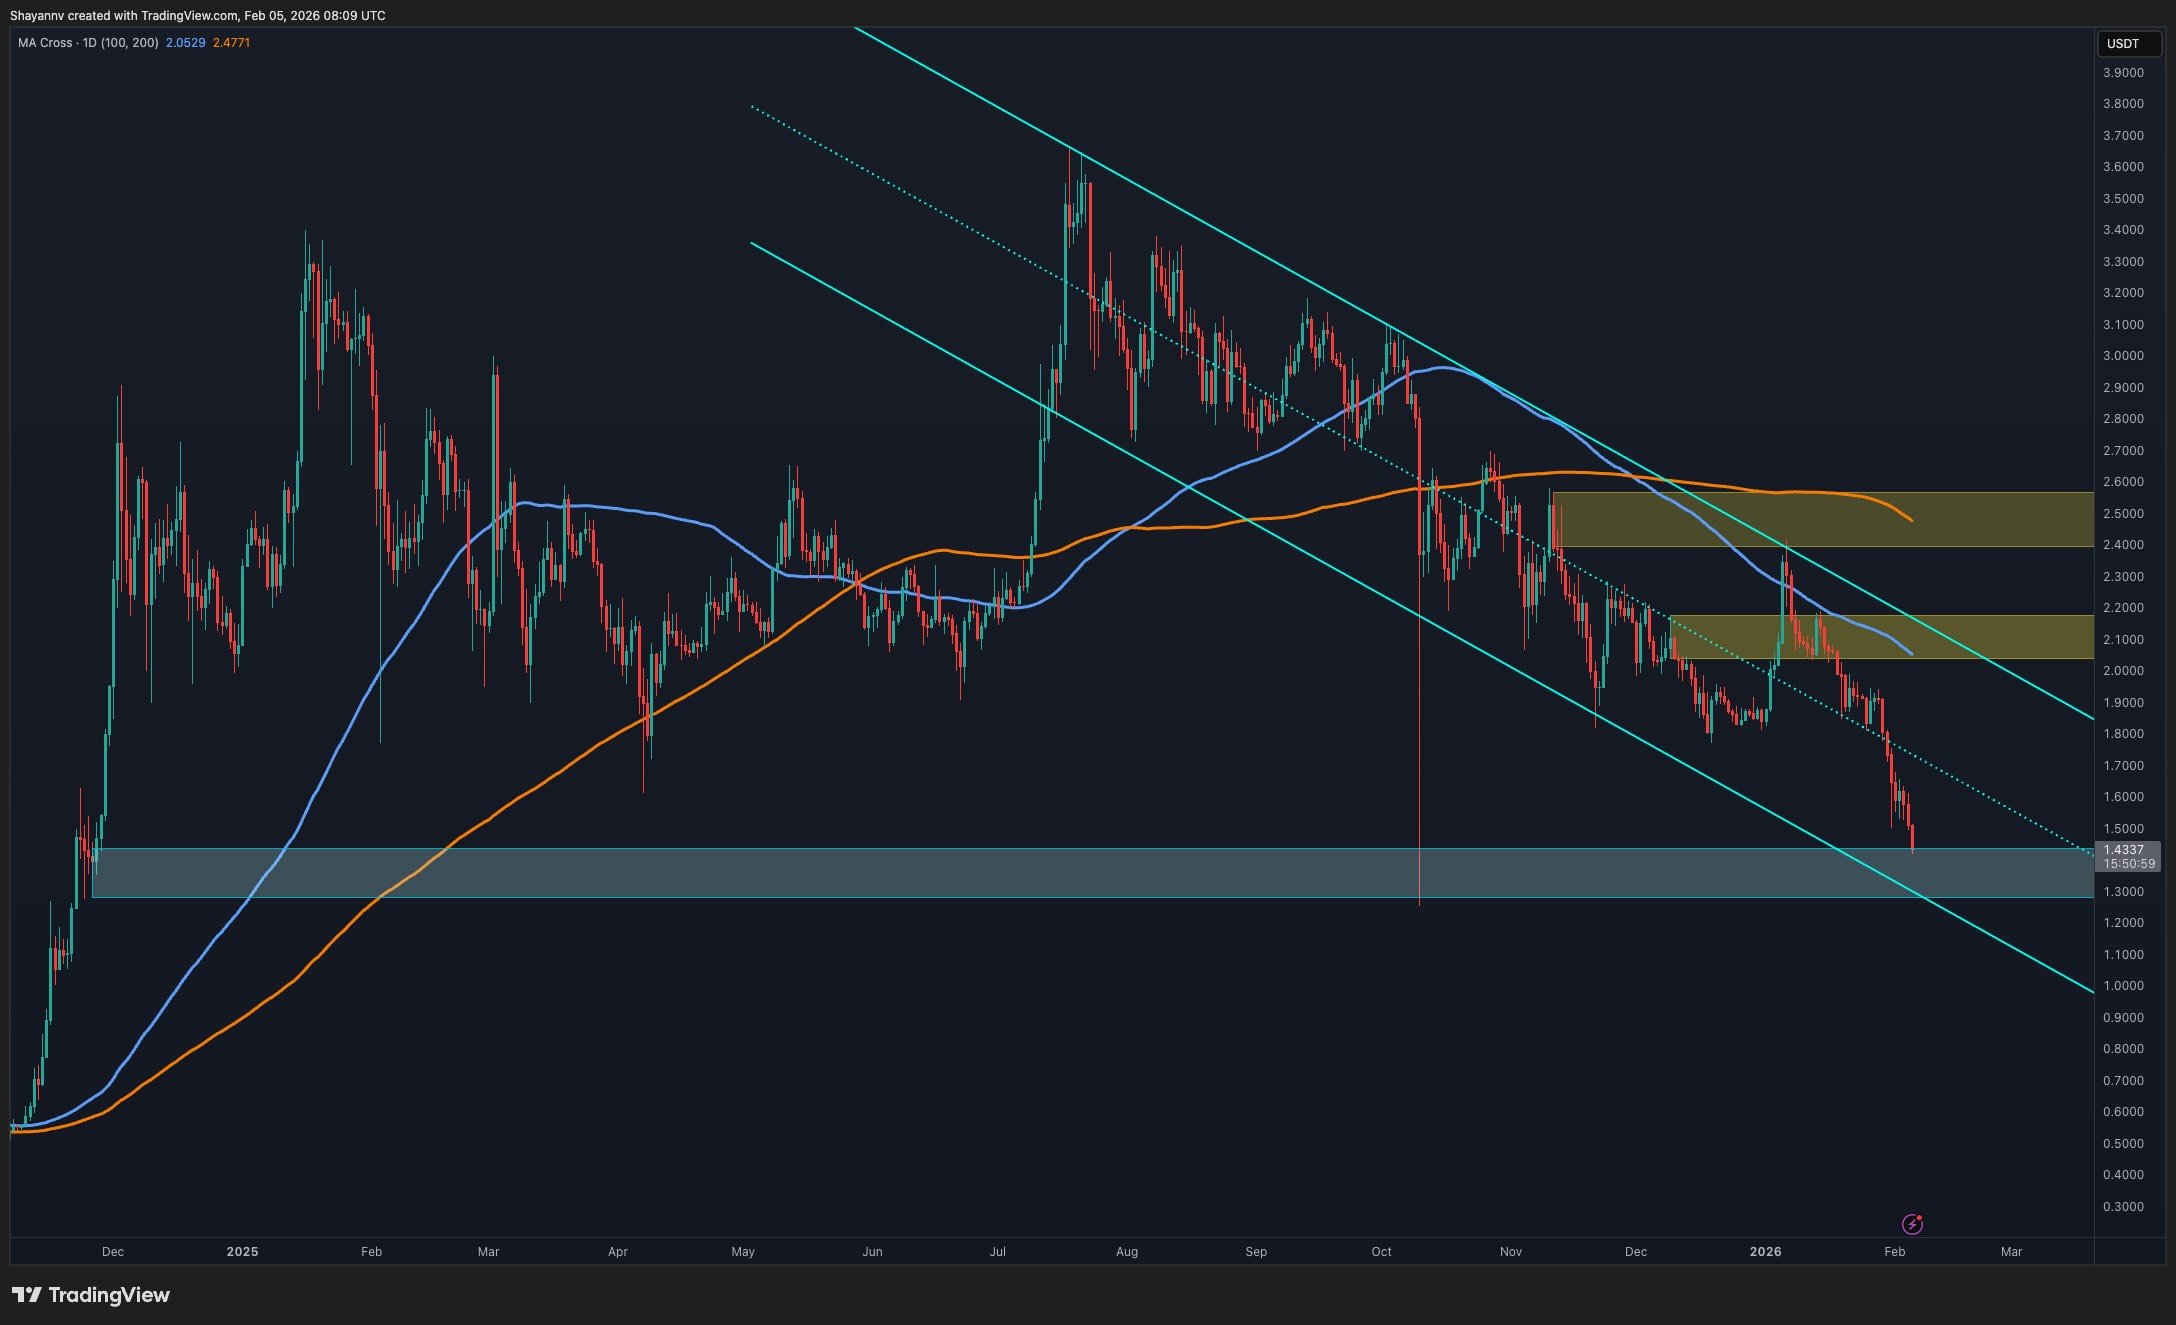
Ripple Price Overview: Daily Chart
Currently, XRP is entrenched in a bearish market structure on the daily chart, having breached multiple previous support levels, which have now turned into resistance. The price is now pressing against a well-defined demand zone near $1.3—a level that previously functioned as a base before the last upward movement. This zone is critical, as it may be the first area where buyers could potentially intervene to halt the ongoing decline.
However, the broader daily trend remains decidedly bearish. Historical corrective bounces have consistently fallen short, capped by lower resistance zones. As long as XRP remains beneath the $1.6 mid-trendline, any rebounds from the current demand level should be regarded as temporary corrections rather than signs of a trend reversal.
A break below this demand zone would undermine existing market structures and pave the way for further declines toward untested liquidity levels. Conversely, a robust daily bounce from this area is necessary to indicate short-term relief, though this would not confirm a trend reversal just yet.
Daily Chart
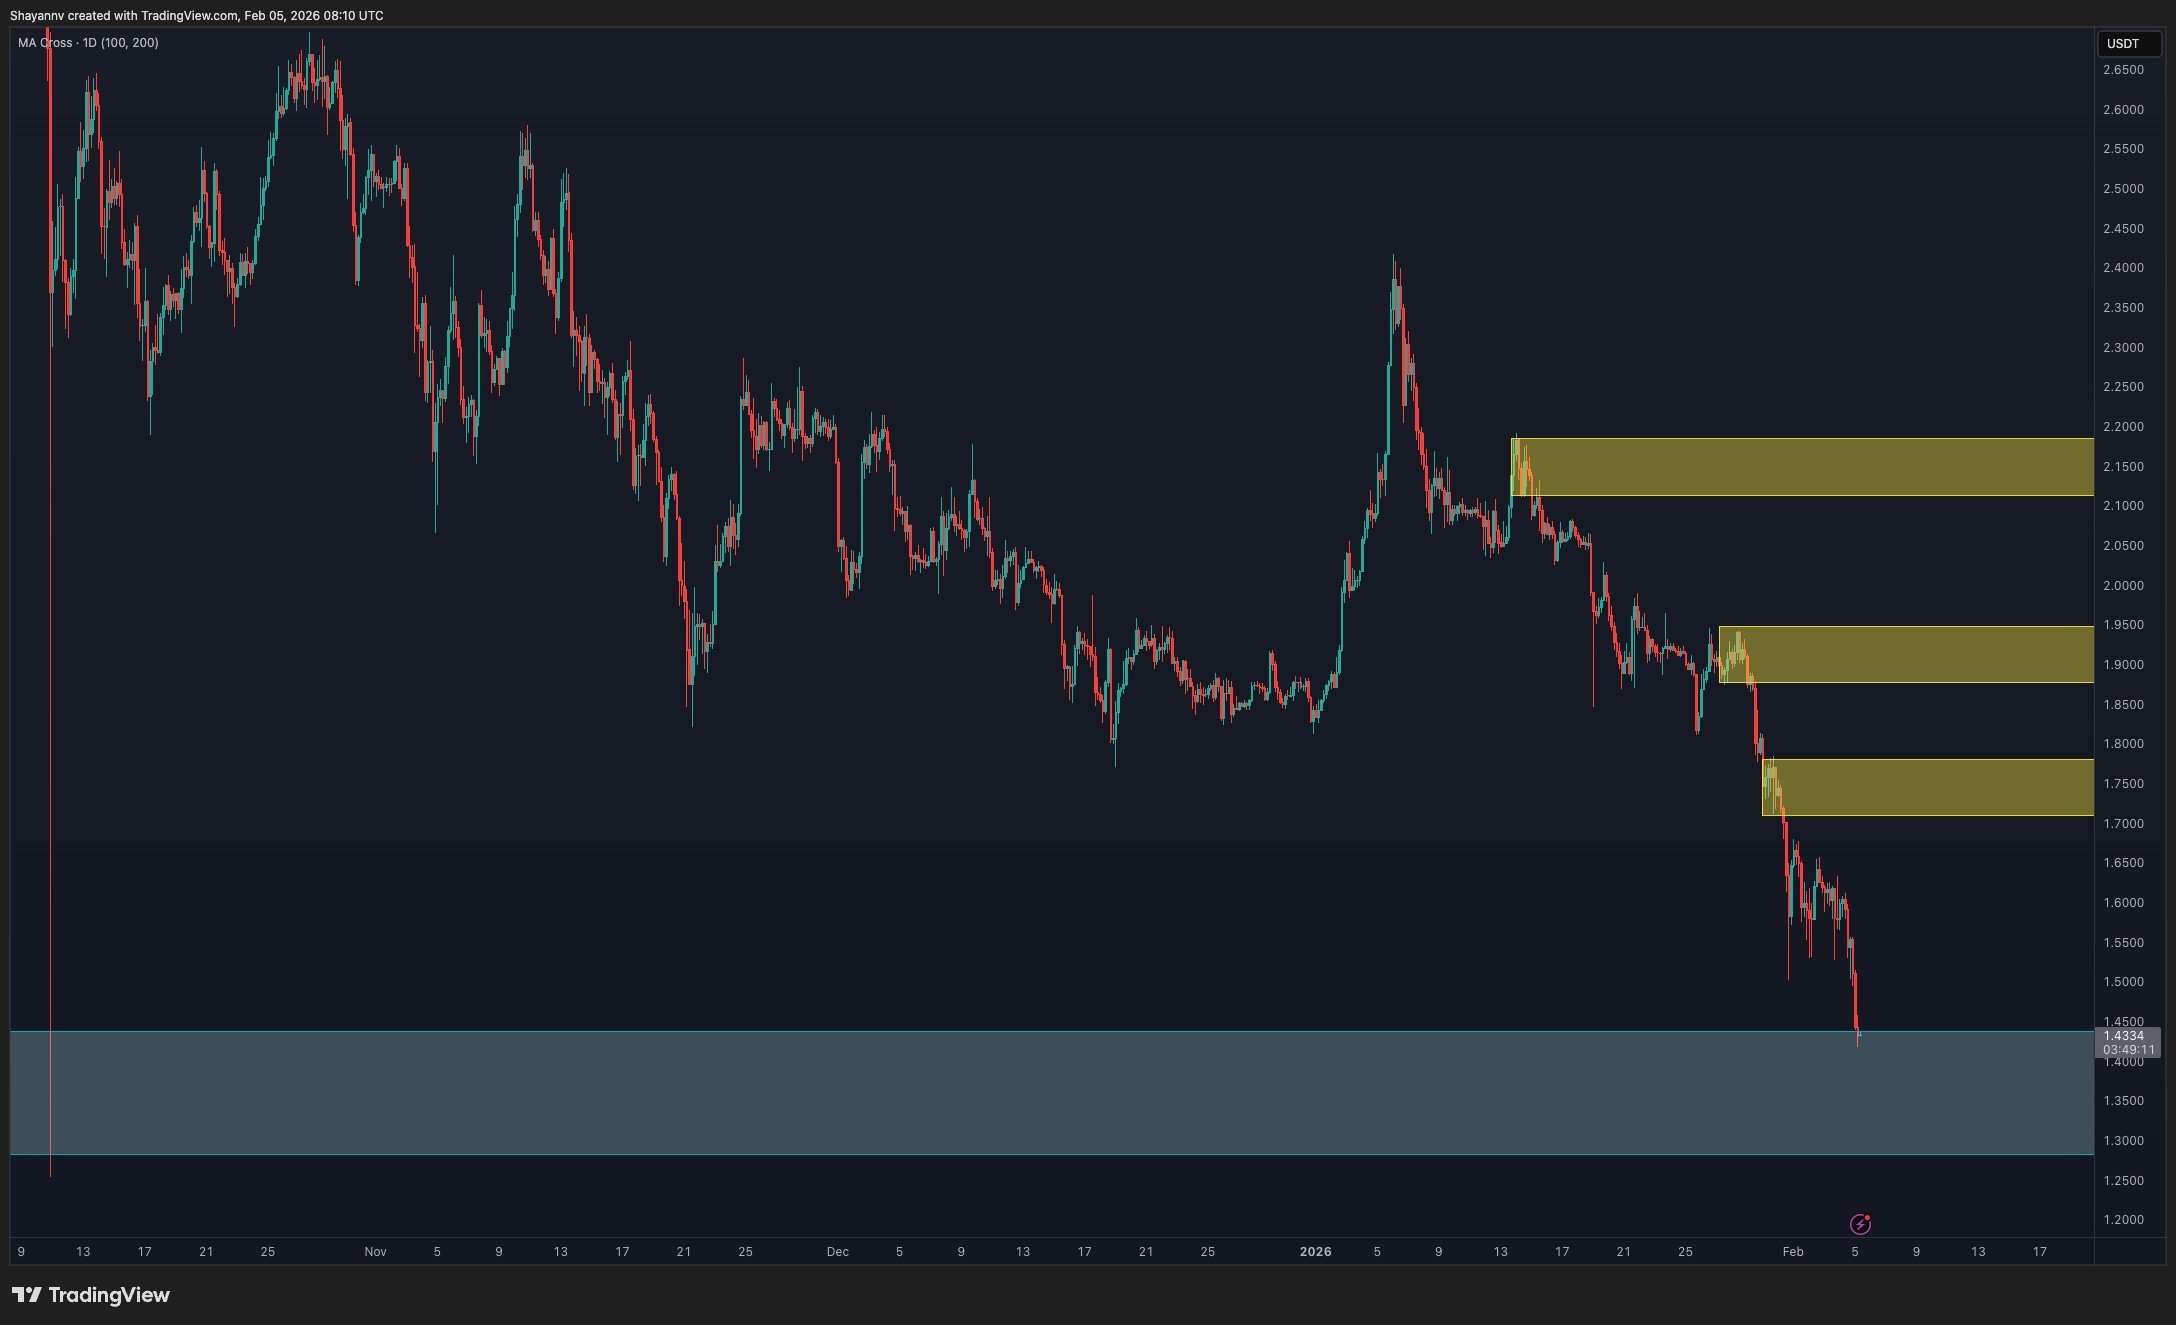
XRP/USDT 4-Hour Chart
The 4-hour chart reveals additional details regarding the internal downtrend. Recent price actions demonstrate bearish rejections at successive supply zones, indicating that sellers are vigorously defending these levels. Following a recent rejection, XRP has continued to decline and is nearing the pivotal $1.3 support level, which aligns with the broader daily demand zone.
The convergence of these factors heightens the likelihood of a reaction, with short sellers possibly taking profits while reactive buyers might enter the market. However, the presence of stacked supply zones above the current price at $1.6 and $2 significantly constrains the potential for any upside in the short term. Any recovery towards these levels is likely to encounter renewed selling pressure unless there is a definitive break upwards and acceptance above the channel.
Until that confirmation arrives, the 4-hour trend remains firmly bearish, with any rebounds best understood as corrective movements within the larger downtrend.
 4-Hour Chart
Disclaimer: The information included in this analysis reflects personal opinions and should not be intended as financial advice. Please conduct your own research before making investment decisions.
