Ethereum Price Outlook: Is the $1,500 Mark on the Horizon After Recent Market Turmoil?
Ethereum has experienced a significant decline fueled by geopolitical tensions, prompting discussions about its price trends.


Ethereum has entered a phase of aggressive deleveraging, experiencing a notable downward trend after several weeks of upper-range distribution. This decline is significantly influenced by the recent rise in geopolitical tensions in the Middle East, prompting a sell-off across various risk assets and highlighting weaknesses in the Ethereum market.
The confluence of macroeconomic uncertainties, high leverage levels, and an unclear market structure has triggered a rapid unwinding instead of a gradual decline.
Ethereum Price Analysis: Daily Chart
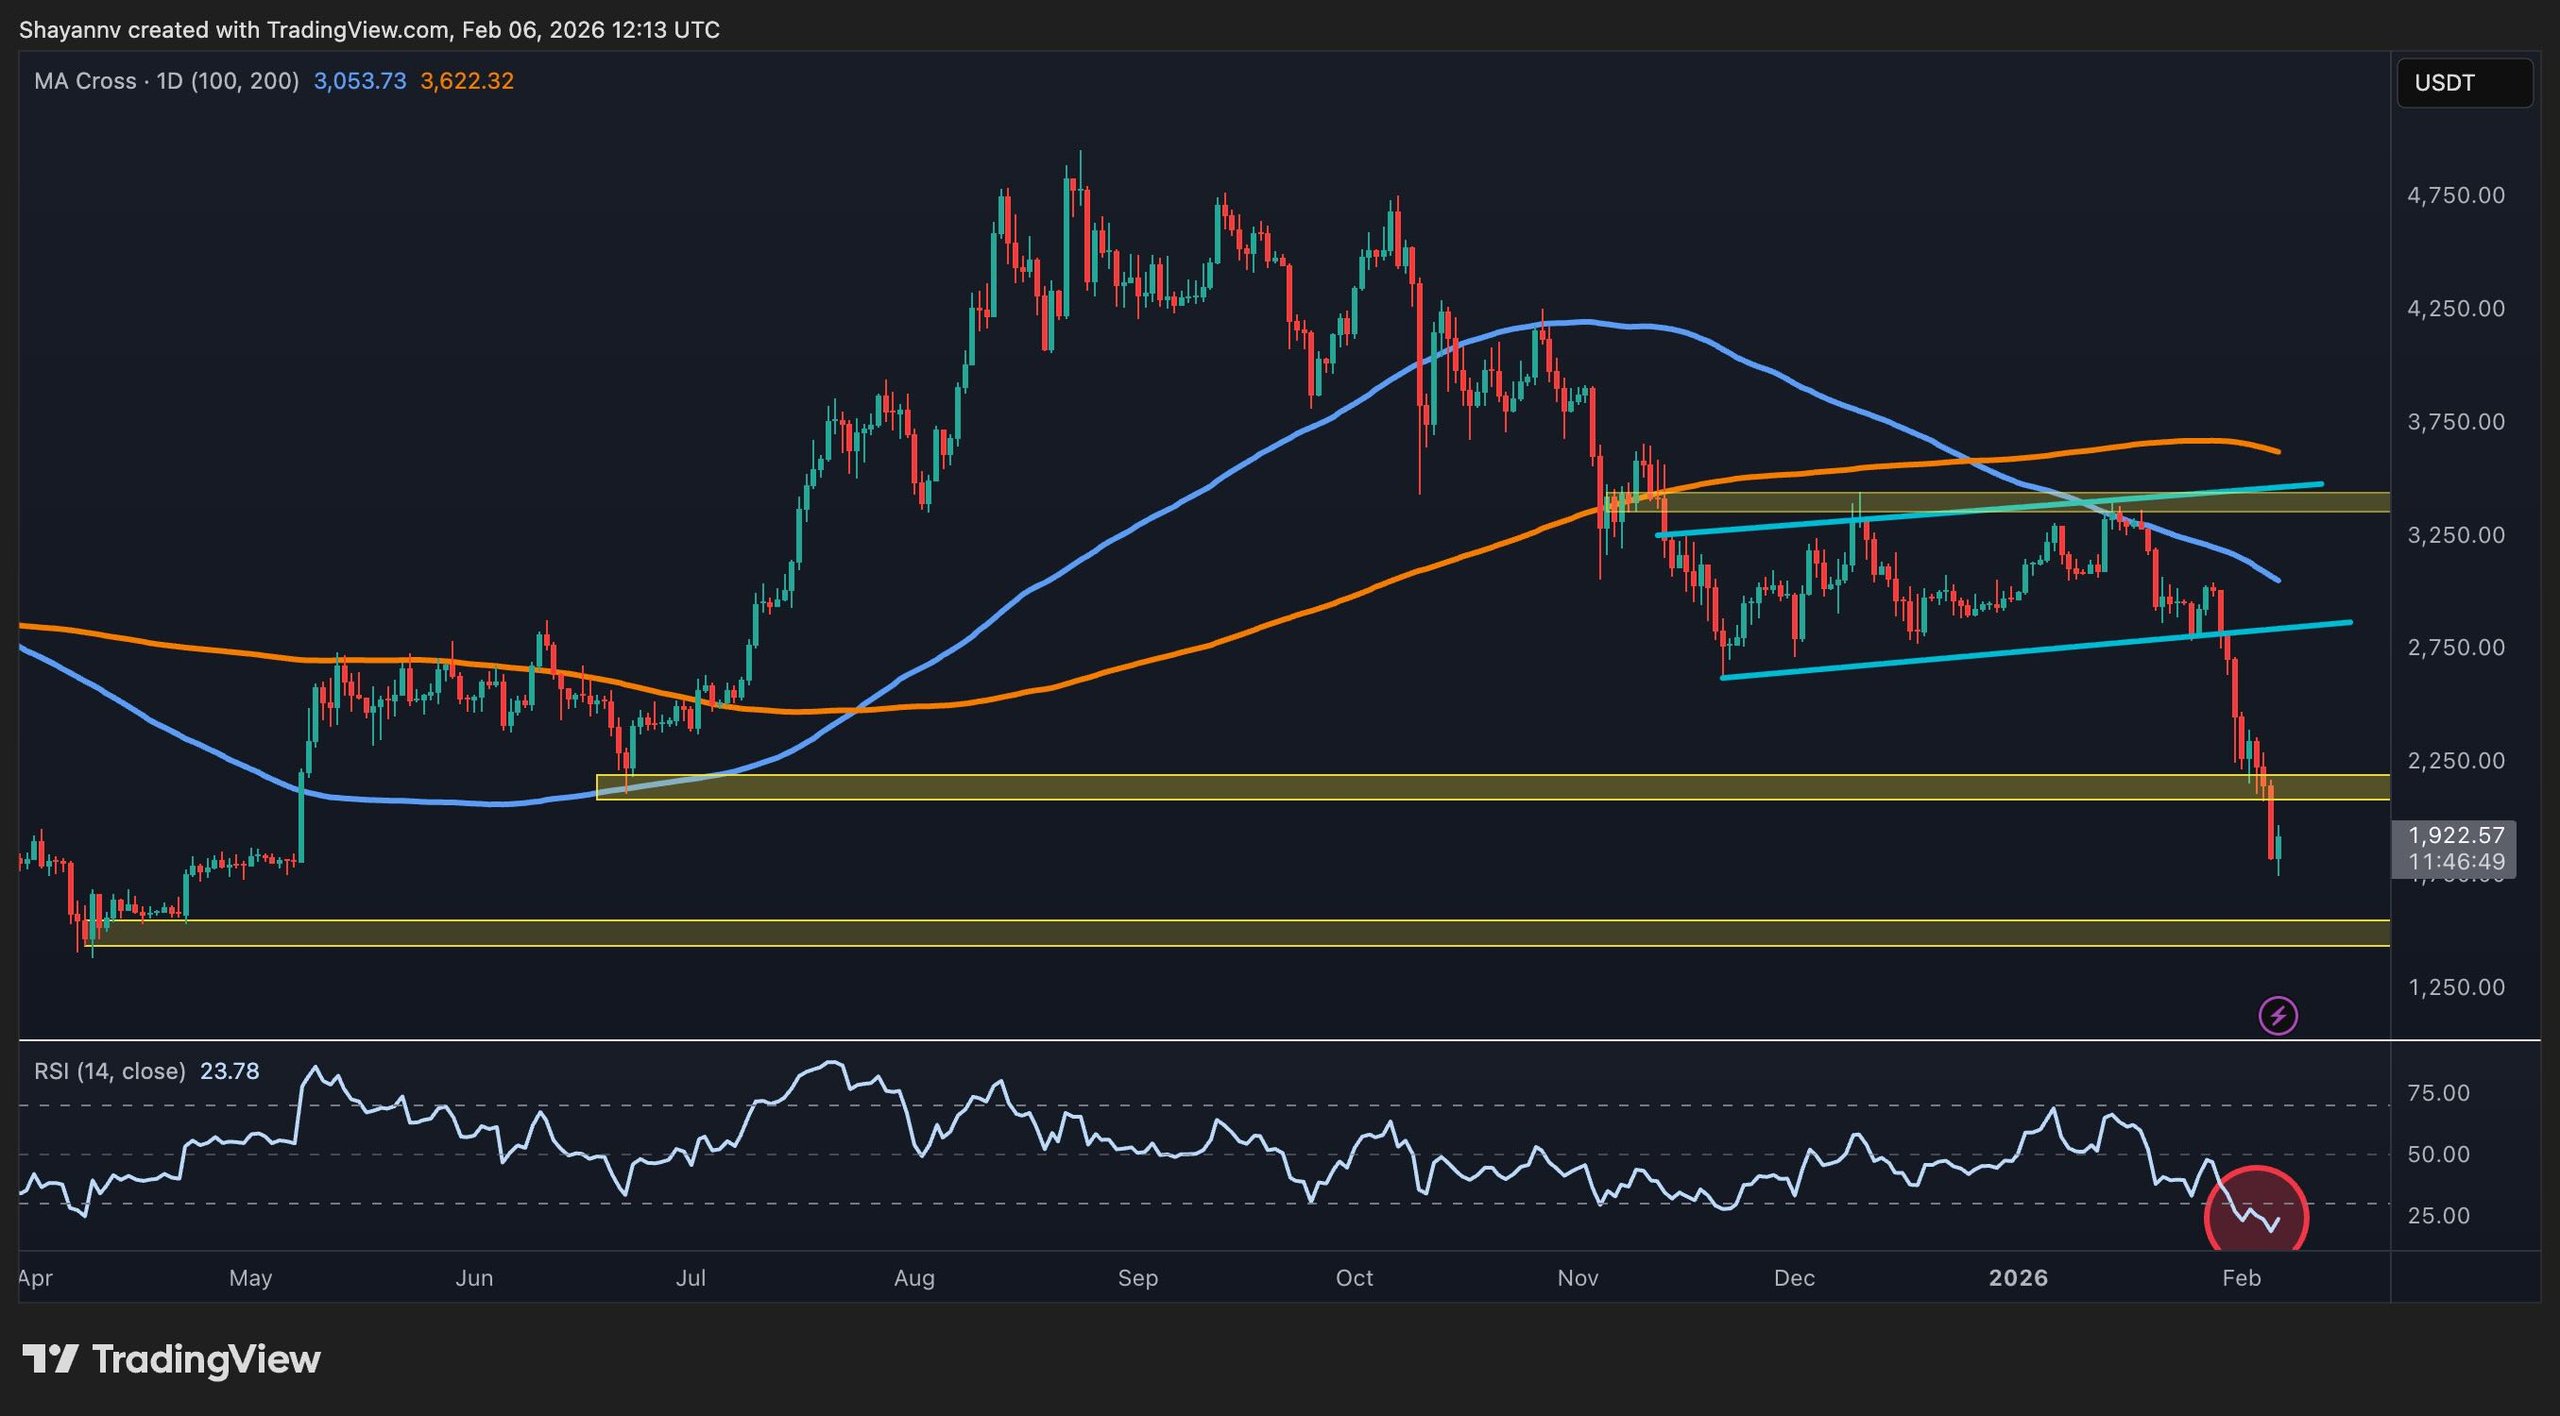
The daily chart indicates that ETH has broken out of a previously ascending pattern established from late-2025 lows, struggling to surpass the significant 100-day and 200-day moving averages, now positioned above the $3,000 threshold. This behavioral pattern signals a shift from corrective, sideway movements to a definitive downward trajectory.
Additionally, the price has dipped below the critical demand zone of $2,200-$2,000, aligning with previous consolidation phases and the start of a robust upward movement. The daily RSI is well into oversold territory, marking levels in the low 20s, which suggests extreme short-term conditions.
As long as the market stays below the broken moving averages and the previous support near $2,200, the overall structure continues to suggest a bear-market rally at most instead of a confirmed trend reversal.
Daily Chart
ETH/USDT 4-Hour Chart
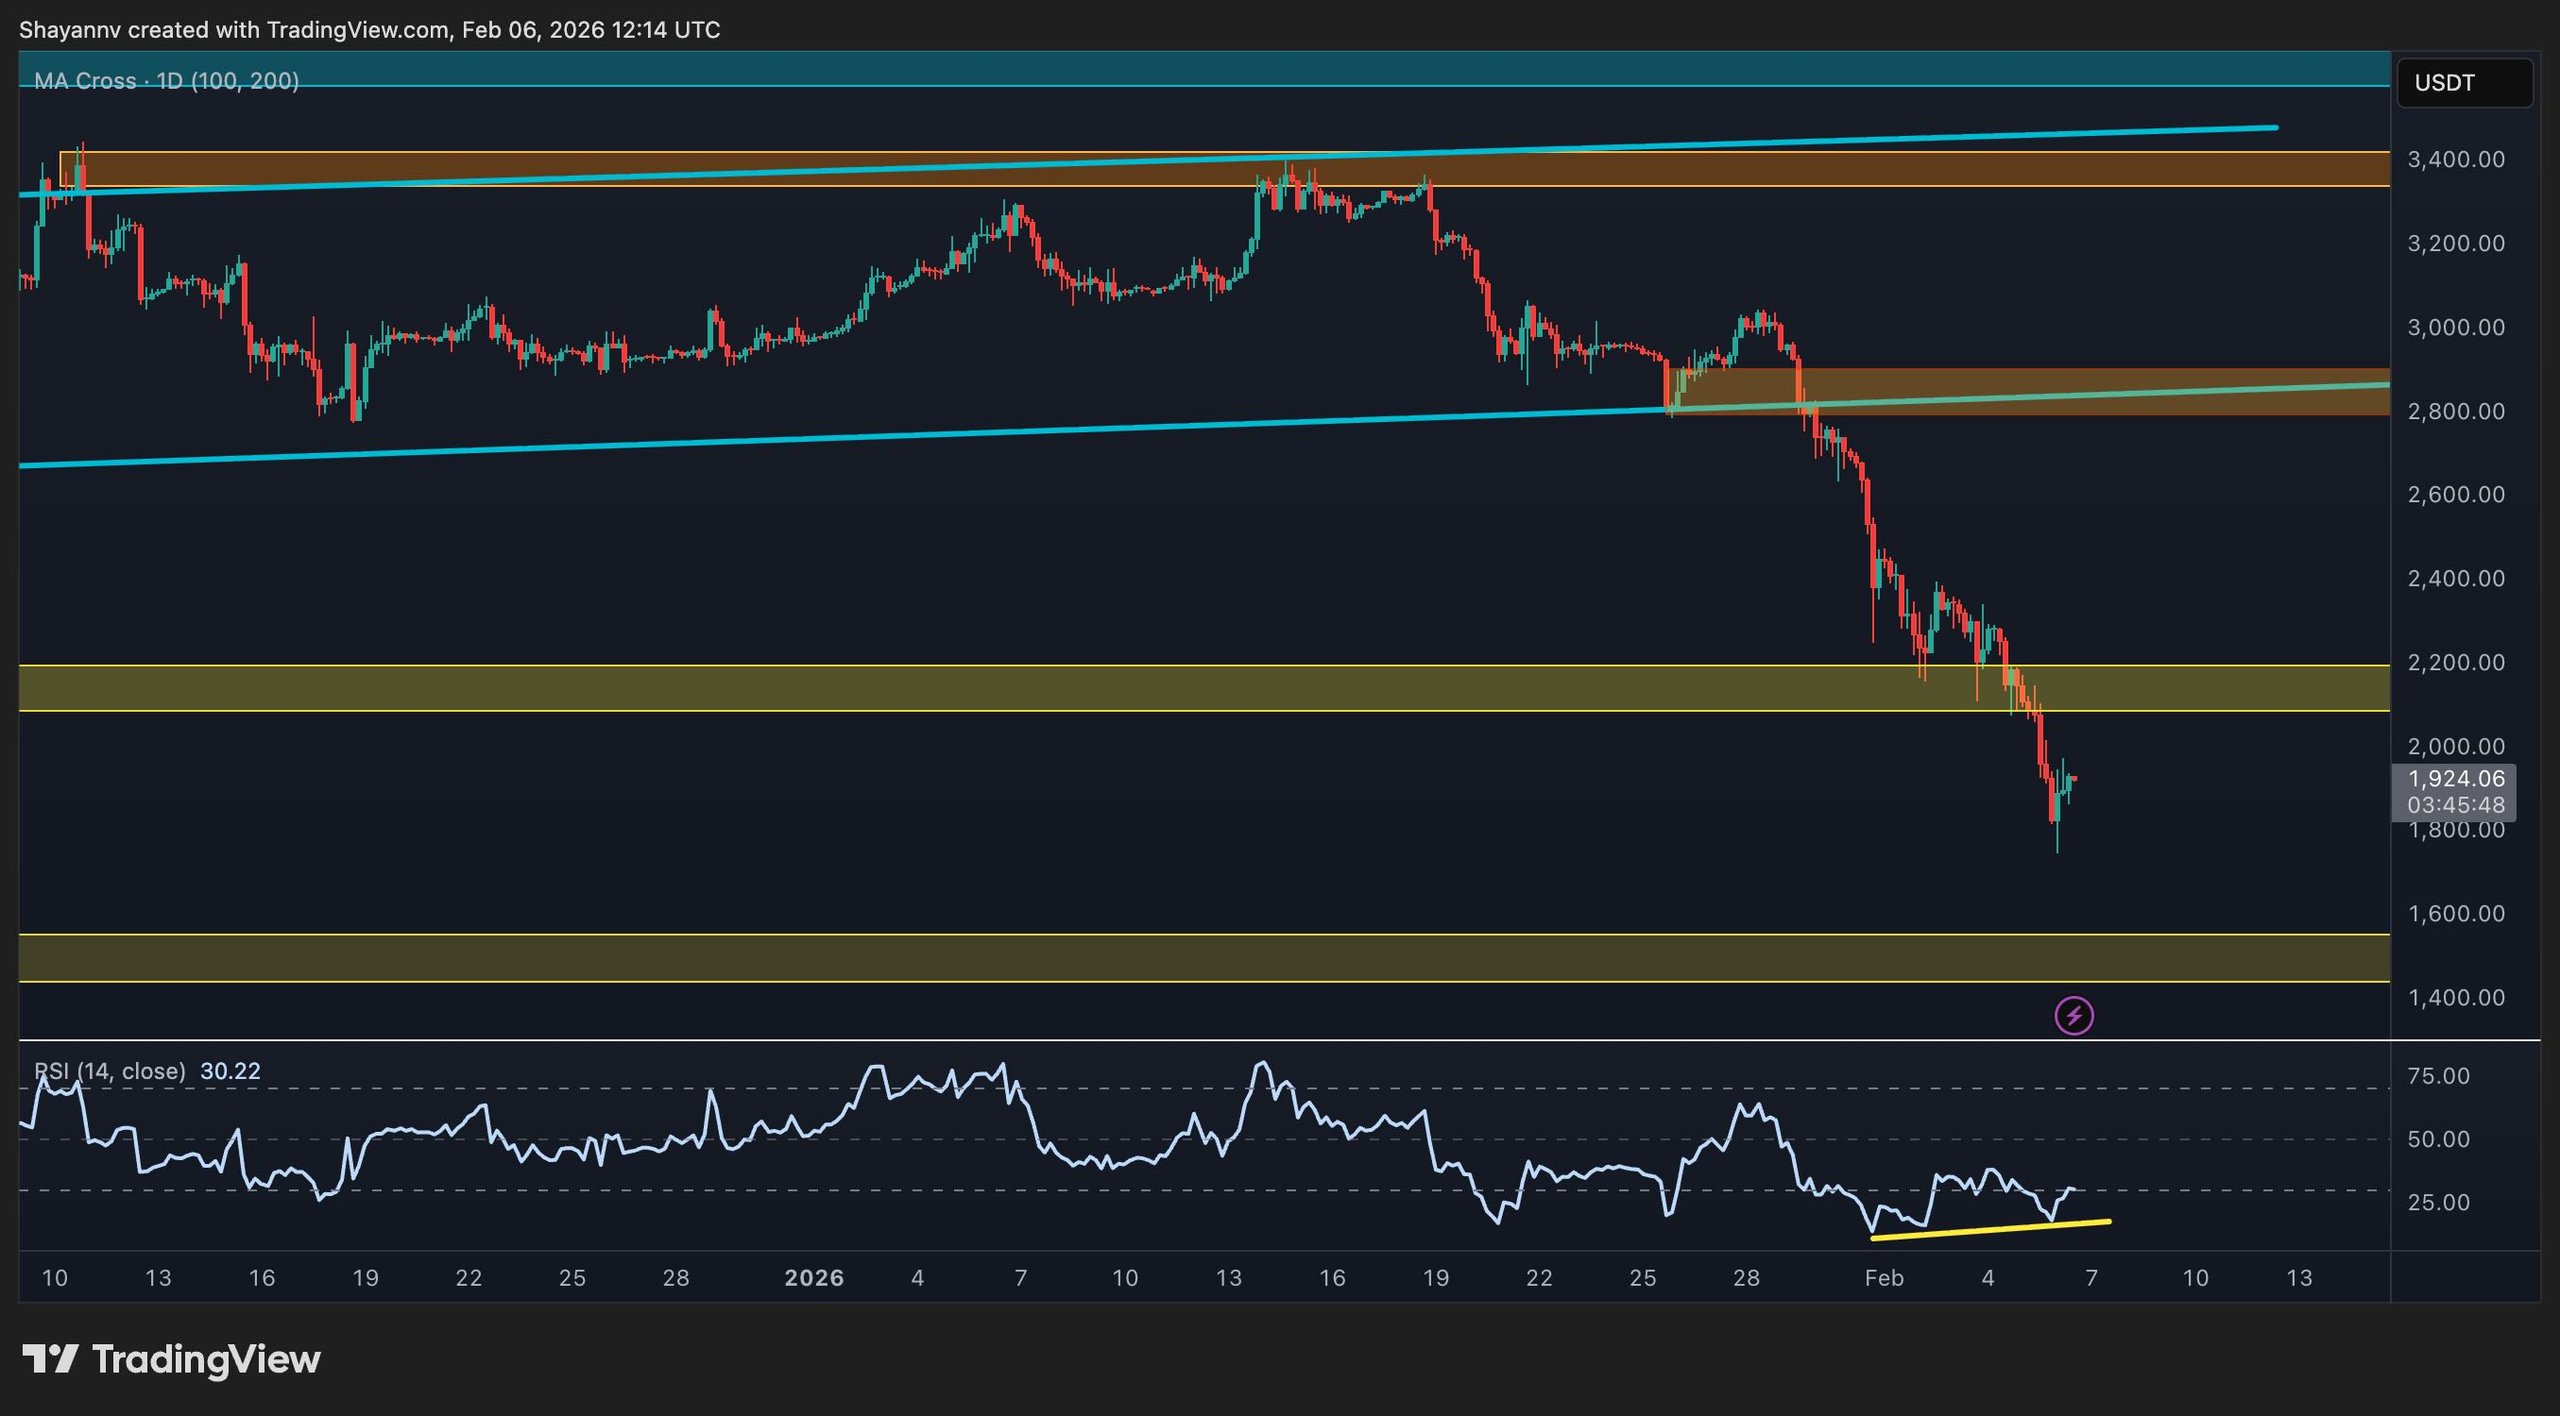
The 4-hour chart emphasizes the intensity of the current sell-off, revealing that ETH has plunged from the previously held support levels of $2,800 to $2,900 with little resistance. The market is attempting to stabilize around the $1,850-$1,900 range, with a slight bullish divergence forming on the 4-hour RSI, indicating that momentum is beginning to generate higher lows alongside marginally lower price lows.
This scenario typically suggests that the aggressive selling pressure is subsiding, likely leading to either a short-term relief bounce or a period of consolidation.
Immediate resistance is now established around the $2,100–$2,200 mark, with a significant supply zone at $2,800. Any recovery that falters below these resistance levels is likely to maintain a bearish intraday trend, while a clear fall beneath the recent low of $1,800 could steer the market towards deeper support around $1,500.
 4-Hour Chart
Sentiment Analysis
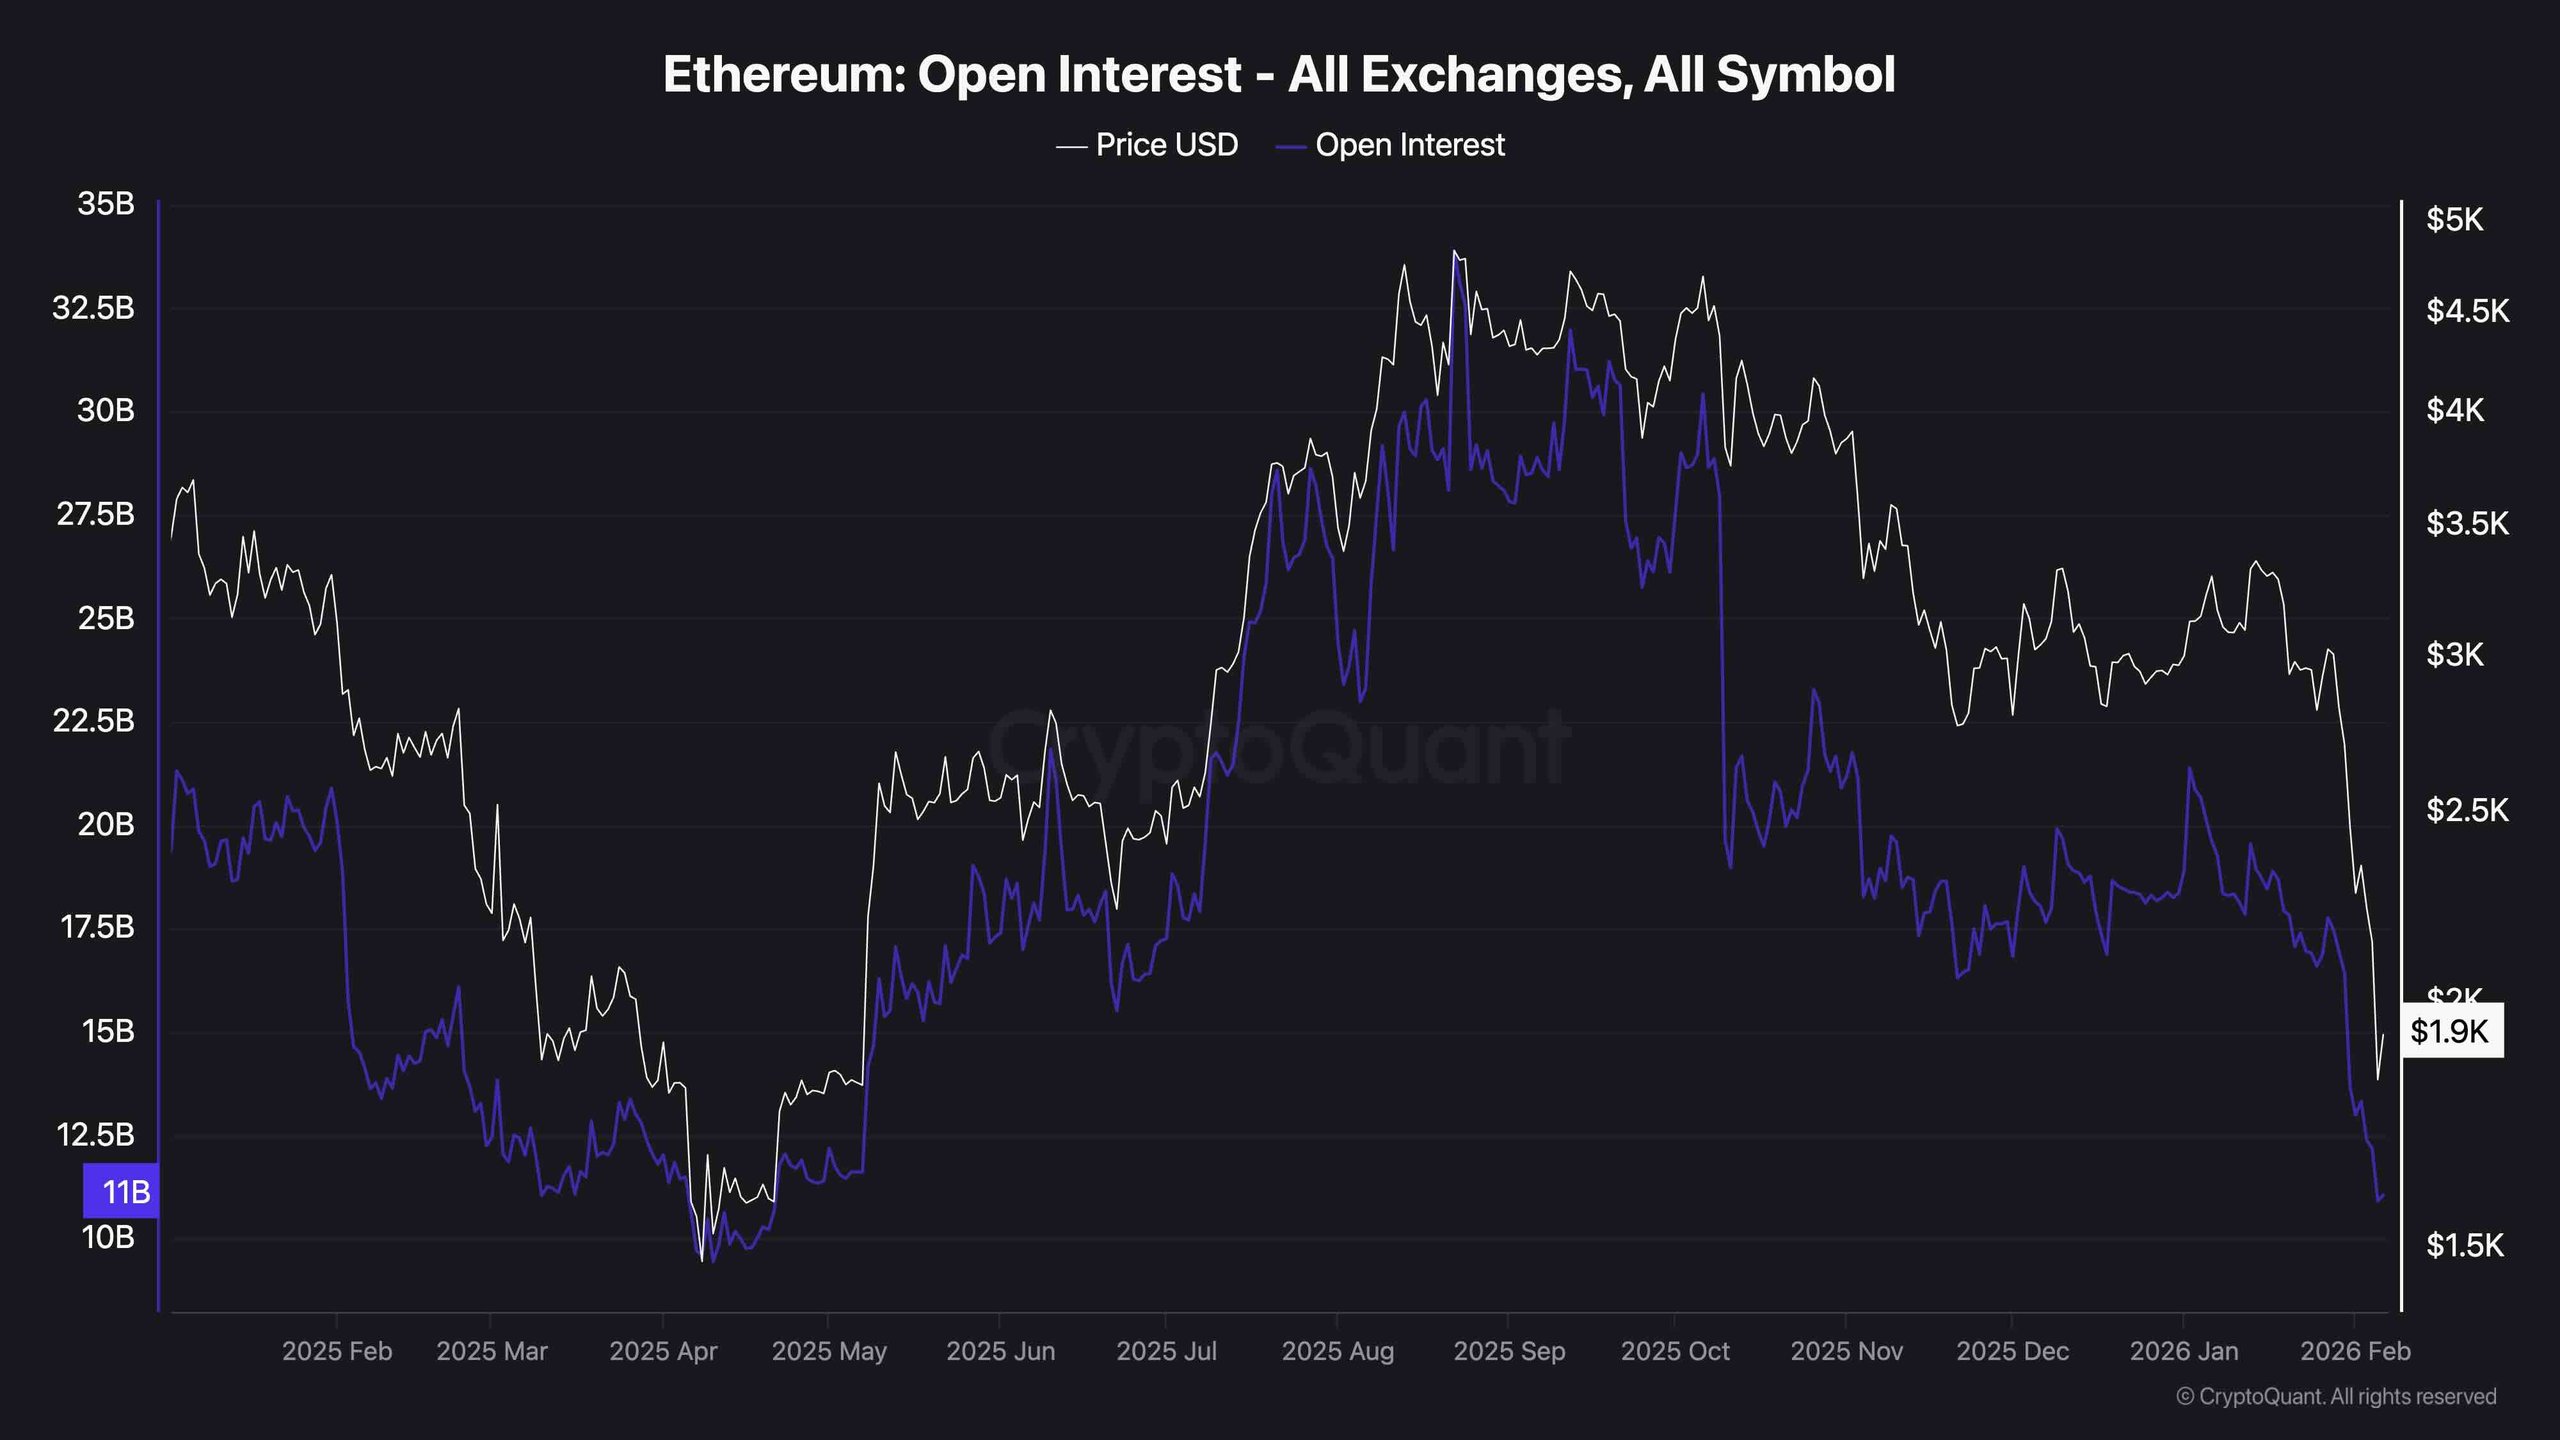
In the derivatives market, open interest for Ethereum futures has plummeted from over $30 billion to roughly a third of that amount, mirroring the price decline and reflecting a massive liquidation surge rather than a systematic unwinding of positions. This marked drop in open interest indicates that a considerable number of leveraged long positions have been liquidated, with margin calls and auto-deleveraging amplifying the downward pressure following the breach of key support levels.
While these situations can be detrimental in the short-term, they often cleanse excess leverage from the market. This creates a lighter positioning environment where actual market flows and new capital, rather than crowded derivatives positions, can play a more significant role in determining the next market direction.
 Open Interest
