Bitcoin Price Insights: Critical Levels Highlighted by Liquidation Heatmap
Explore the analysis of Bitcoin's current price dynamics, focusing on crucial support and resistance levels indicated by recent liquidation heatmap data.


Bitcoin is currently experiencing volatile price action, moving within the range of $60,000 to $70,000 as market sentiment remains uncertain. Neither buyers nor sellers have taken a definite lead, and a period of consolidation is anticipated in the upcoming week.
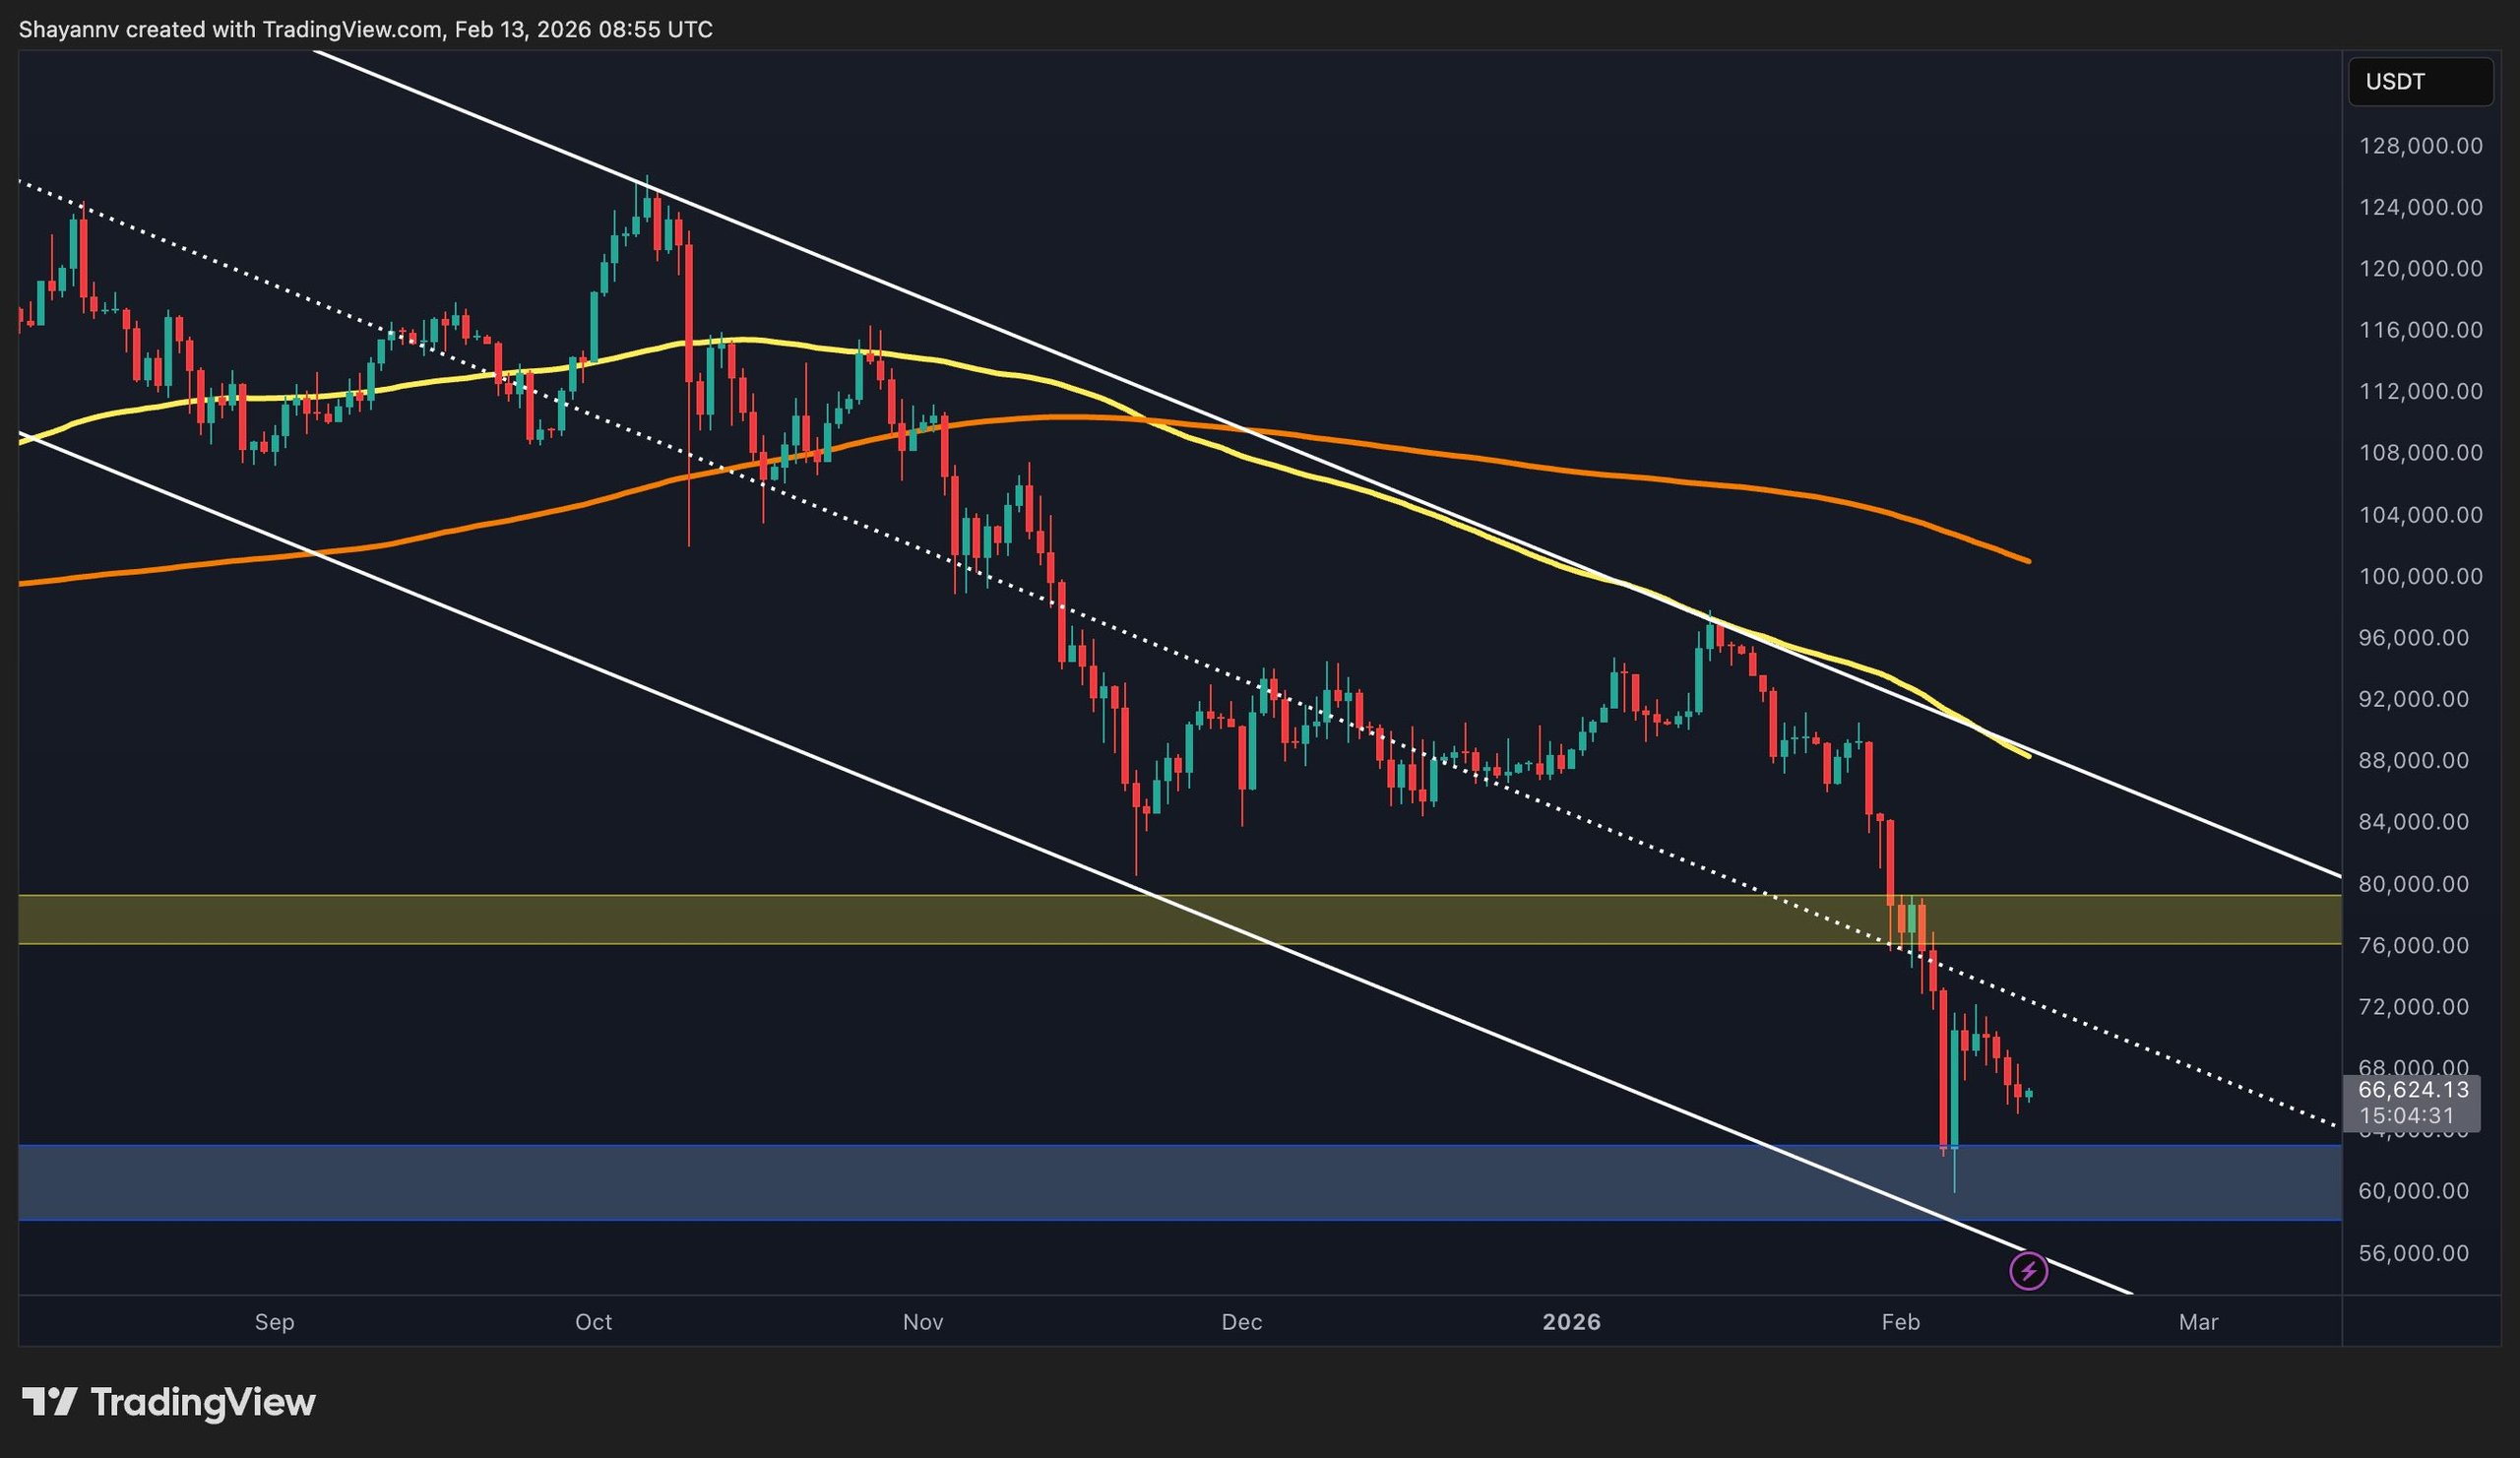
Bitcoin Price Analysis: The Daily Chart
On the daily chart, Bitcoin faced resistance at the $70,000 level, resulting in a gradual decline towards the $65,000 support zone. This resistance coincides with the midline of a descending channel, marking it as a significant supply zone both structurally and psychologically.
To shift market momentum toward a bullish trend, a reclaim of $70,000, supported by a breakout above the channel midpoint, is essential. If this does not happen, Bitcoin may stall within the $60,000 to $70,000 range until new demand or supply comes to light.
Bitcoin Daily Chart
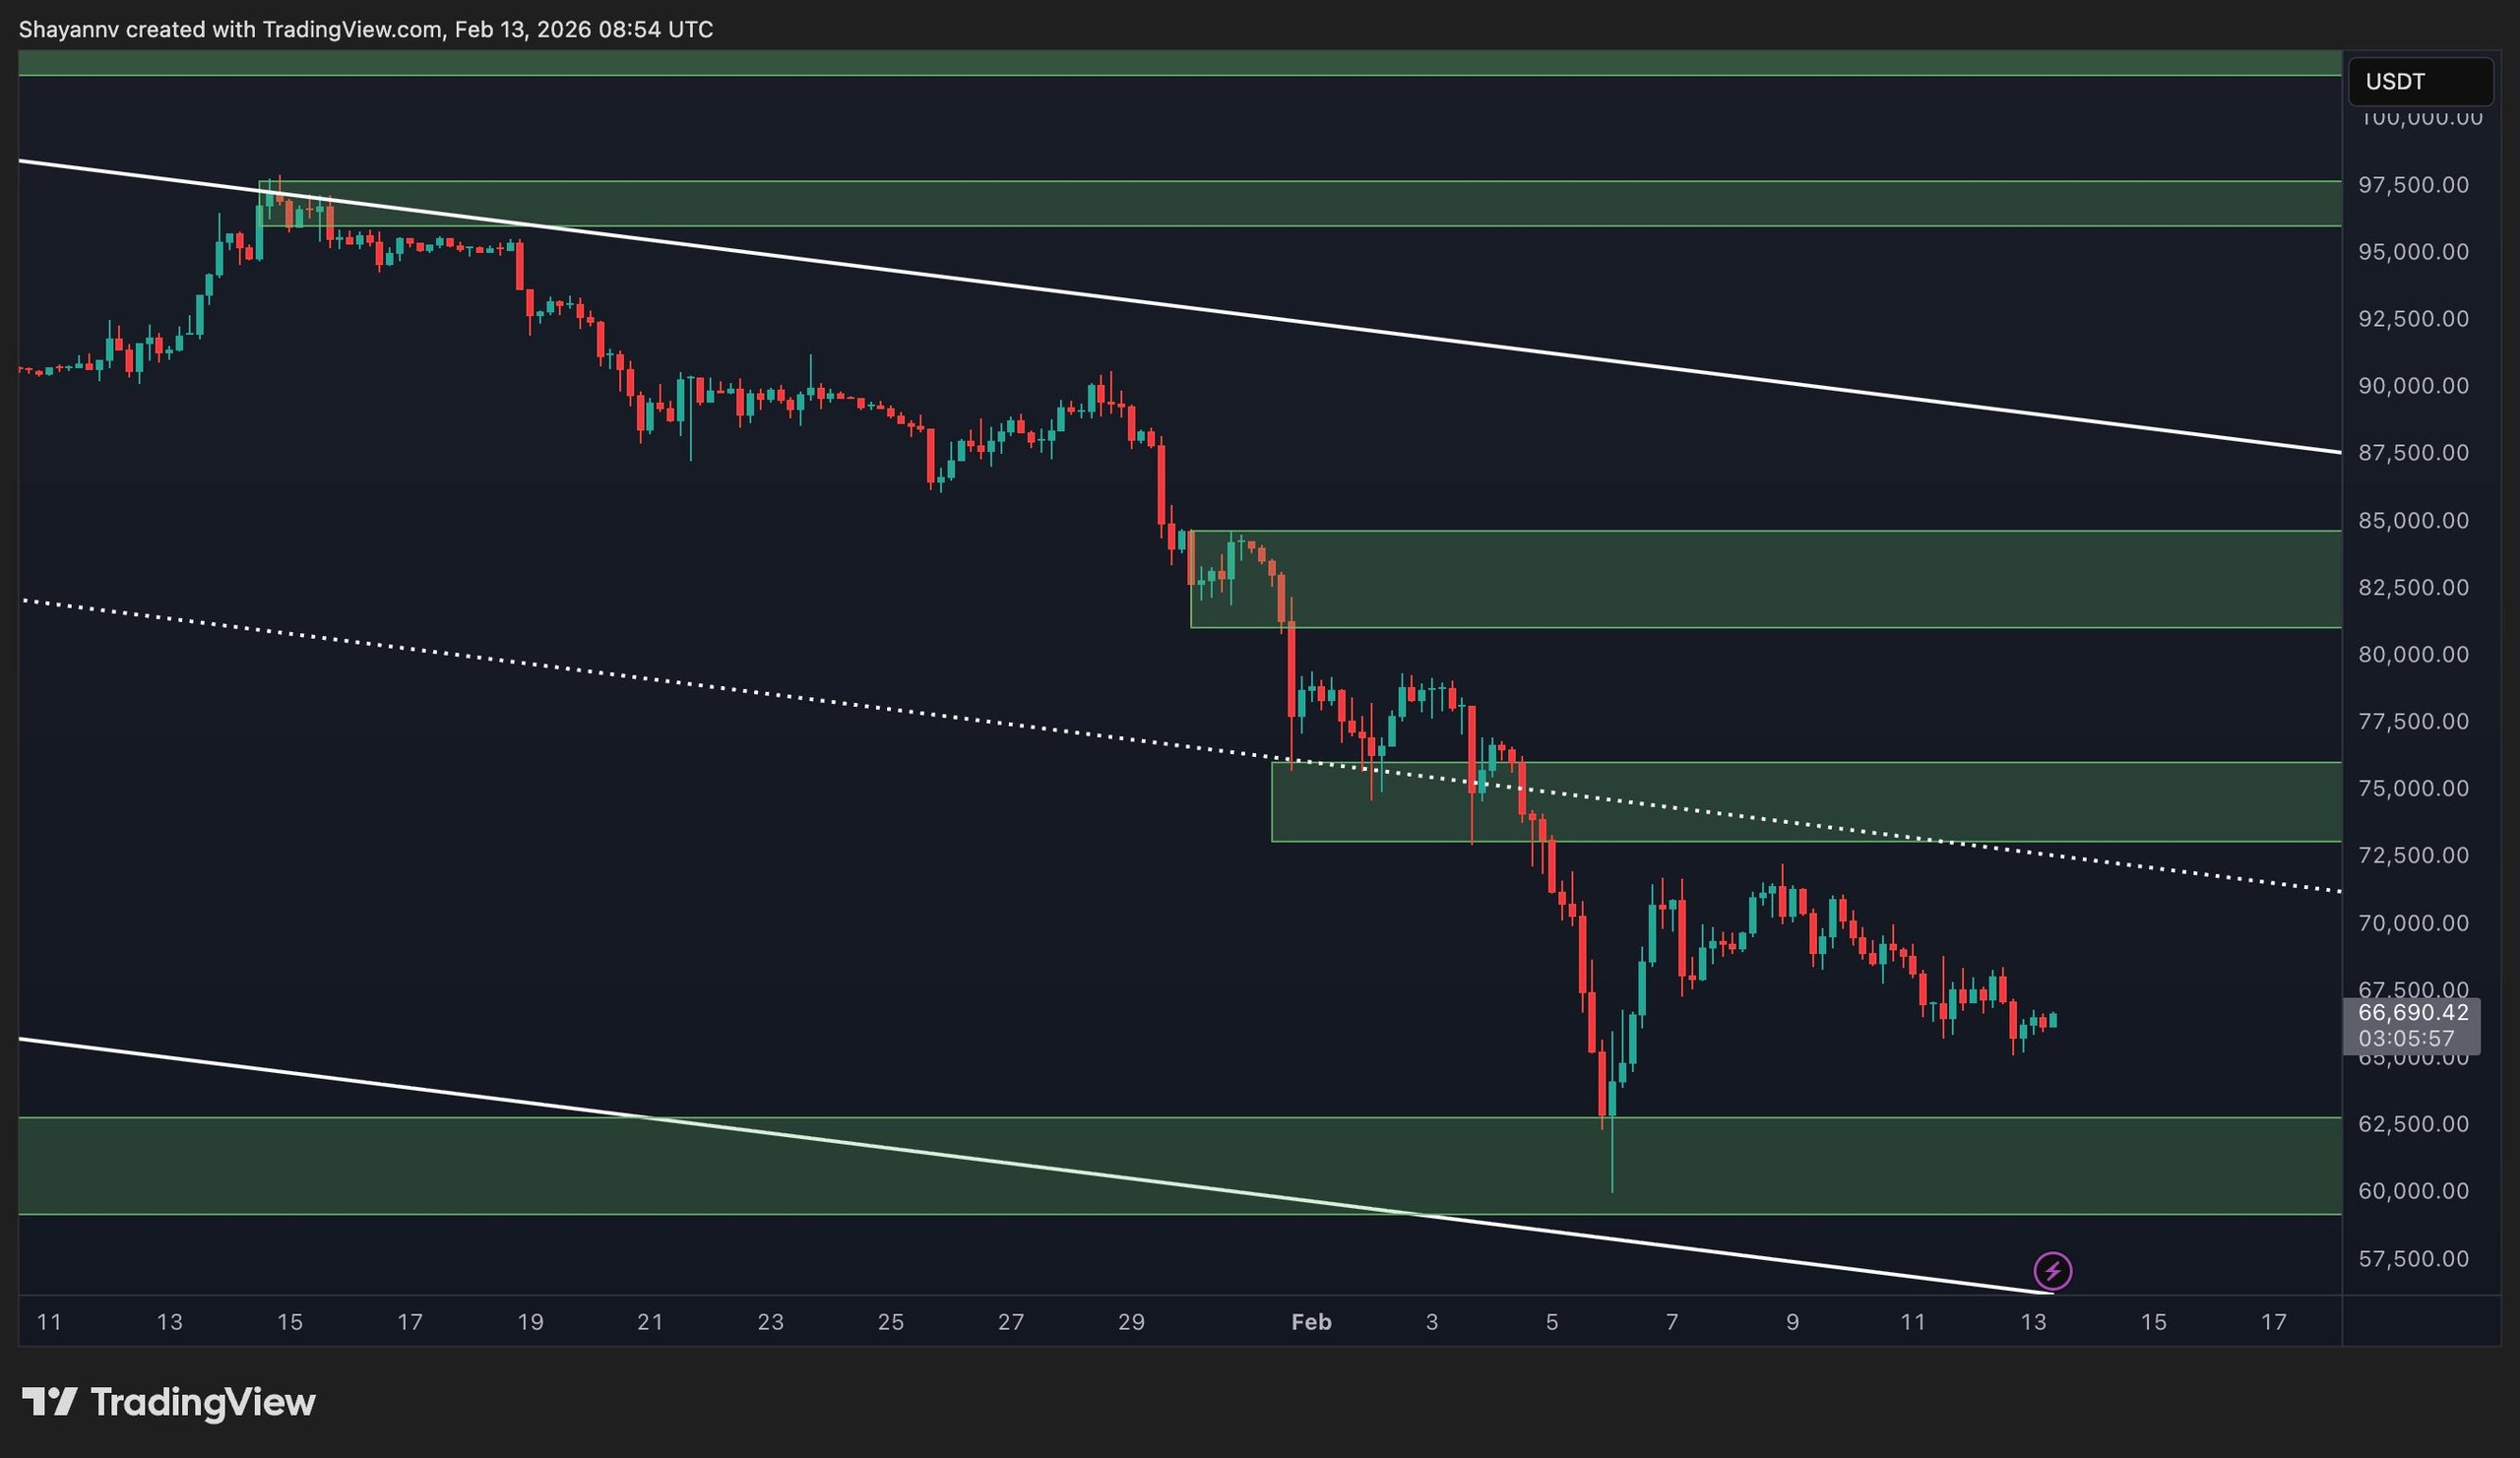
BTC/USDT 4-Hour Chart
Looking at the 4-hour chart, there is a decrease in trading volume, coupled with overlapping candles, indicating a balanced market. This low momentum suggests that neither buyers nor sellers are exerting significant control.
Prices might drift down towards the $63,000 internal support level, where a short-term stabilization could ensue. In a broader sense, the $60,000 region acts as a primary support threshold for buyers, and substantial accumulation here could pave the way for future bullish movements.
 BTC/USDT 4-Hour Chart
Sentiment Analysis
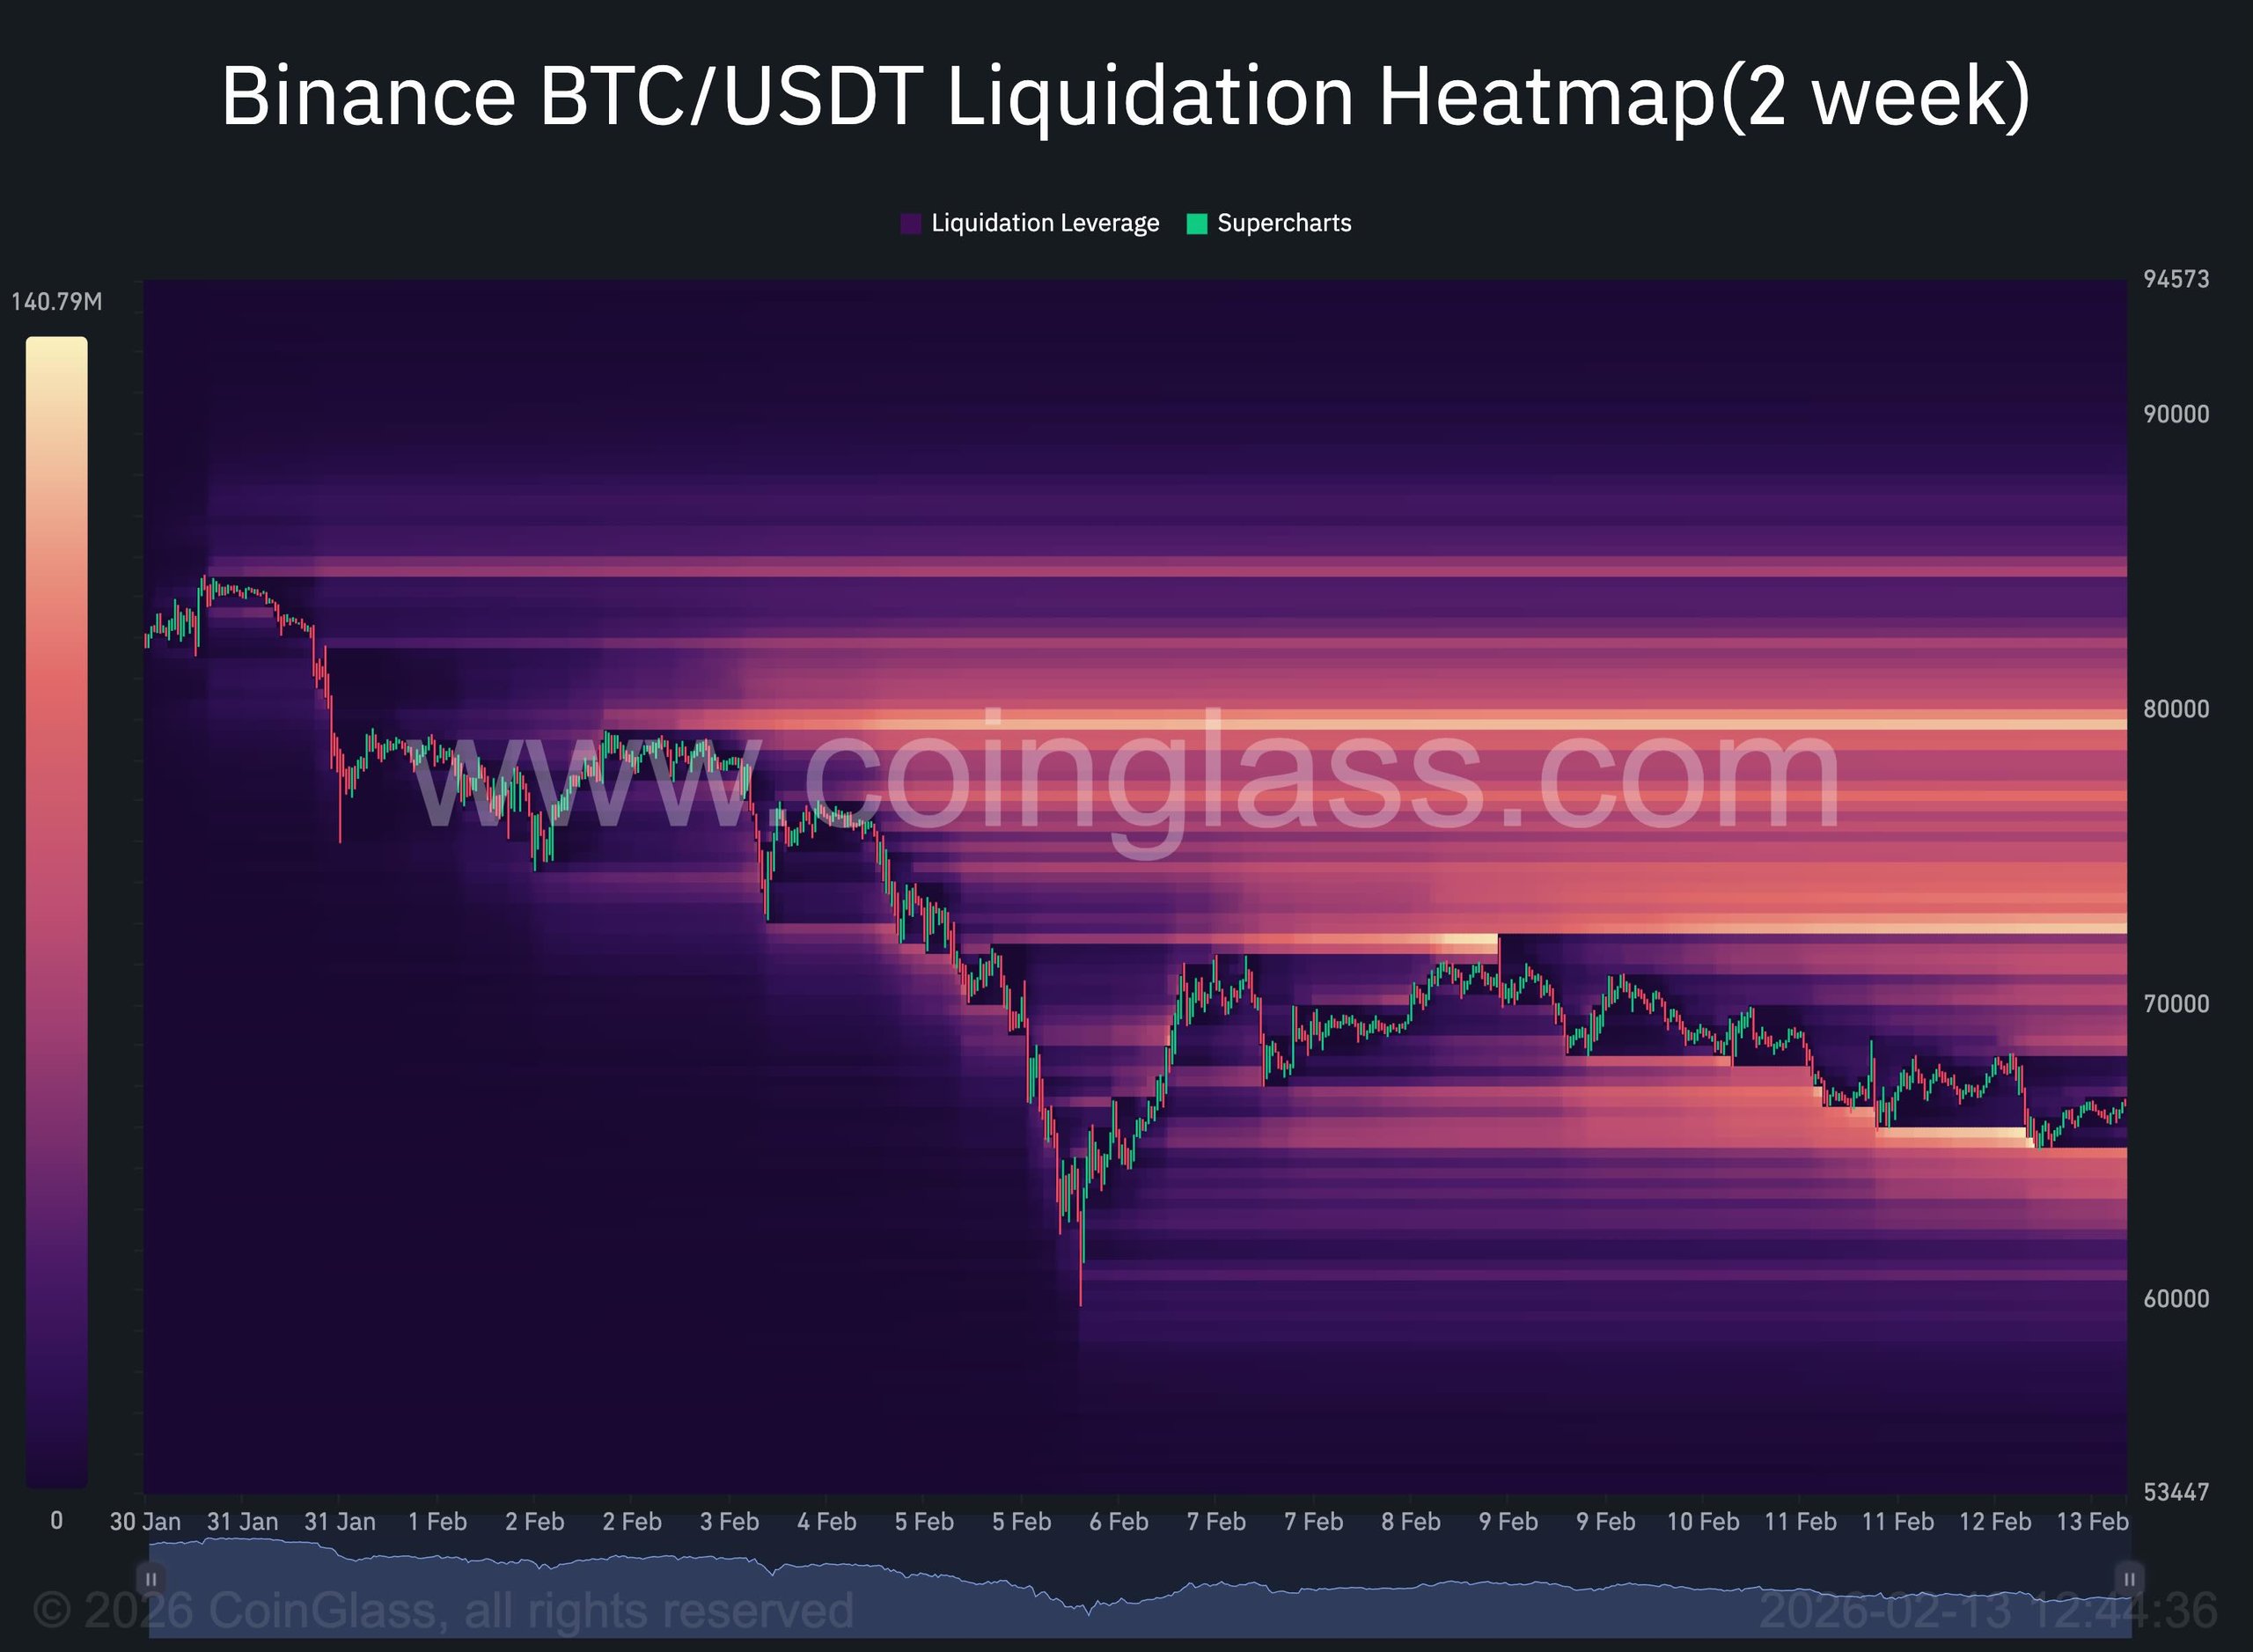
The liquidation heatmap for the last two weeks on Binance exhibits Bitcoin trading between two substantial liquidity zones, which are expected to influence the next significant price move. On the upside, a strong concentration of short liquidation liquidity stands between $78,000 and $82,000, with additional buildups toward $85,000.
A breakout above the $72,000 resistance could speed the price toward this area, potentially triggering a short squeeze if $80,000 is breached. Conversely, liquidity is thin until the $60,000 to $62,000 region, aligning with the recent swing low.
A break below $60,000 might lead to further liquidation, potentially dragging prices toward the mid-$50,000 range. For the moment, Bitcoin remains caught between the $72,000 resistance and the $60,000 support, with a breakout on either side likely to spur heightened volatility, while ongoing range-bound moves would strengthen the current consolidation phase.
 Liquidation Heatmap
Note: The information provided herein is intended for educational purposes only and should not be construed as financial advice. Conduct your own research before making any investment decisions.
