Ethereum Price Outlook: Reclaiming Essential Levels to Change the Game
Ethereum's price movements indicate a shift towards stabilization despite recent volatility, as it seeks to regain crucial support levels.


Ethereum’s recent price movements suggest a market that is shifting away from impulsive selling into a possible short-term stabilization phase. After a rapid drop towards the $1,750 demand zone, ETH has shown a slight rebound but is likely to continue experiencing fluctuations in the near future.
Ethereum Price Analysis: The Daily Chart
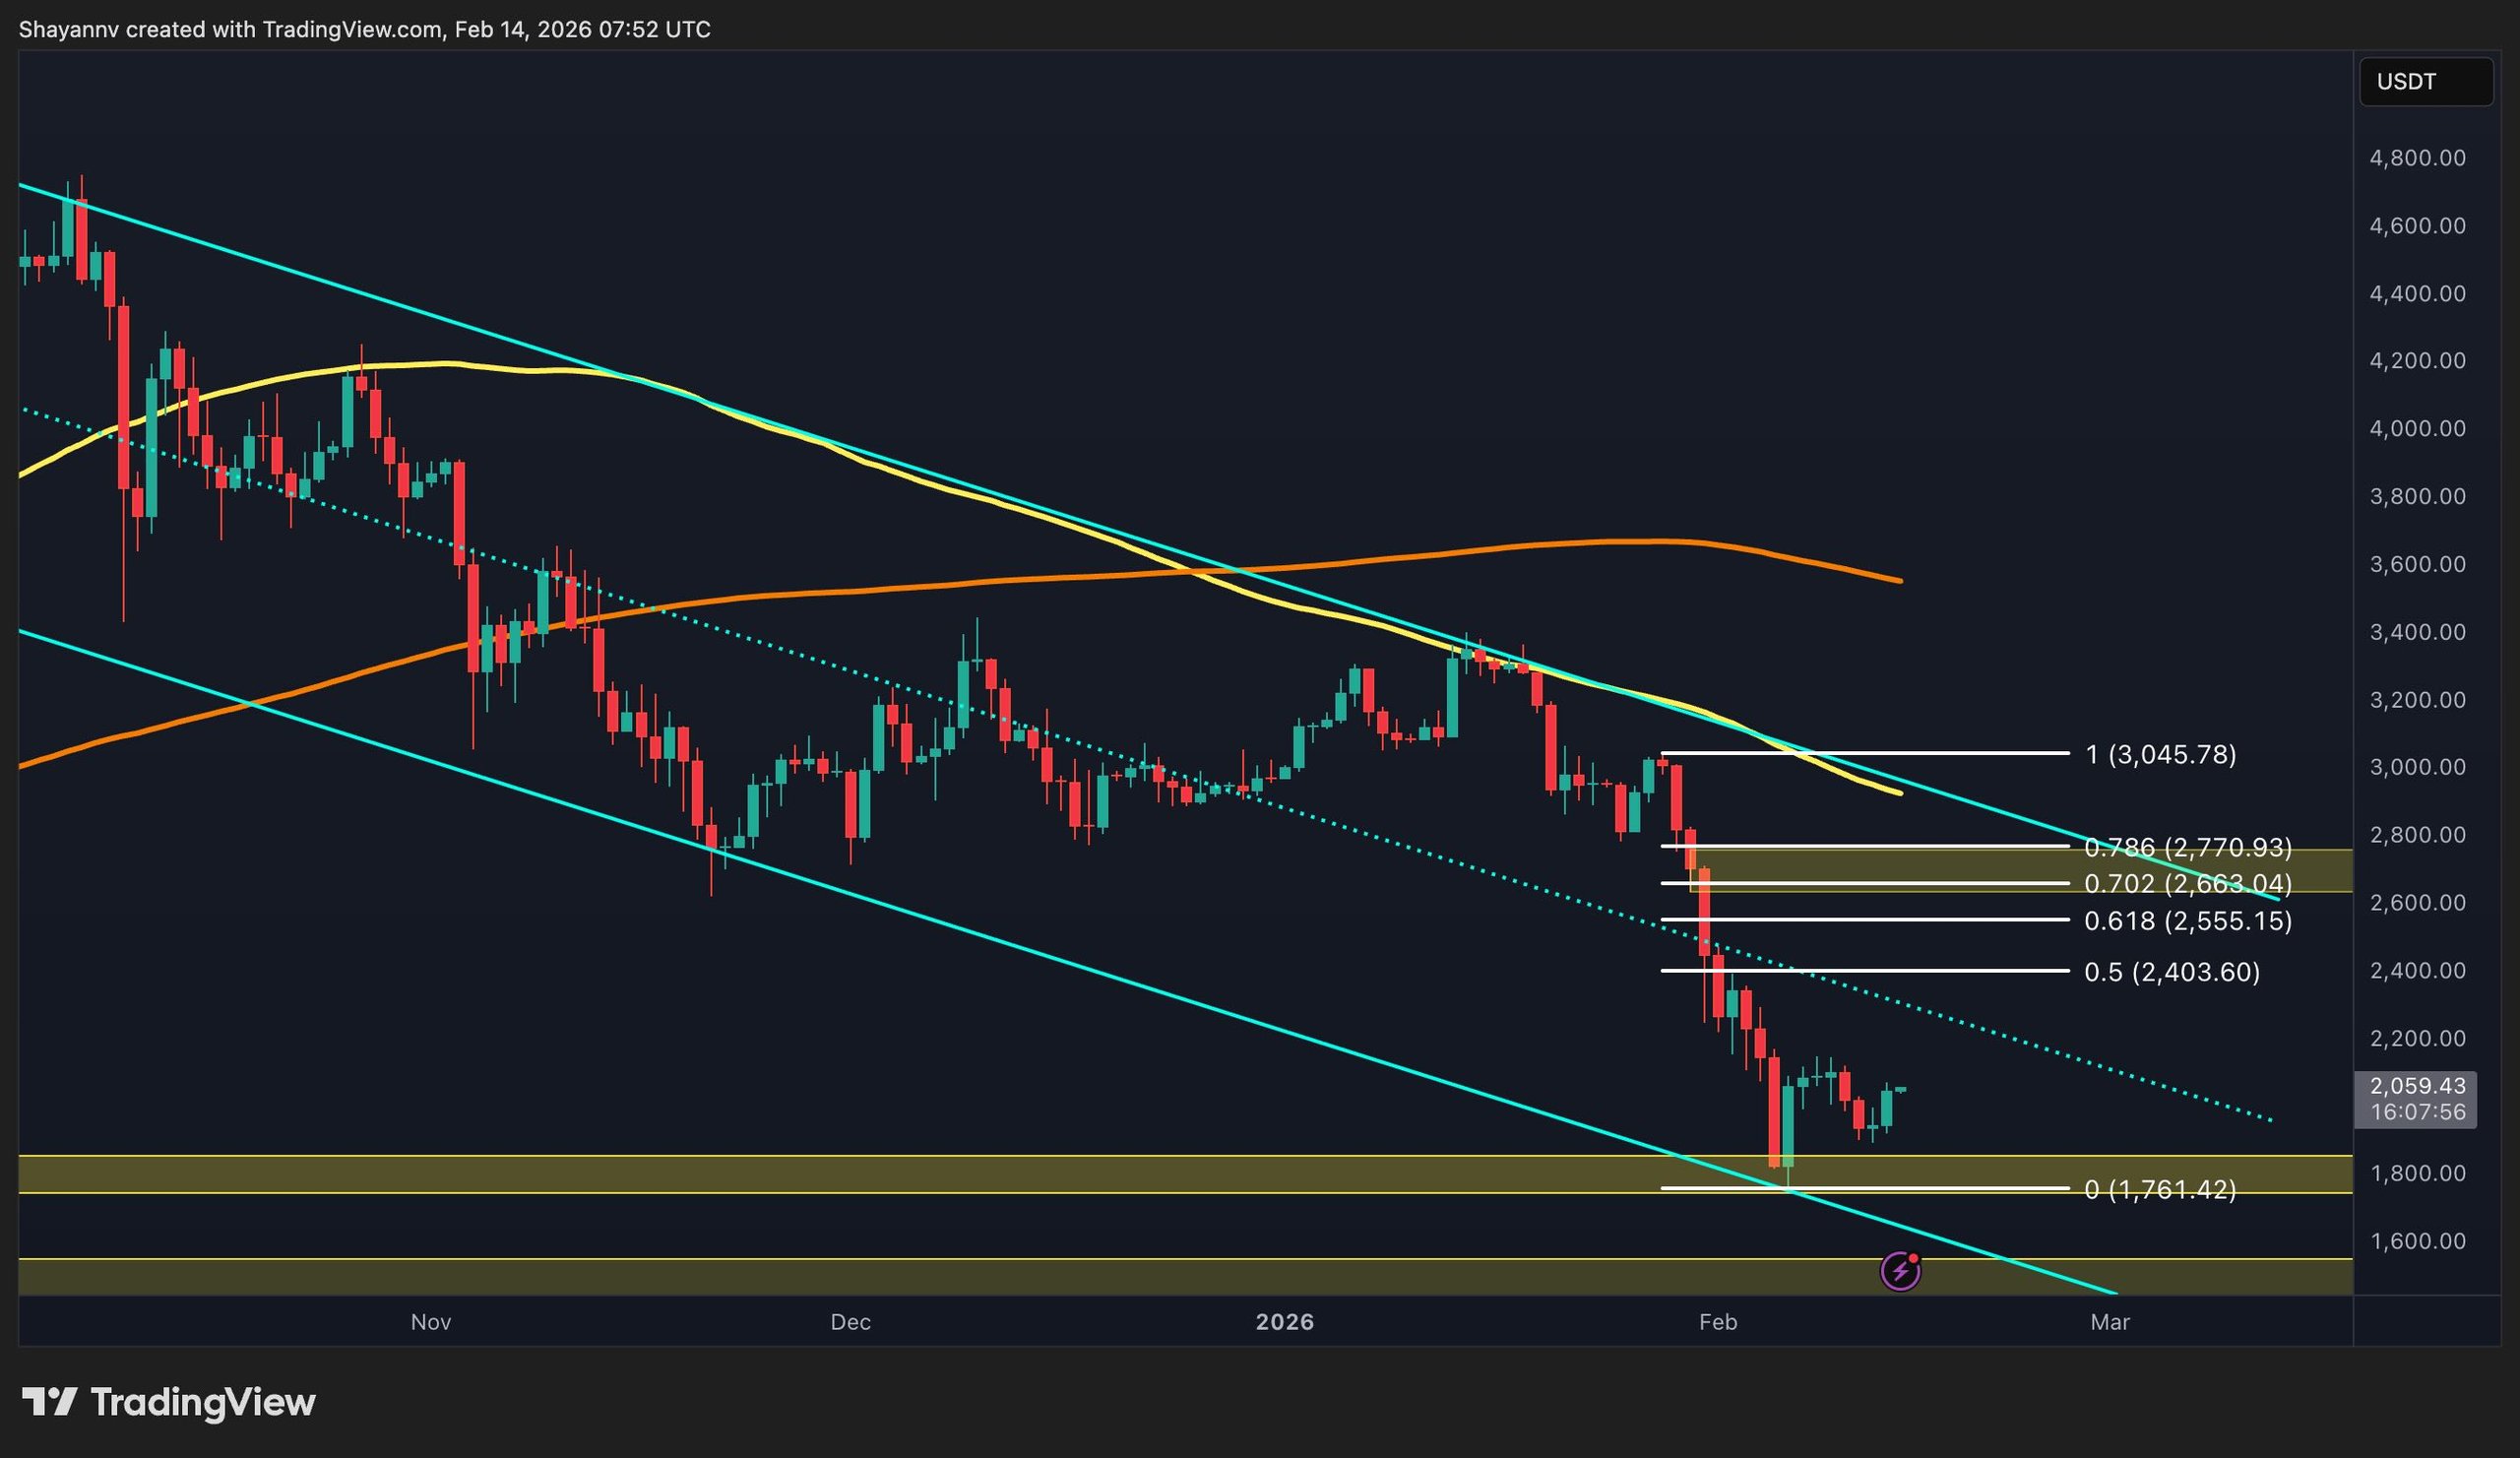
On the daily chart, ETH remains within its descending channel, characterized by lower highs and lower lows. A significant drop forced the price down to the $1.8K demand area, where buyers initiated a rebound towards the $2.1K zone.
Nonetheless, the asset continues to trade below the 0.5 Fibonacci level at $2.4K and the 0.618 level at $2.5K, confirming that the recent movement is corrective rather than a complete trend reversal. The $2.7K range, which aligns with the 0.702–0.786 retracement levels, is a critical supply zone and poses as a significant resistance area should a more robust recovery occur. As long as ETH remains under $2.5K, the overall market sentiment favors sellers, while holding the $1.7K level is crucial for support.
Daily Chart
ETH/USDT 4-Hour Chart
The 4-hour chart indicates that price action has molded a short-term contracting formation following a sharp rebound from $1.7K. Currently, the market fluctuates between the ascending short-term support trendline and the descending local resistance trendline, situated near the $2.1K mark. A successful breakout above $2.1K may lead to attempts at reaching $2.5K, the next key resistance.
On the other hand, a failure to hold above the $2K intraday support could result in another dip towards the $1.8K zone. Presently, ETH is in a short-term consolidation phase between $1.8K and $2.1K following recent volatility spikes.
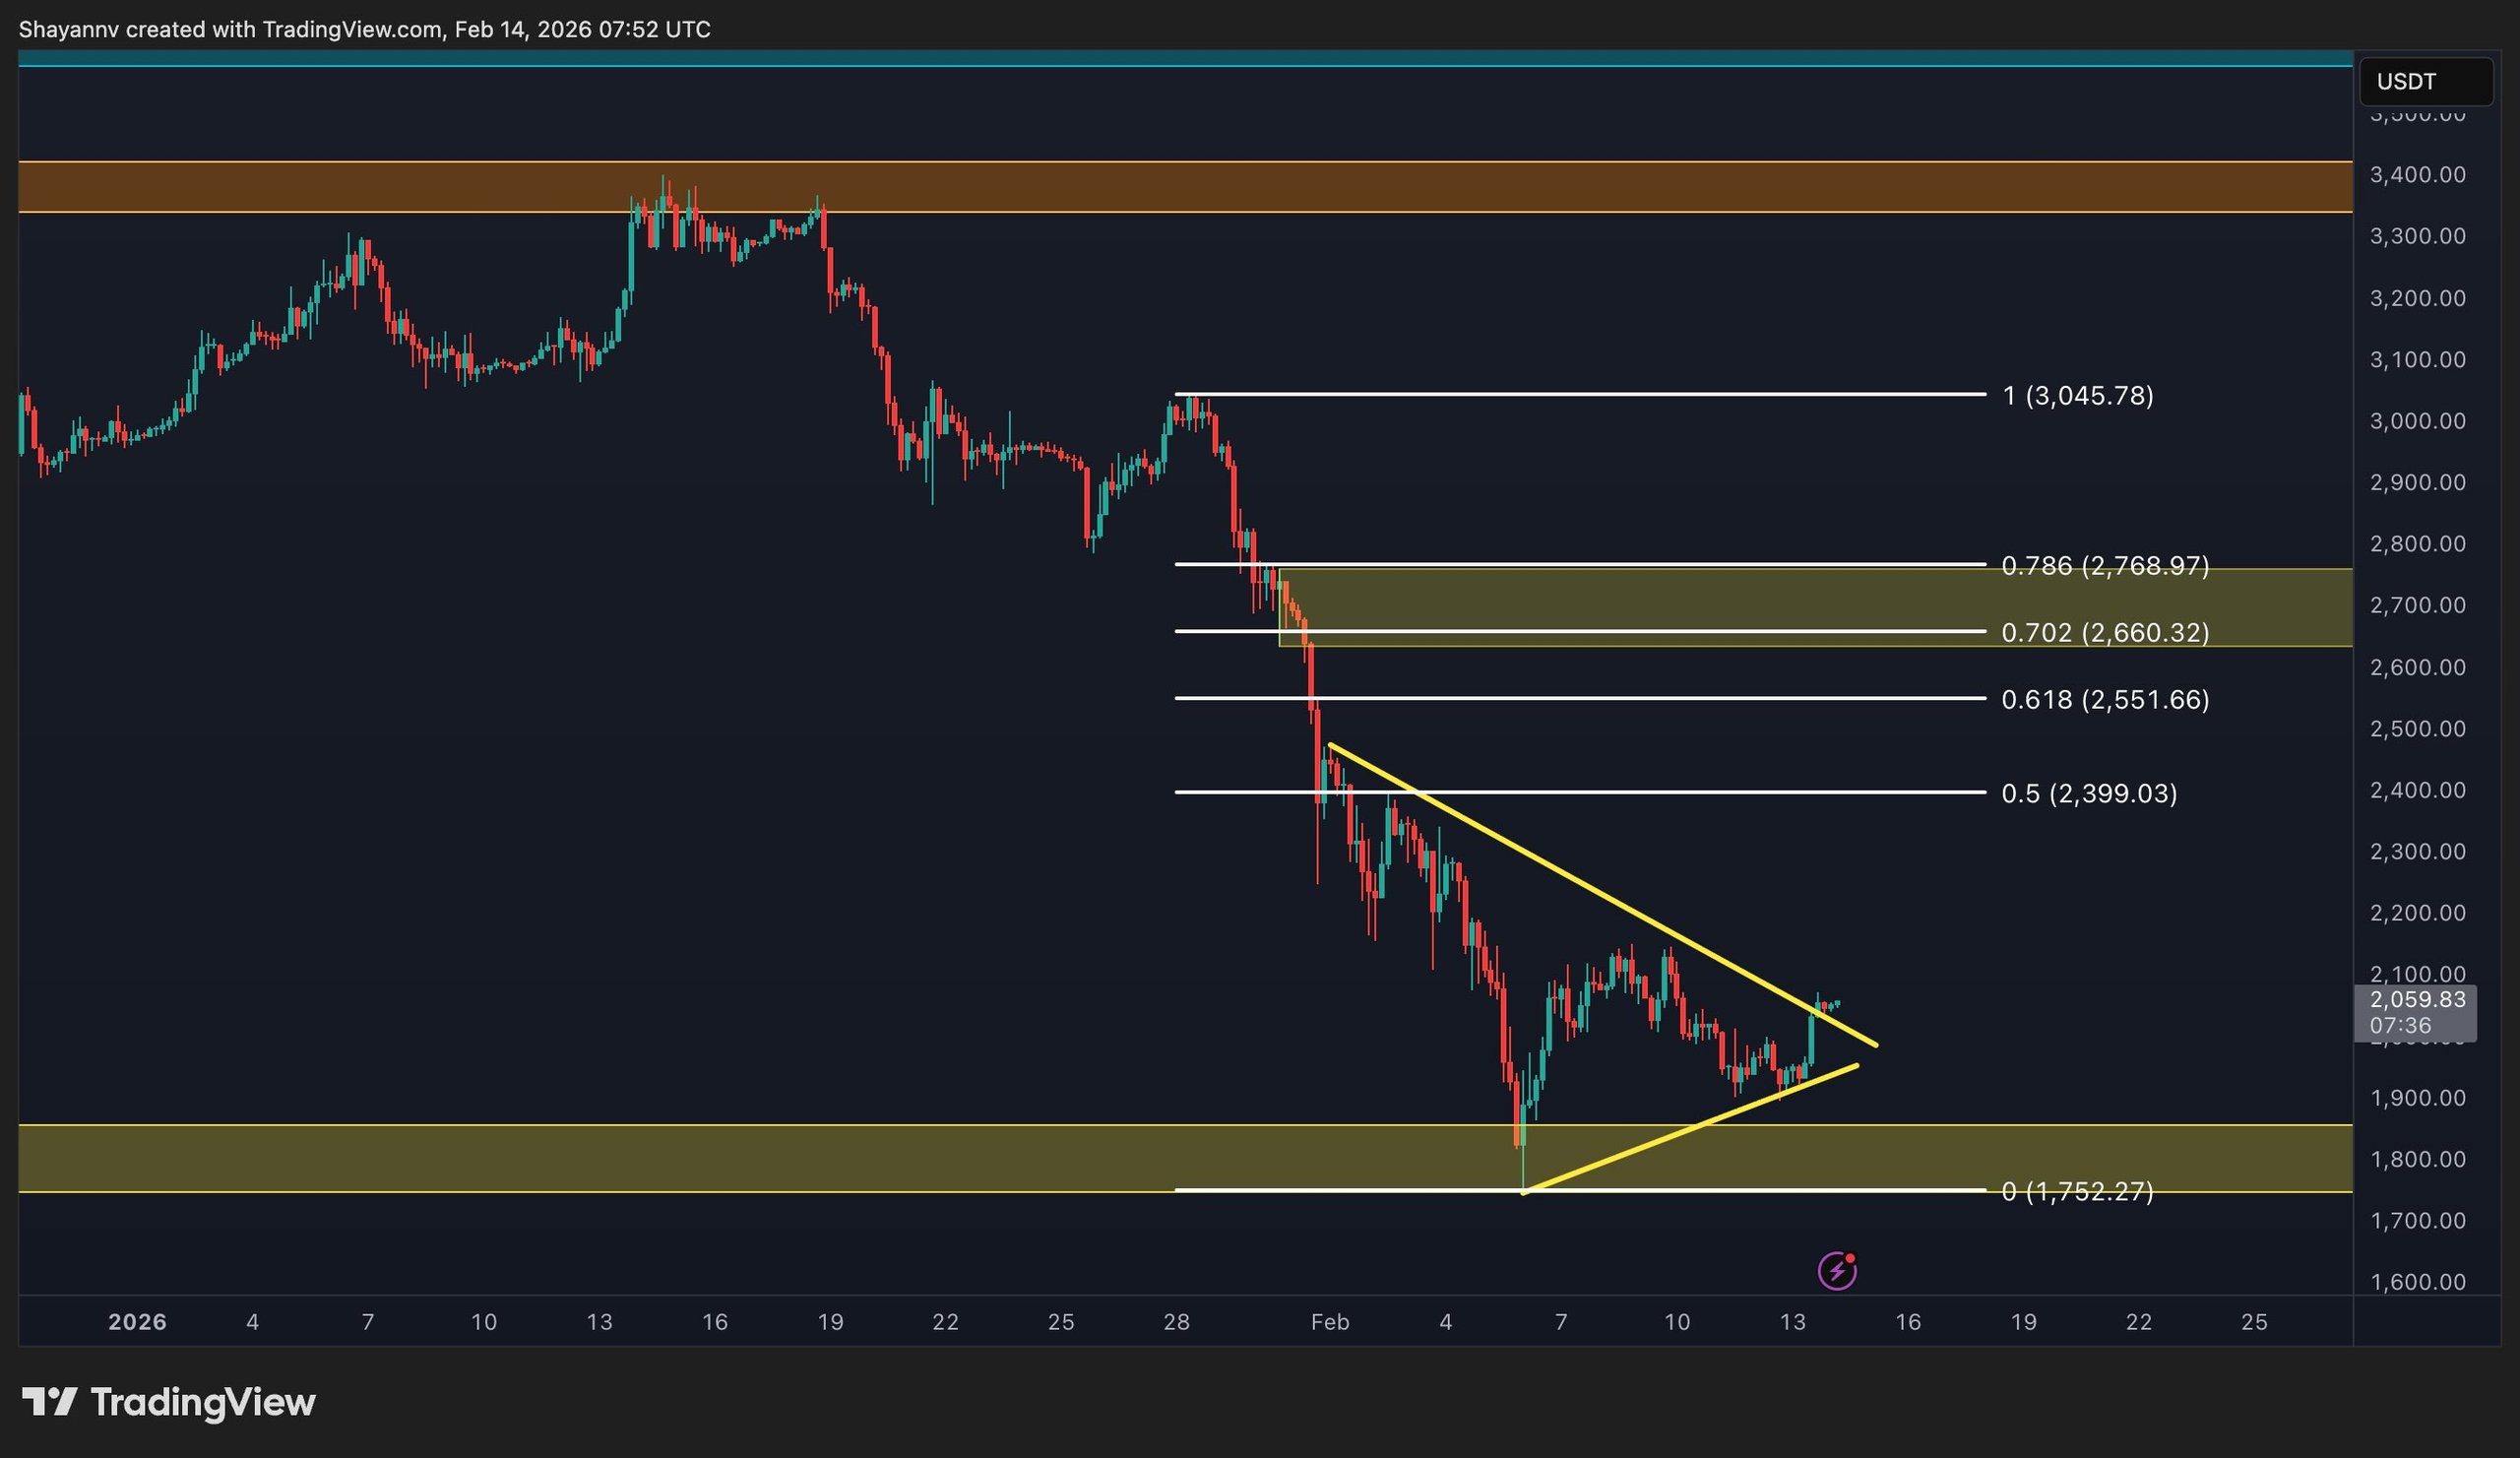 4-Hour Chart
Sentiment Analysis
The Ethereum Spot Average Order Size chart revealed a significant surge in larger spot orders during the recent drop toward the $1.8K range, as indicated by the increase in green dots, suggesting active accumulation by major investors during a market sell-off. While this doesn’t immediately signal a trend parting, the concentration of whale activity near $1.8K reinforces this area as a critical demand zone that, if price stabilizes above $2K, could increase the likelihood of a broader recovery towards higher resistance levels.
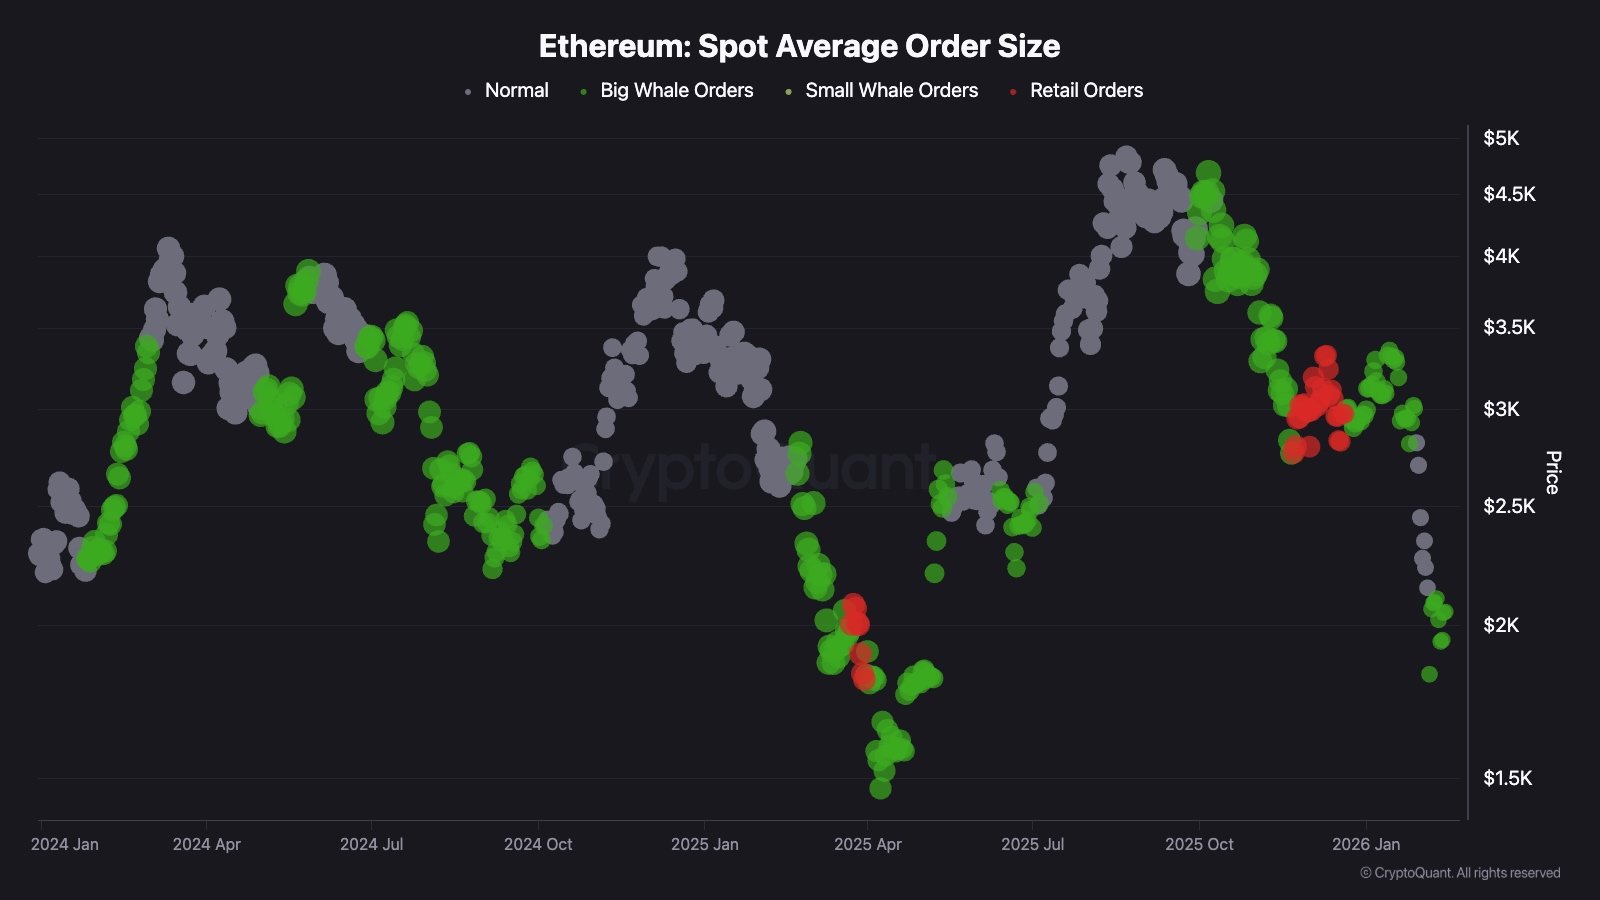 Average Order Size
Disclaimer: This analysis is strictly informational, and individuals are encouraged to perform their research before making any investment decisions.
