BTC Price Forecast: What's Next for Bitcoin Amid Weak Momentum?
An in-depth analysis of Bitcoin's price movements and market conditions, highlighting potential future trends.


Bitcoin is currently facing consistent pressure, having lost significant higher-timeframe support levels. This downturn indicates a shift from distribution to a possible downtrend. Momentum indicators remain weak, suggesting that any recent rebounds are corrective rather than signs of recovery, which increases the risk of further declines.
Bitcoin Analysis: Daily Chart
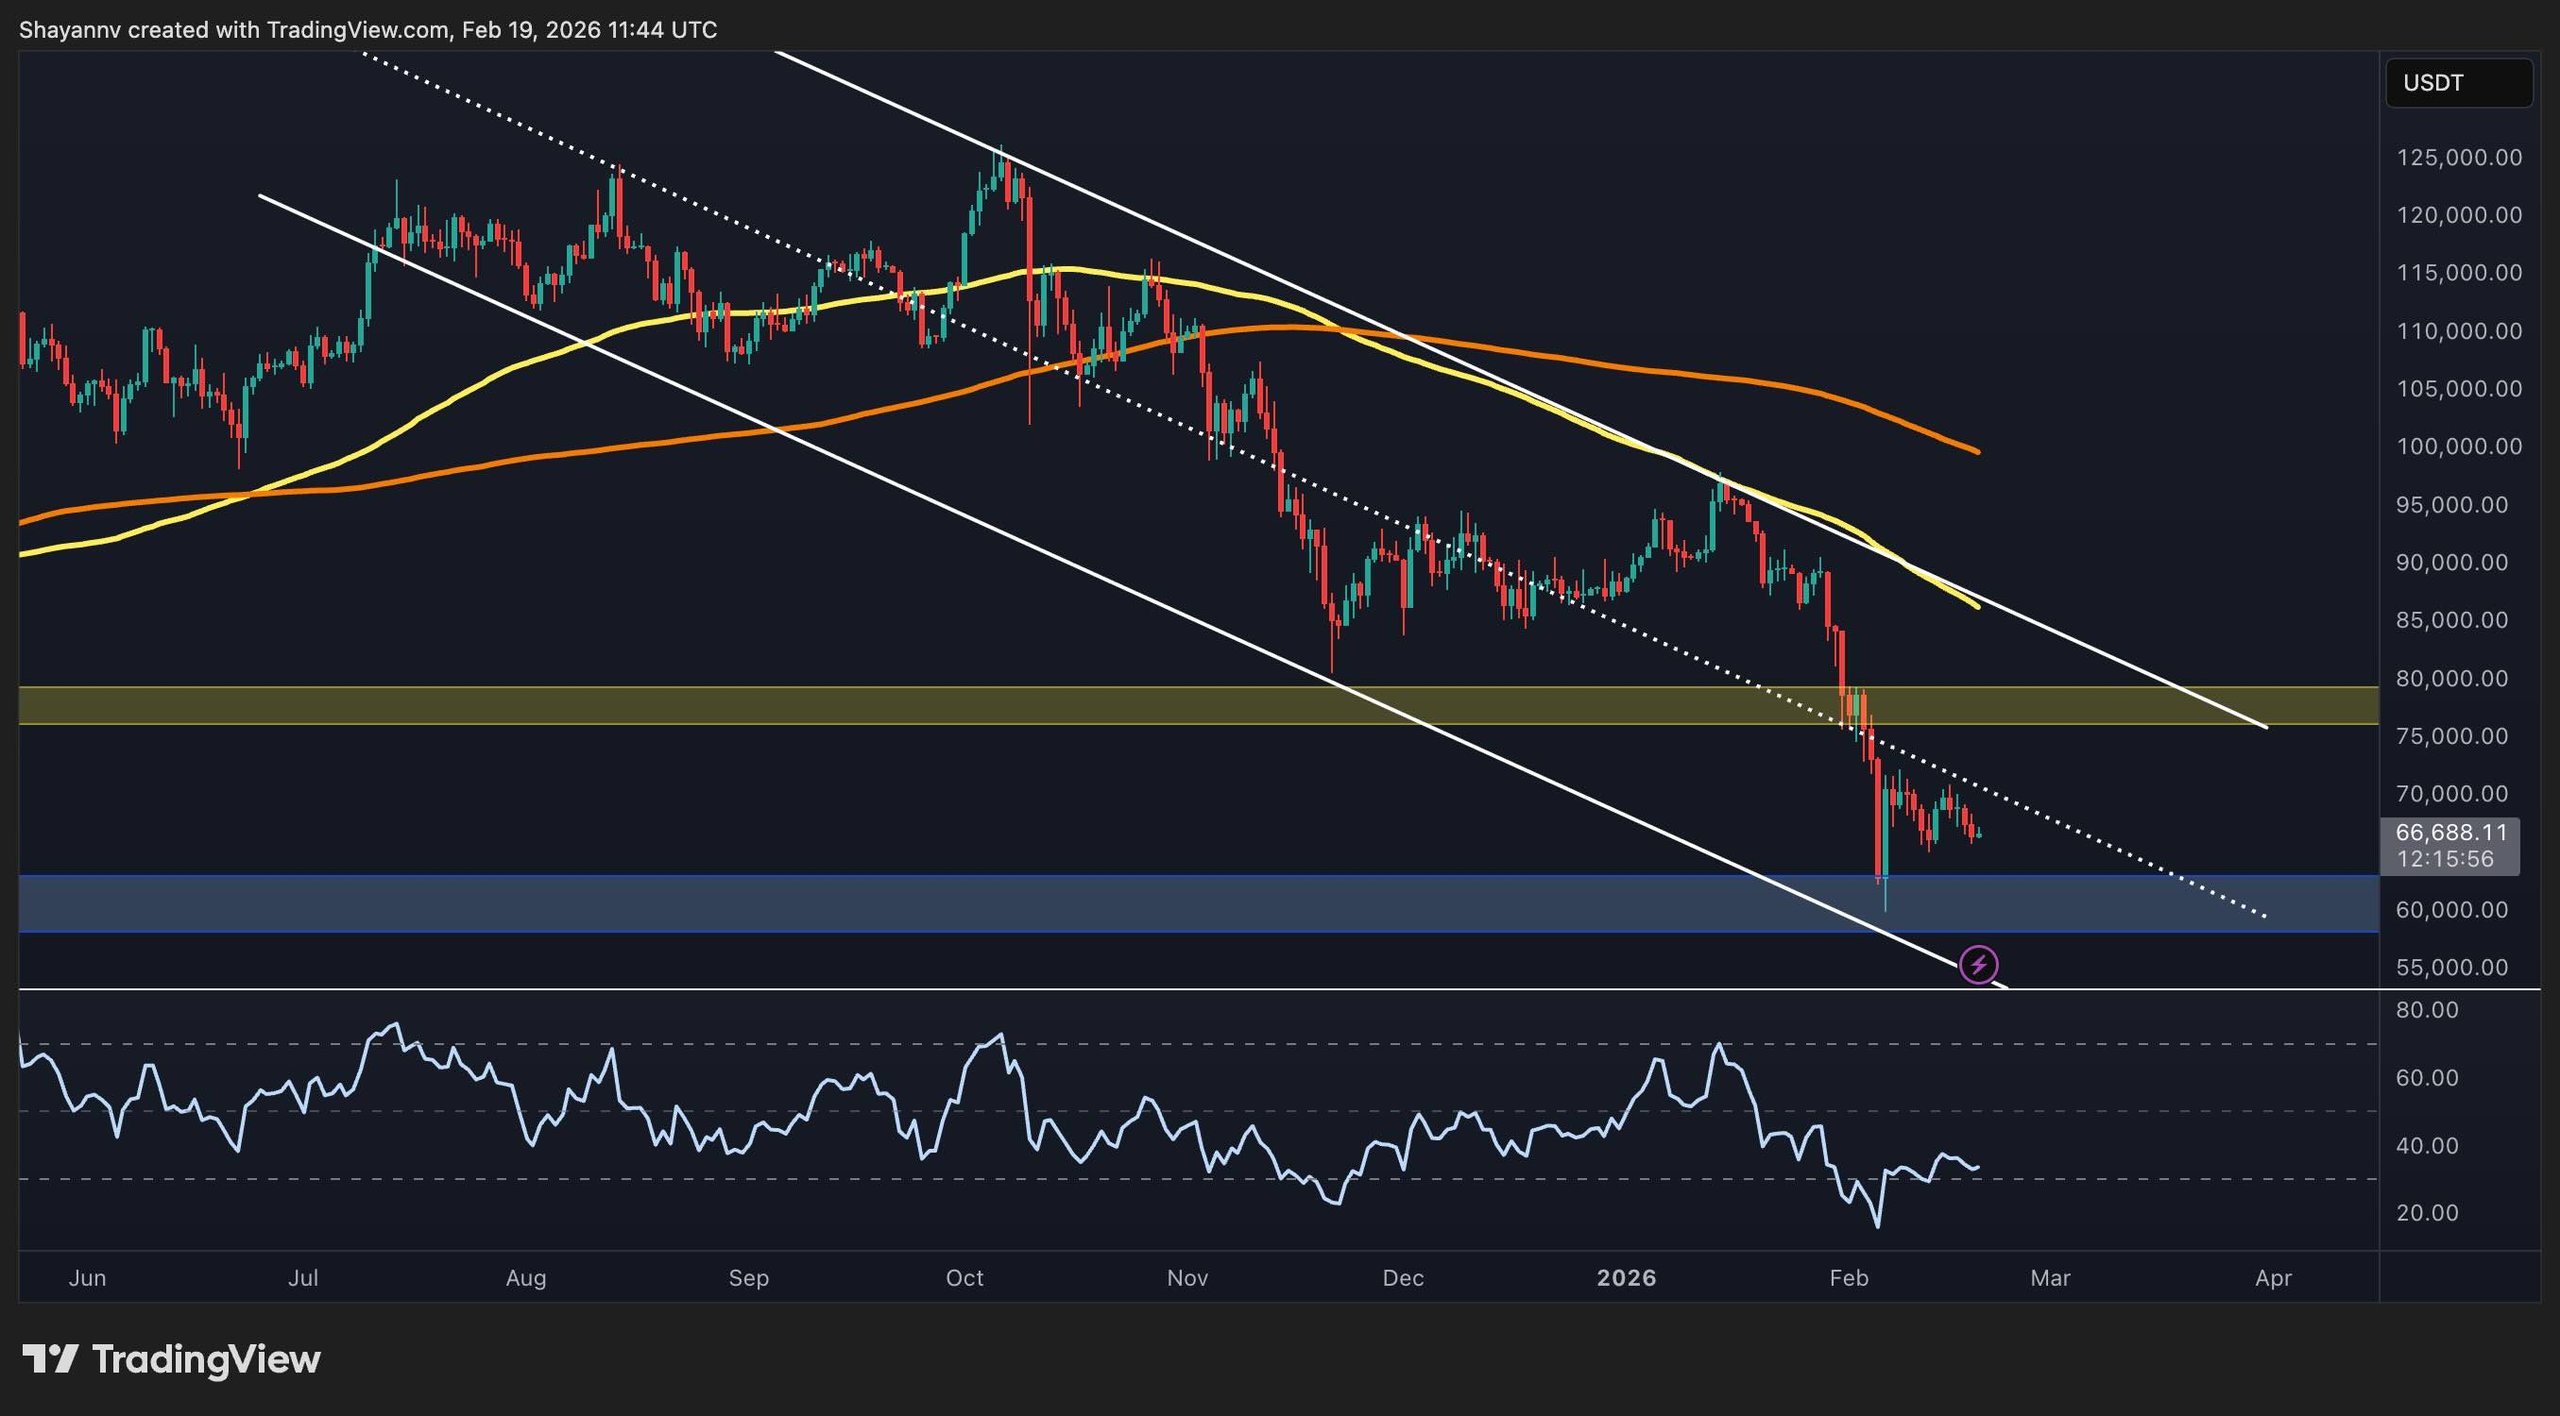
The daily price chart for Bitcoin shows its position within a descending channel, consistently trading below major moving averages, which points to a bearish structure in the market. The asset’s price rejection from mid-range resistance has led to a sharp decline towards the low-$60K region, confirming that sellers maintain control over the trend.
Momentum indicators are currently subdued; for example, the RSI is significantly below neutral levels, which indicates a lack of strong bullish signals. The uptrend may only resume if Bitcoin can reclaim the $75K–$80K resistance levels and close above the midpoint of the current channel. Until that happens, the prevailing trend seems inclined towards further declines or a lengthy consolidation near the critical $60K support region.
Daily BTC Chart
BTC/USDT 4-Hour Chart
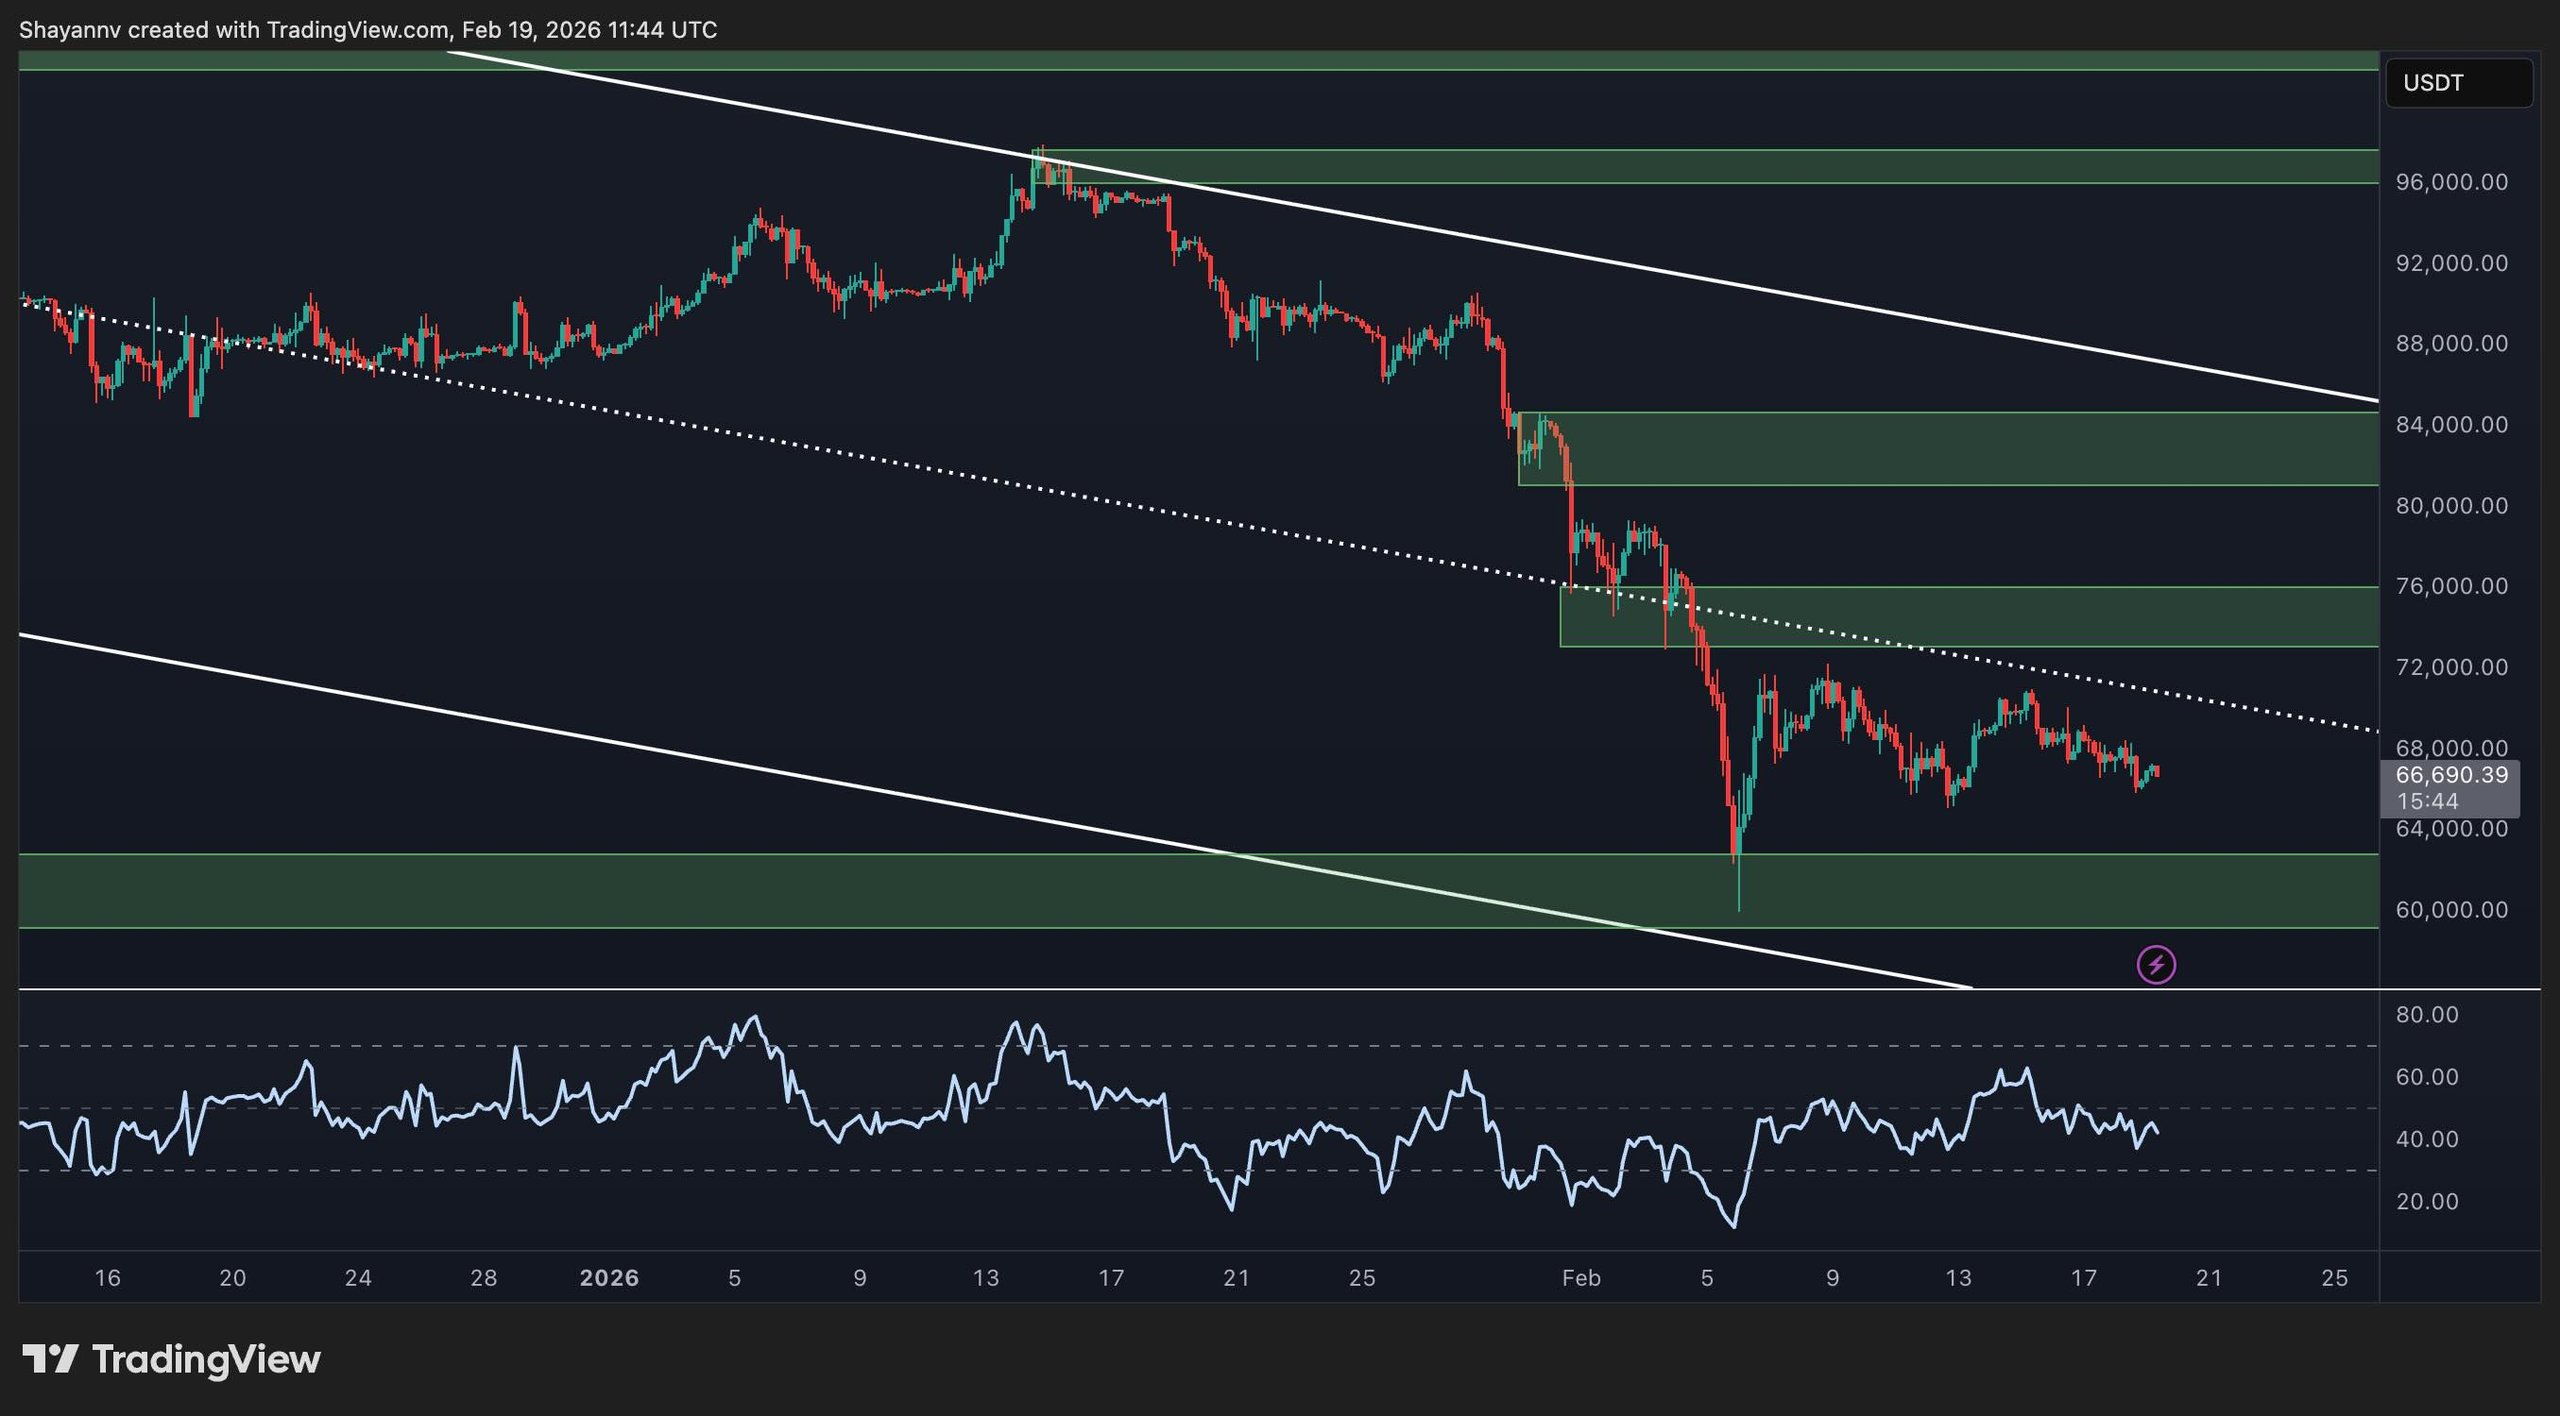
In the 4-hour timeframe, the price has experienced a sharp drop followed by volatile sideways movements, which could indicate an attempted accumulation after liquidations. The price continues forming lower highs beneath an overhead descending resistance line, suggesting buyers have not regained temporary control.
Key Levels
Support is noted near the recent wick low around the $60K mark, while immediate resistance is present in the $73K to $76K area. A breakout above this resistance range would indicate the first technical sign of a momentum shift. Conversely, dropping below the support zone may trigger another downward movement and potential mass liquidations.
 4-Hour BTC Chart
Market Sentiment
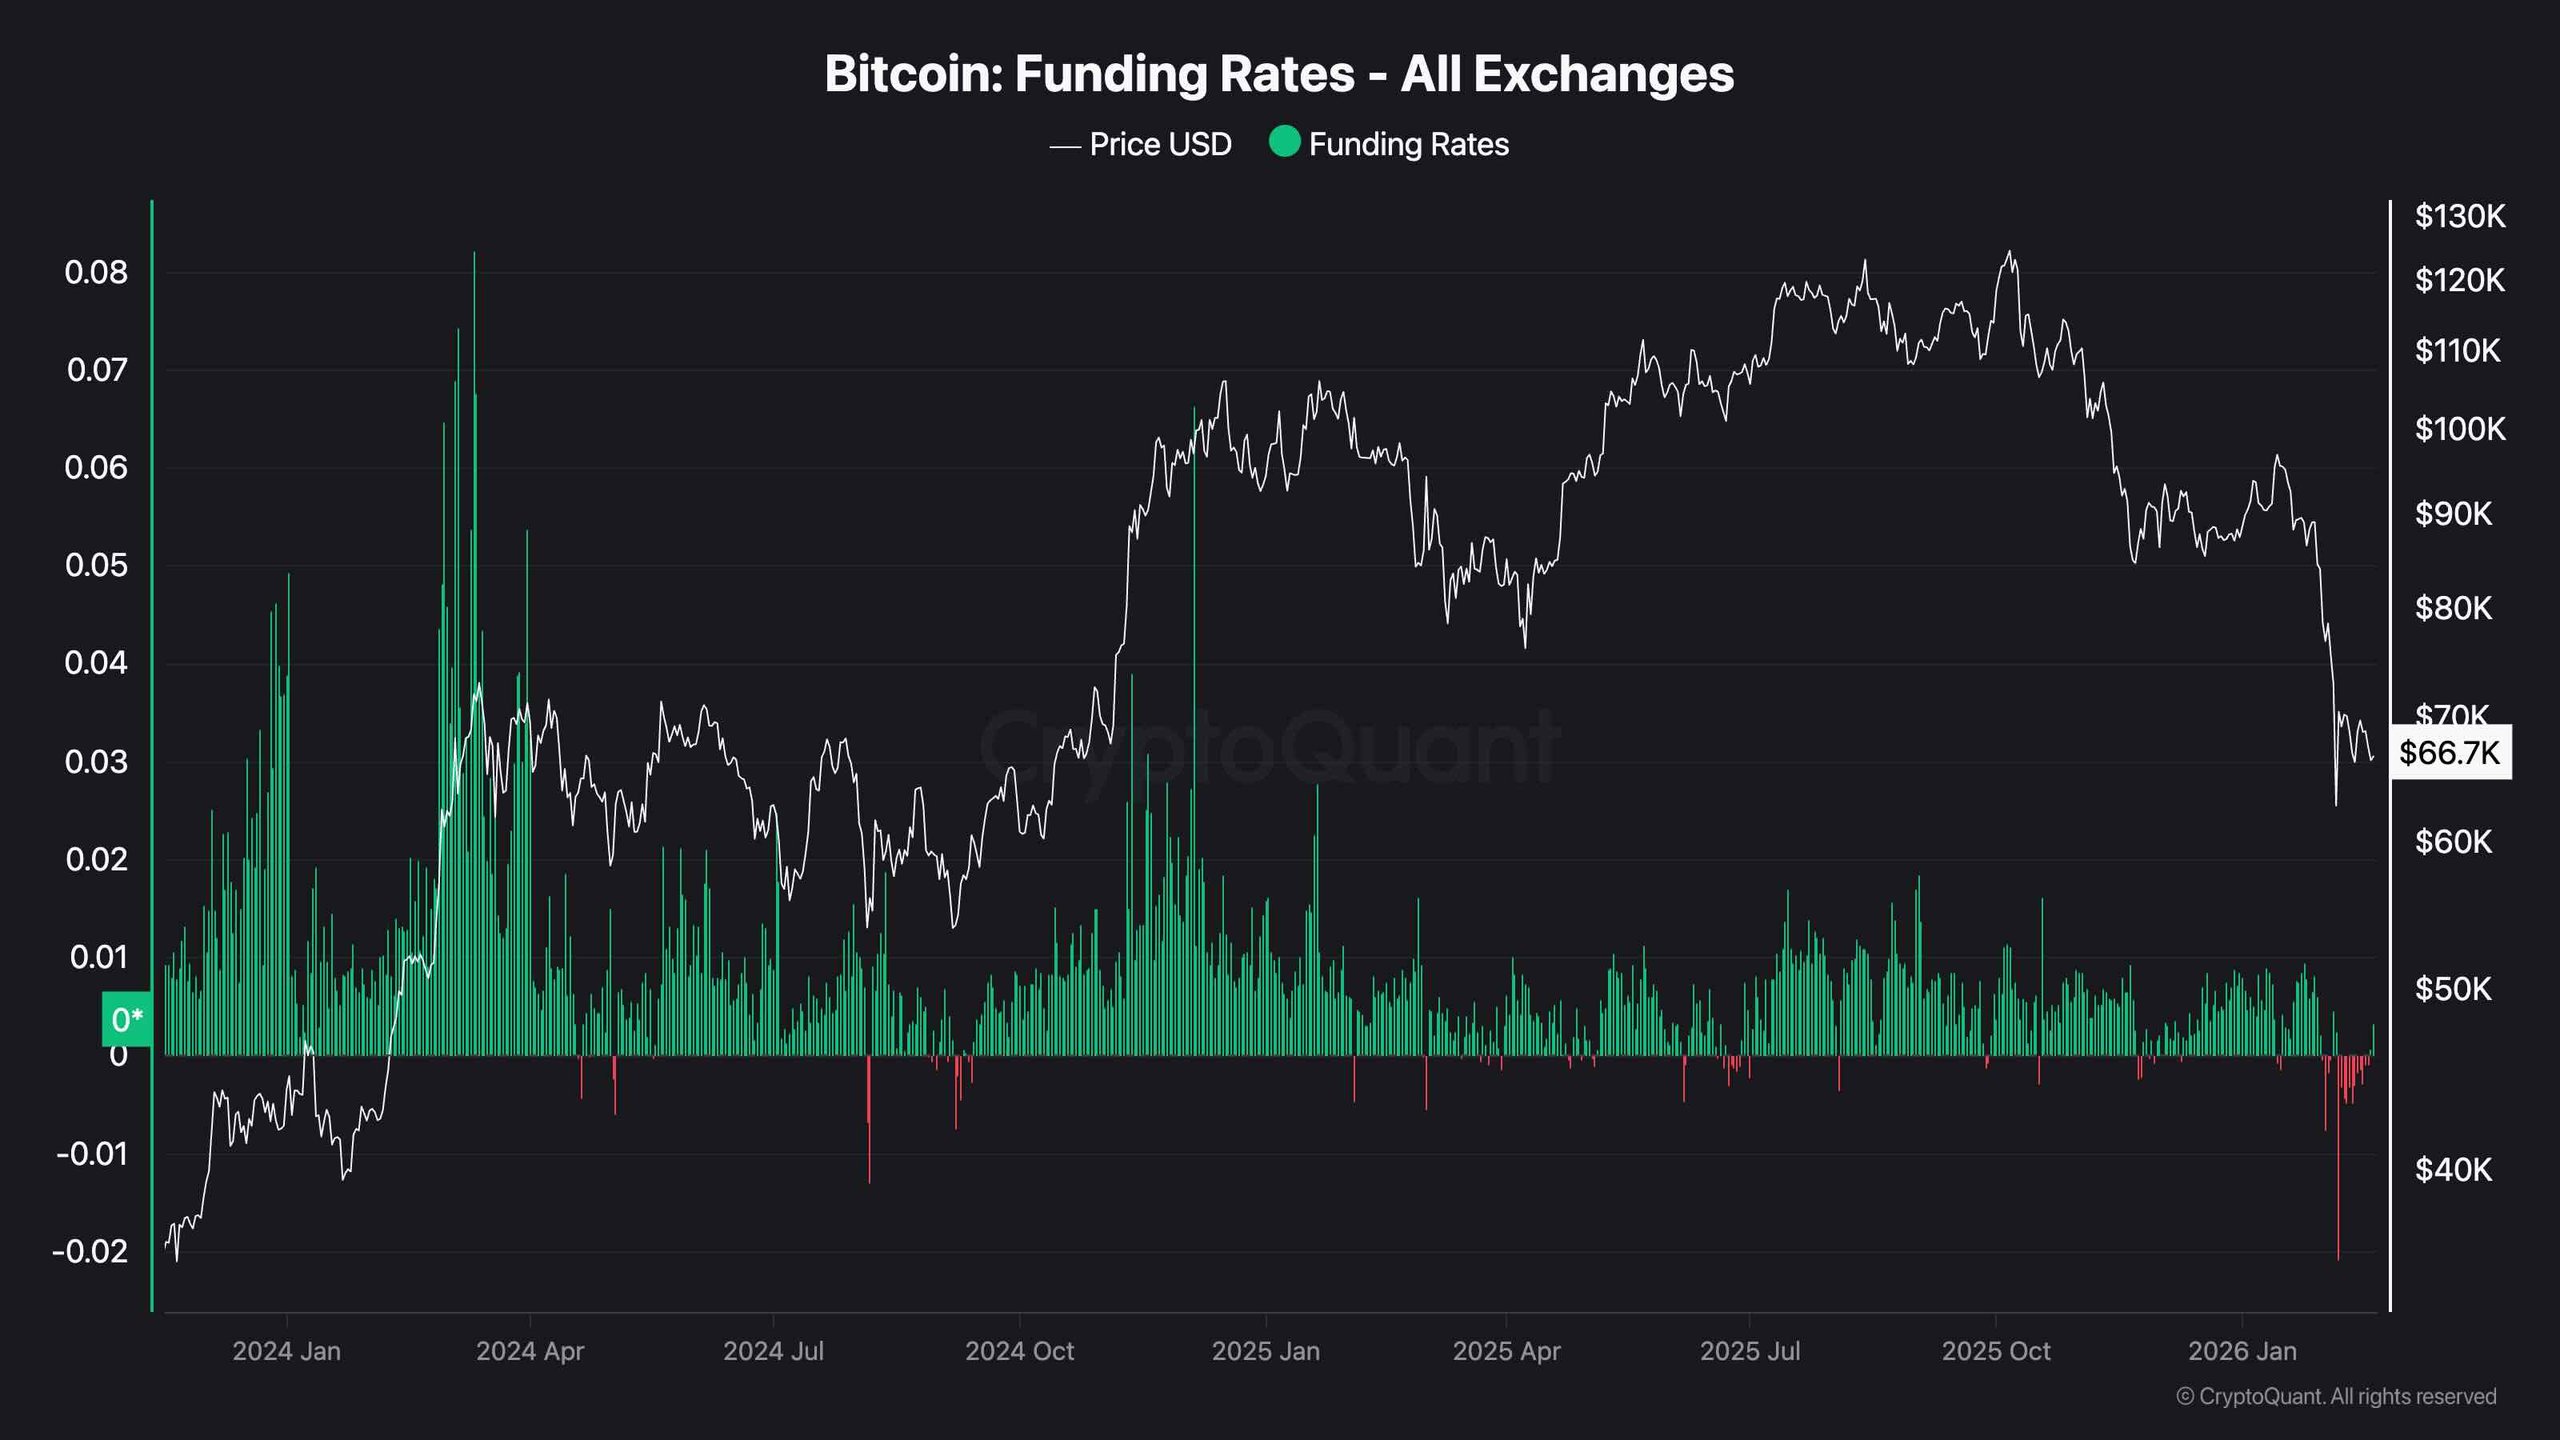
Recent funding rate data indicates a considerable cooling in market sentiment compared to previous overextended conditions. Deeply negative funding rates suggest reduced long-side leverage. While this reset can aid in the medium term, it does not immediately indicate an upcoming bullish reversal.
Overall market psychology seems cautious, which typically occurs before a range formation prior to the next significant move. For a decisive shift to bullish sentiment, a resurgence in price strength is required alongside controlled funding and improved momentum across various timeframes.
 Funding Rates
