
Analyzing the Outlook for Ethereum: Key Factors If $2K Support Breaks
This article explores Ethereum's current price dynamics and implications of a potential drop below the $2,000 support level.


After a substantial drop toward the $1,800 level, Ethereum’s market has entered a phase of mixed movements, indicating possible consolidation. The pivotal question remains whether this will lead to a positive breakout or continue the prevailing downward trend.
Ethereum Price Overview
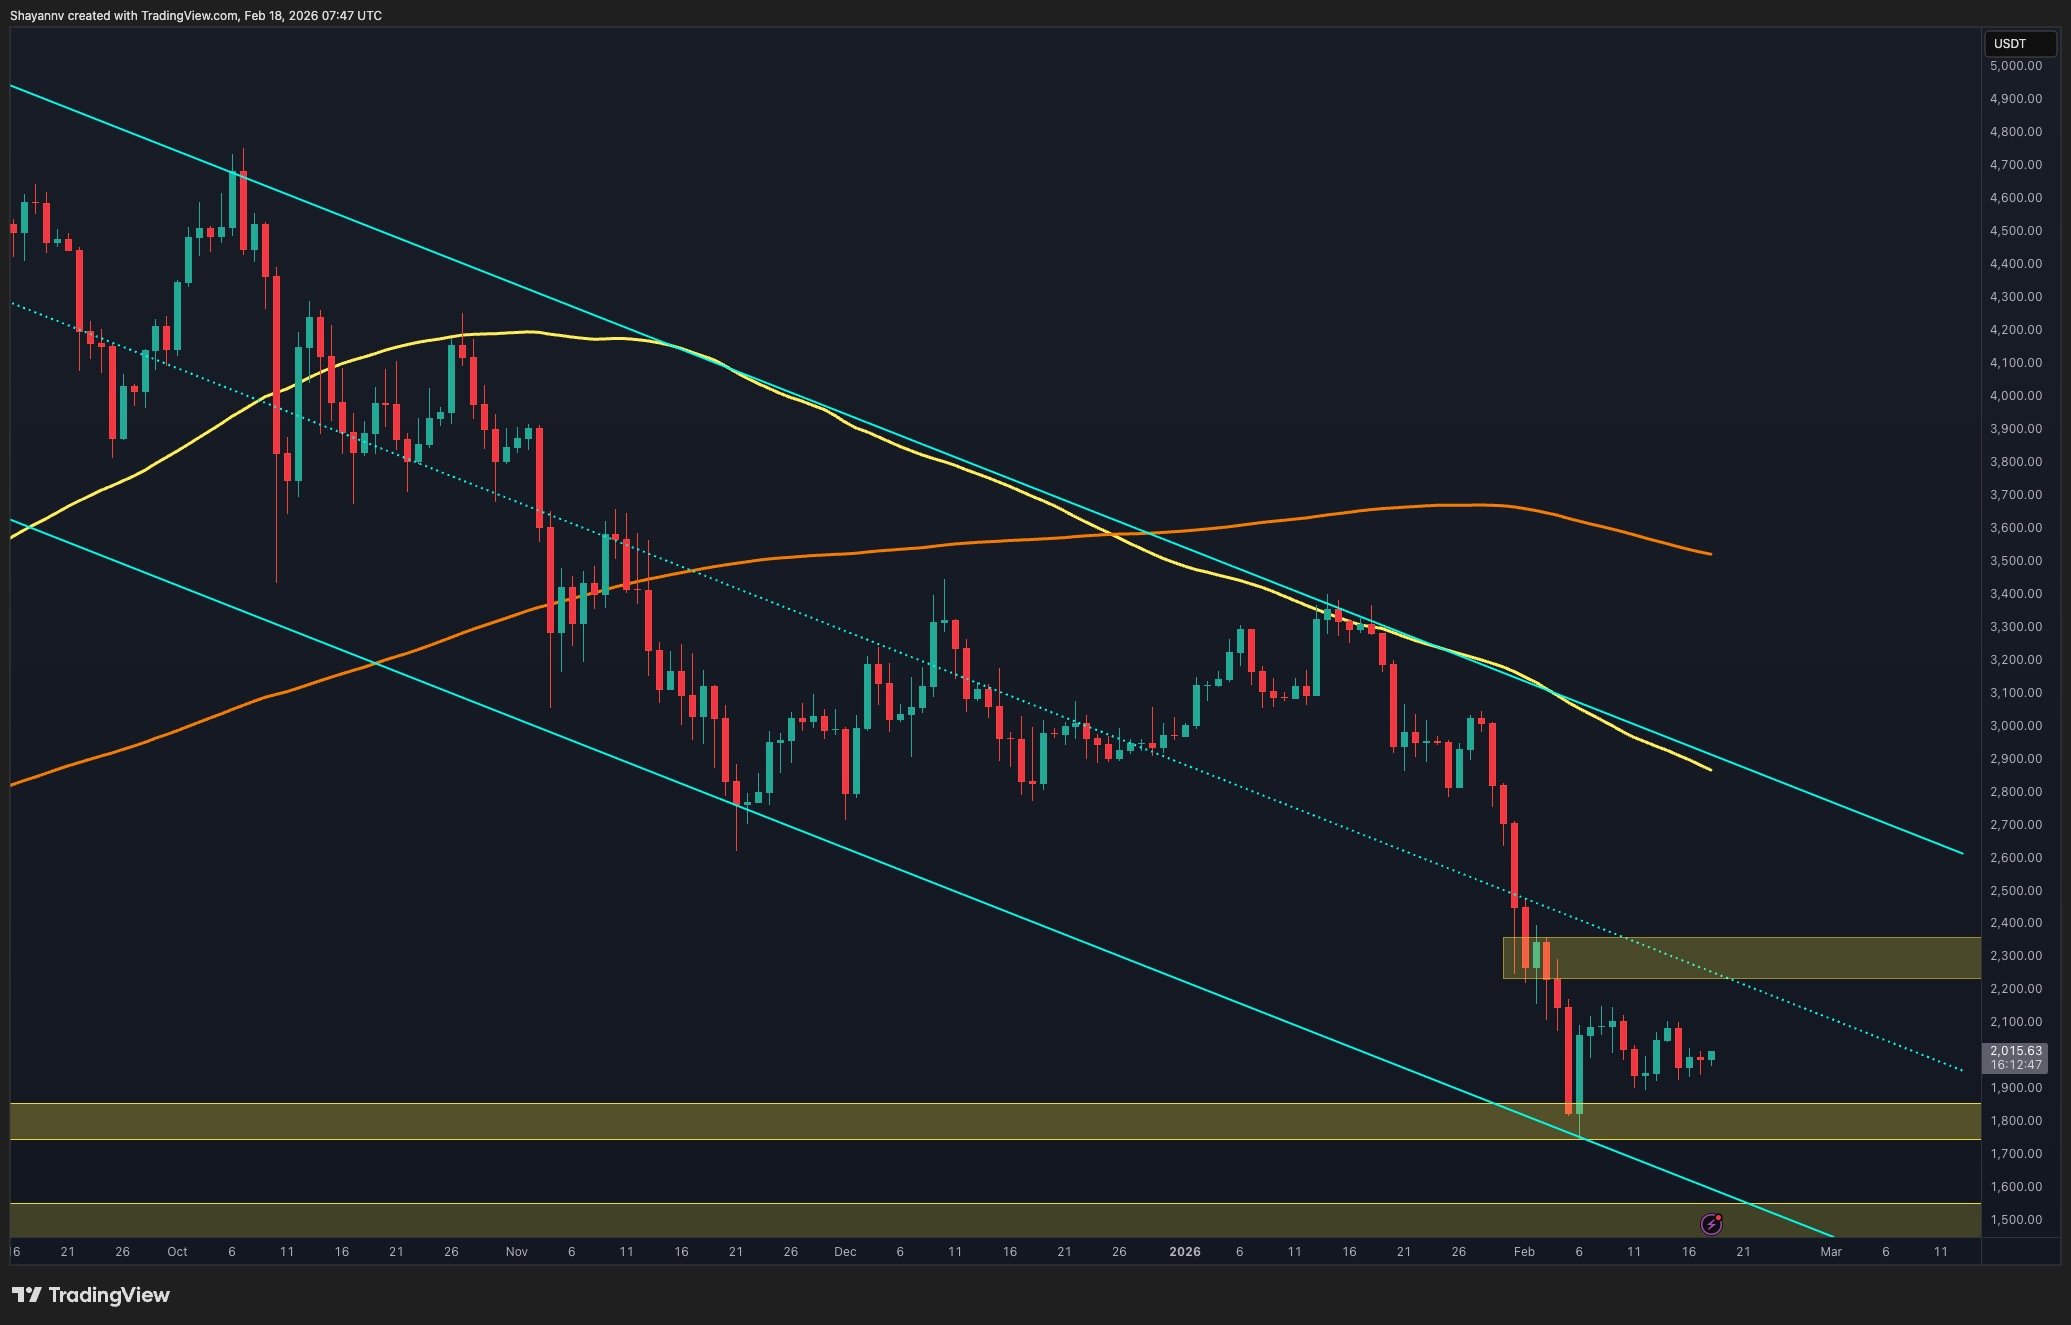
On the daily chart, Ethereum exhibits a distinct pattern of consolidation after its notable downturn. The fluctuating price indicates a standoff between buyers and sellers, characterized by inconsistent trading behavior.
This phase of consolidation situates between the static support of $1,800 and the dynamic resistance at the channel’s midpoint. This resistance consistently hampers bullish movements, while the $1,800 support has held strong against selling pressure.
As long as price action remains within these limits, the most likely scenario is oscillation within this range. A significant breakout above the mid-channel resistance would lead to potential gains, whereas dipping below $1,800 could confirm bearish trends.
 Ethereum Daily Chart
Ethereum in the Short-Term
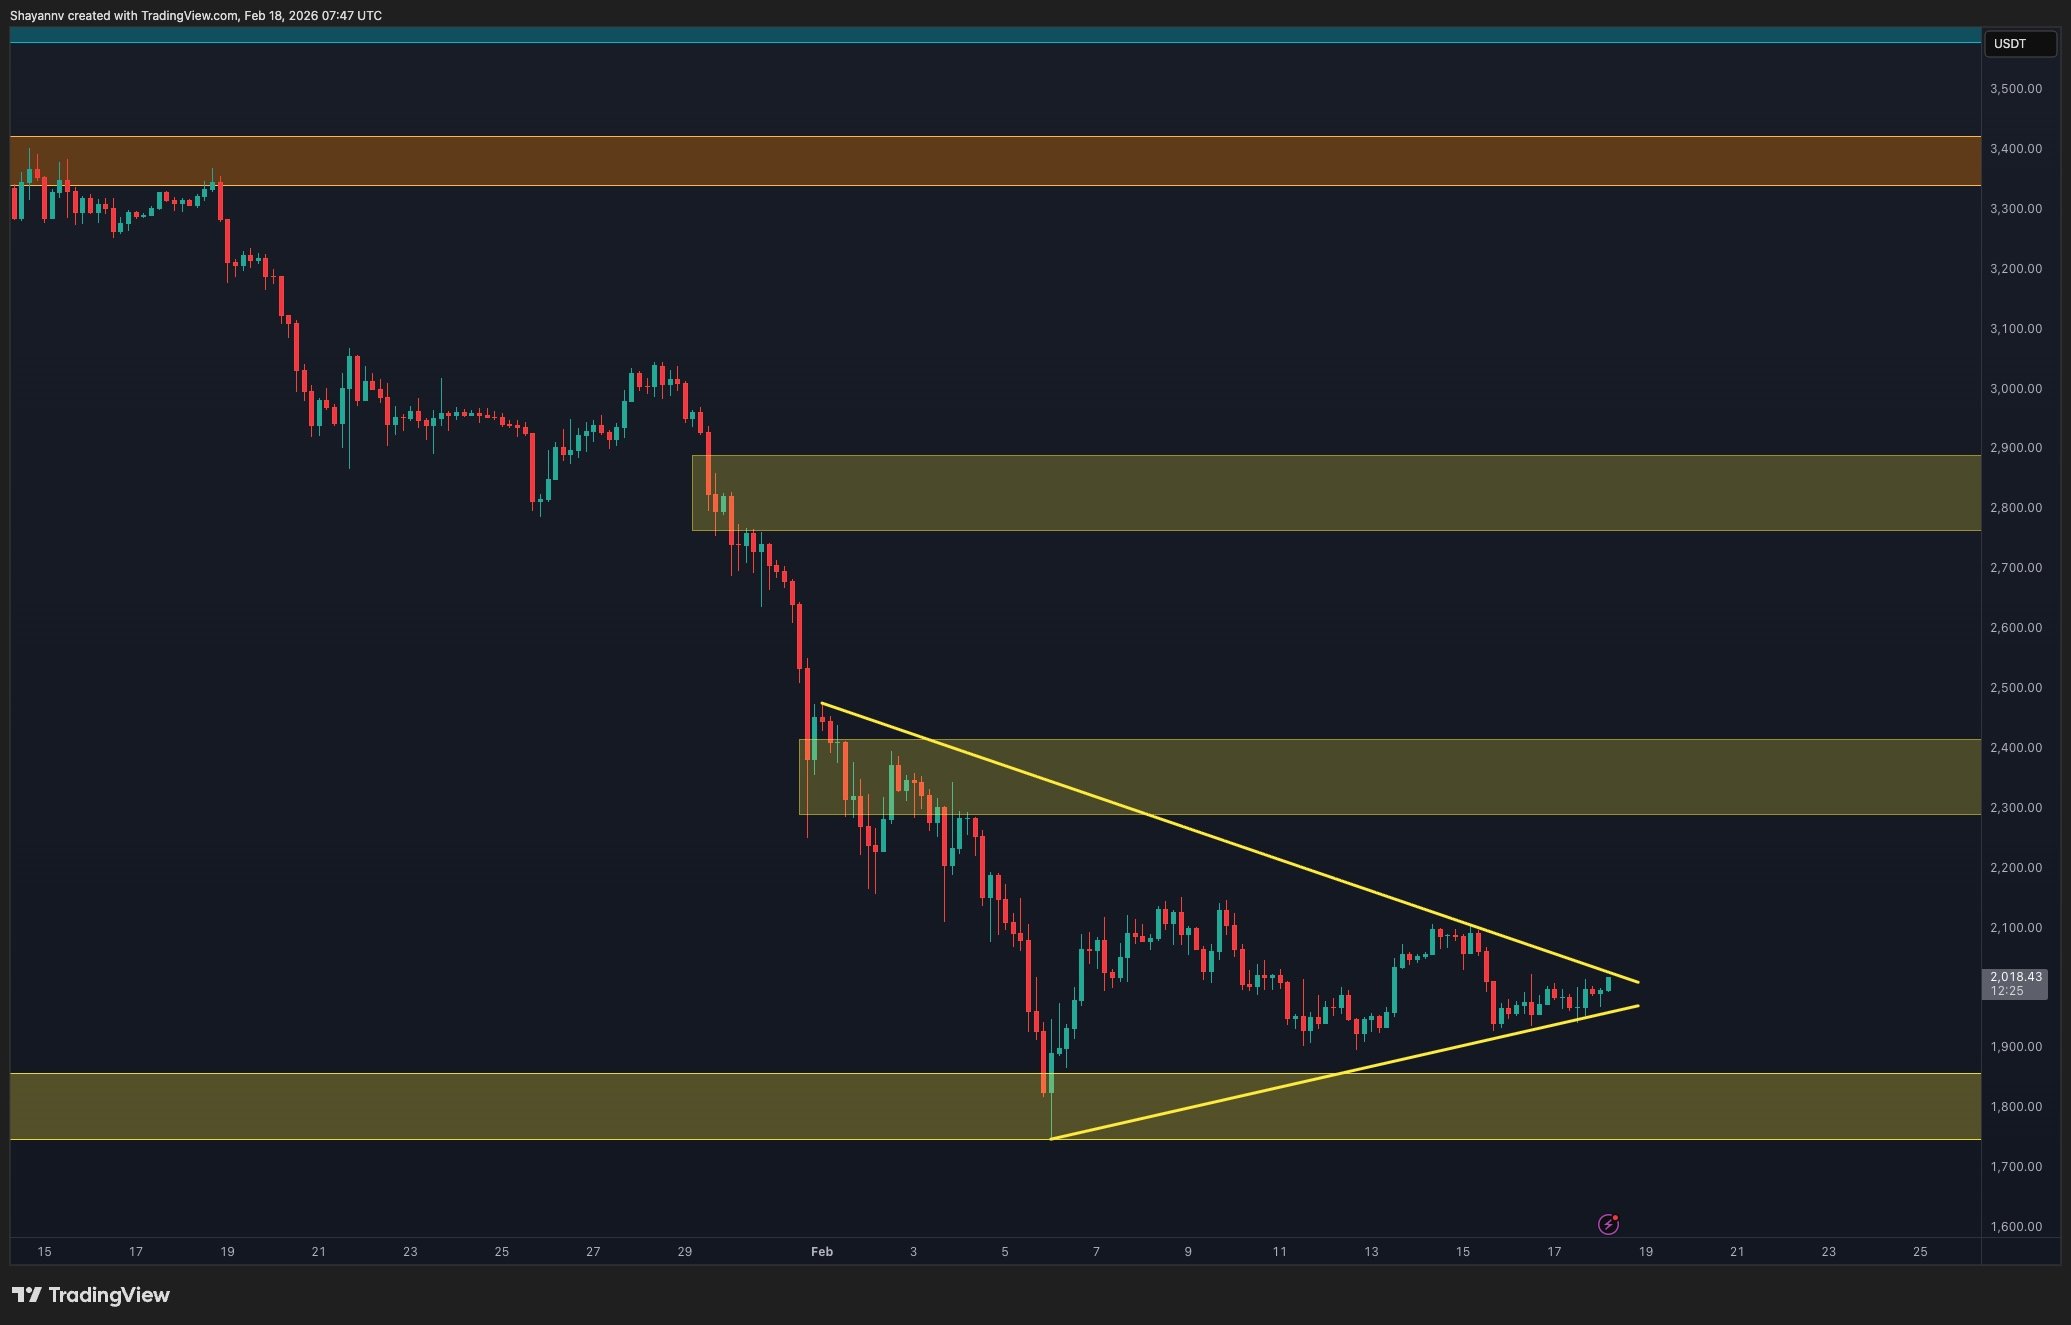
Looking at the 4-hour chart, the market structure tightens significantly. A well-defined triangle pattern has emerged, marked by declining resistance and ascending support, suggesting an impending breakout. Recent higher lows hint at an increasing likelihood of upward movement.
However, failure to surpass resistance could shift the market momentum back to sellers. Targets are visible on the chart, with initial resistance situated around $2,400.
 4-Hour Ethereum Chart
Market Sentiment
According to the Binance ETH/USDT liquidation heatmap, significant liquidity trends are observed around the current trading range. A concentration of short liquidations is noted above the current price, suggesting potential upward movement to trigger these positions.
In contrast, increasing liquidity is visible below the market, indicating traders are preparing for potential upward trends near the consolidation zone.
Overall, Ethereum appears to be in a state of compression. The daily chart illustrates a balance in broader downtrends, while the 4-hour chart shows a triangle nearing resolution, indicating that a breakout could be forthcoming.
