Bitcoin Price Evaluation: Is It Critical for BTC to Surpass the $70,000 Resistance Level?
Analyzing Bitcoin's recent fluctuations and the importance of reclaiming the $70K resistance.


Bitcoin’s recent drop towards the $60K area has led to significant market volatility, with the cryptocurrency now trying to stabilize near a crucial demand zone. Indicators across different timeframes indicate that the market is nearing an important decision point, particularly with the added sensitivity from leverage dynamics.
Bitcoin Price Analysis: Daily Overview
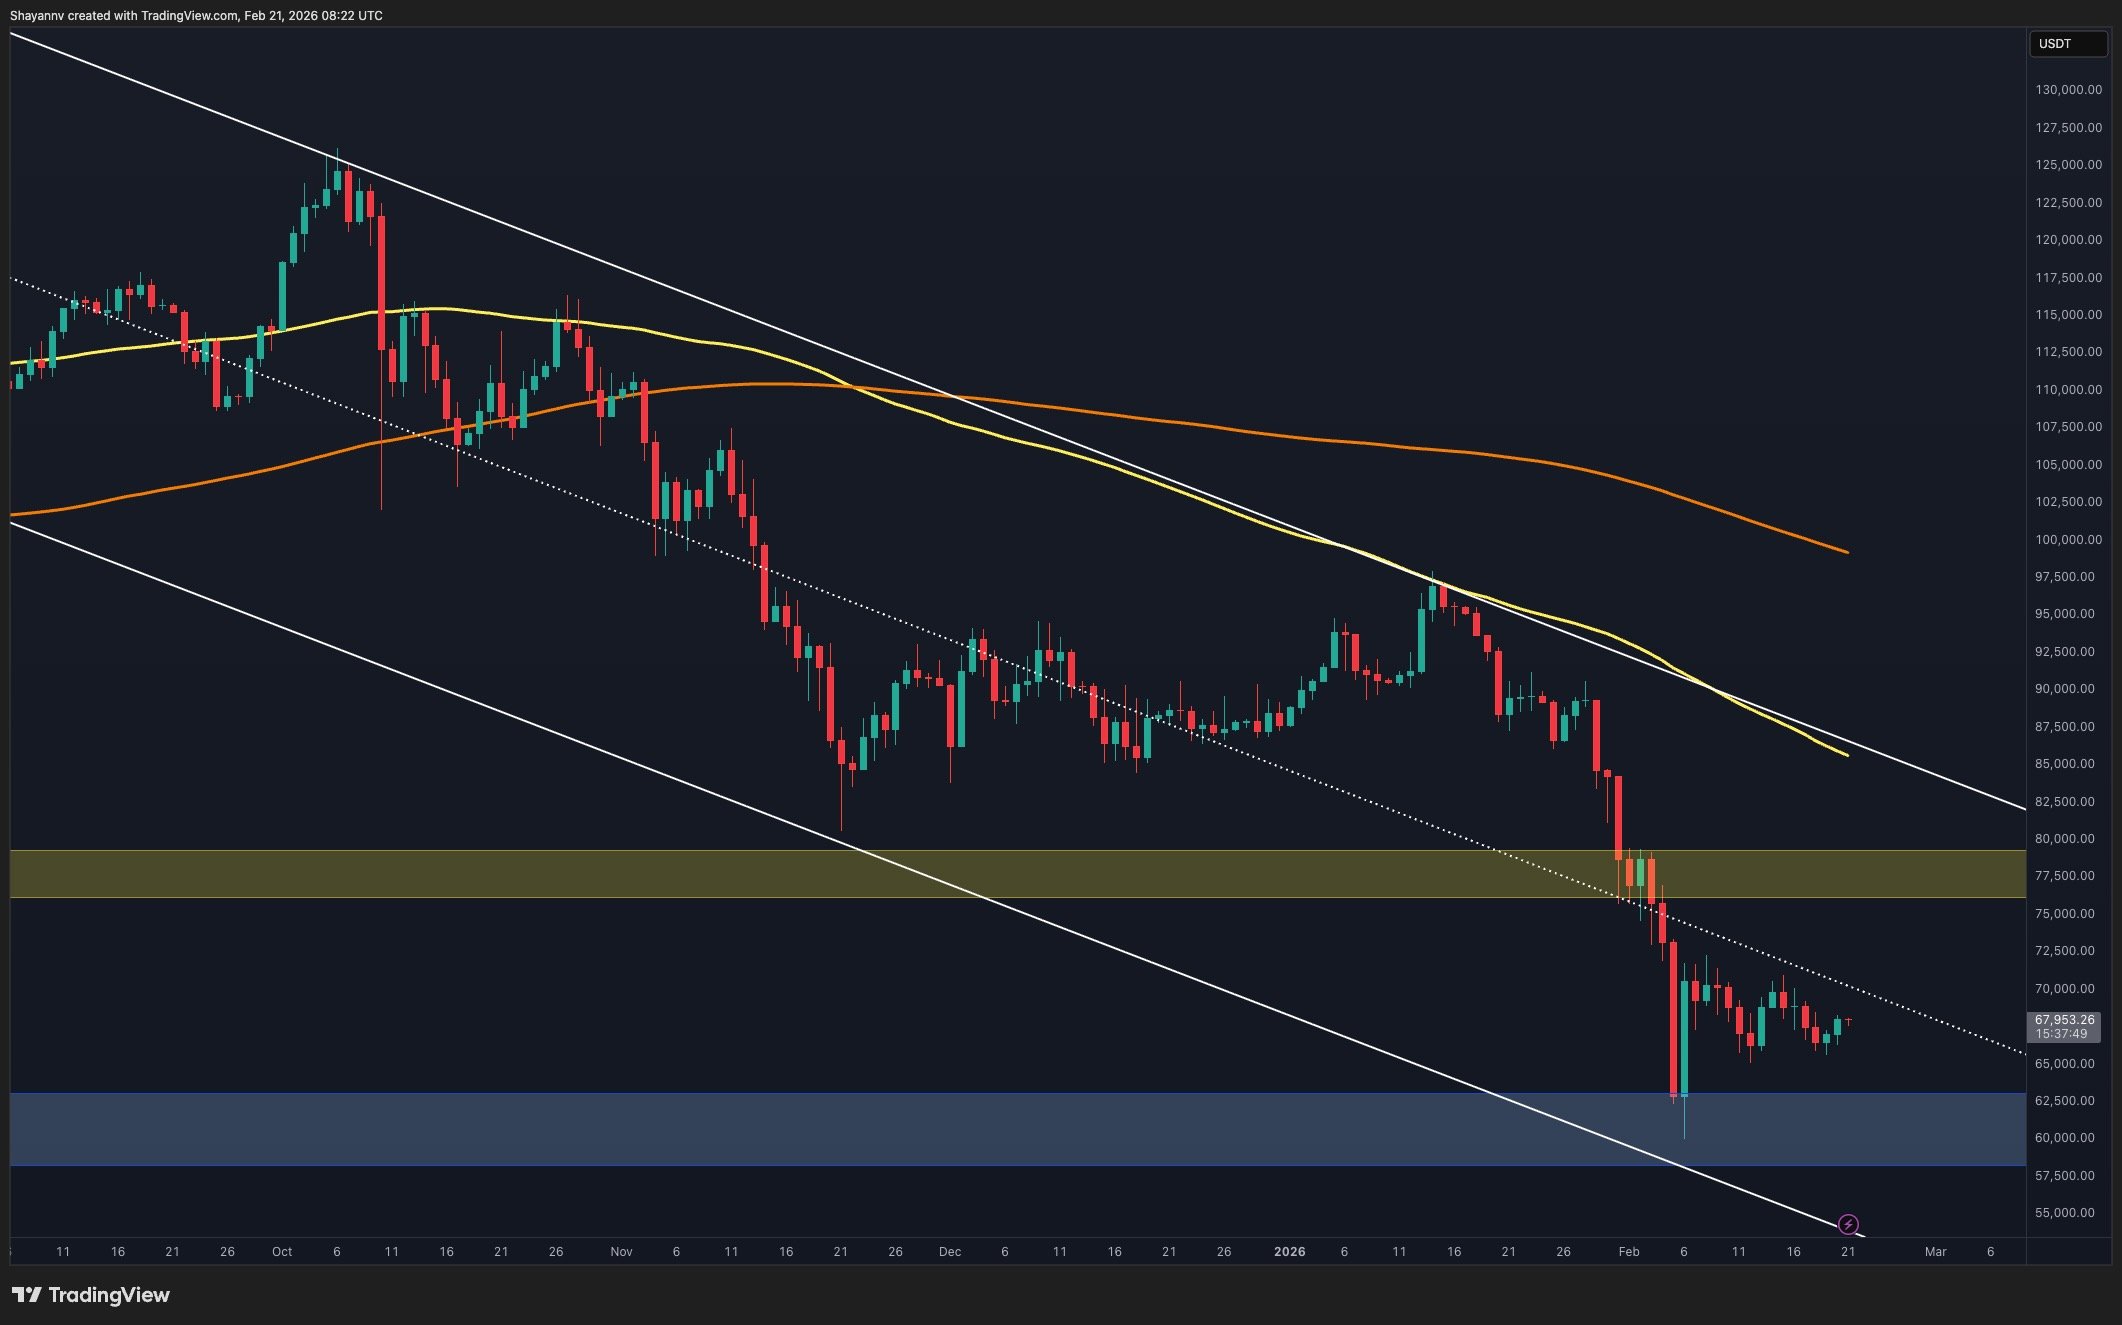
On the daily chart, Bitcoin is navigating within a clearly defined descending channel, continuing to create lower highs and lower lows. The latest selling pressure has pushed the price directly to the $60K–$63K demand zone, where buying interest has emerged to prevent further declines.
Despite this, the overall market sentiment remains bearish. Bitcoin’s price is still below the 100-day and 200-day moving averages, which are both trending downwards and serving as resistance. The $75K–$80K region now acts as a significant resistance area, aligned with prior breakdown structures, which will pose a major obstacle if a recovery is attempted.
As long as Bitcoin remains below the median channel resistance and moving averages, any upward movement should be regarded as a corrective bounce. It’s vital for BTC to maintain its position above the $60K demand zone; otherwise, renewed selling could drive the price lower within the channel.
Daily Chart
4-Hour BTC/USDT Chart
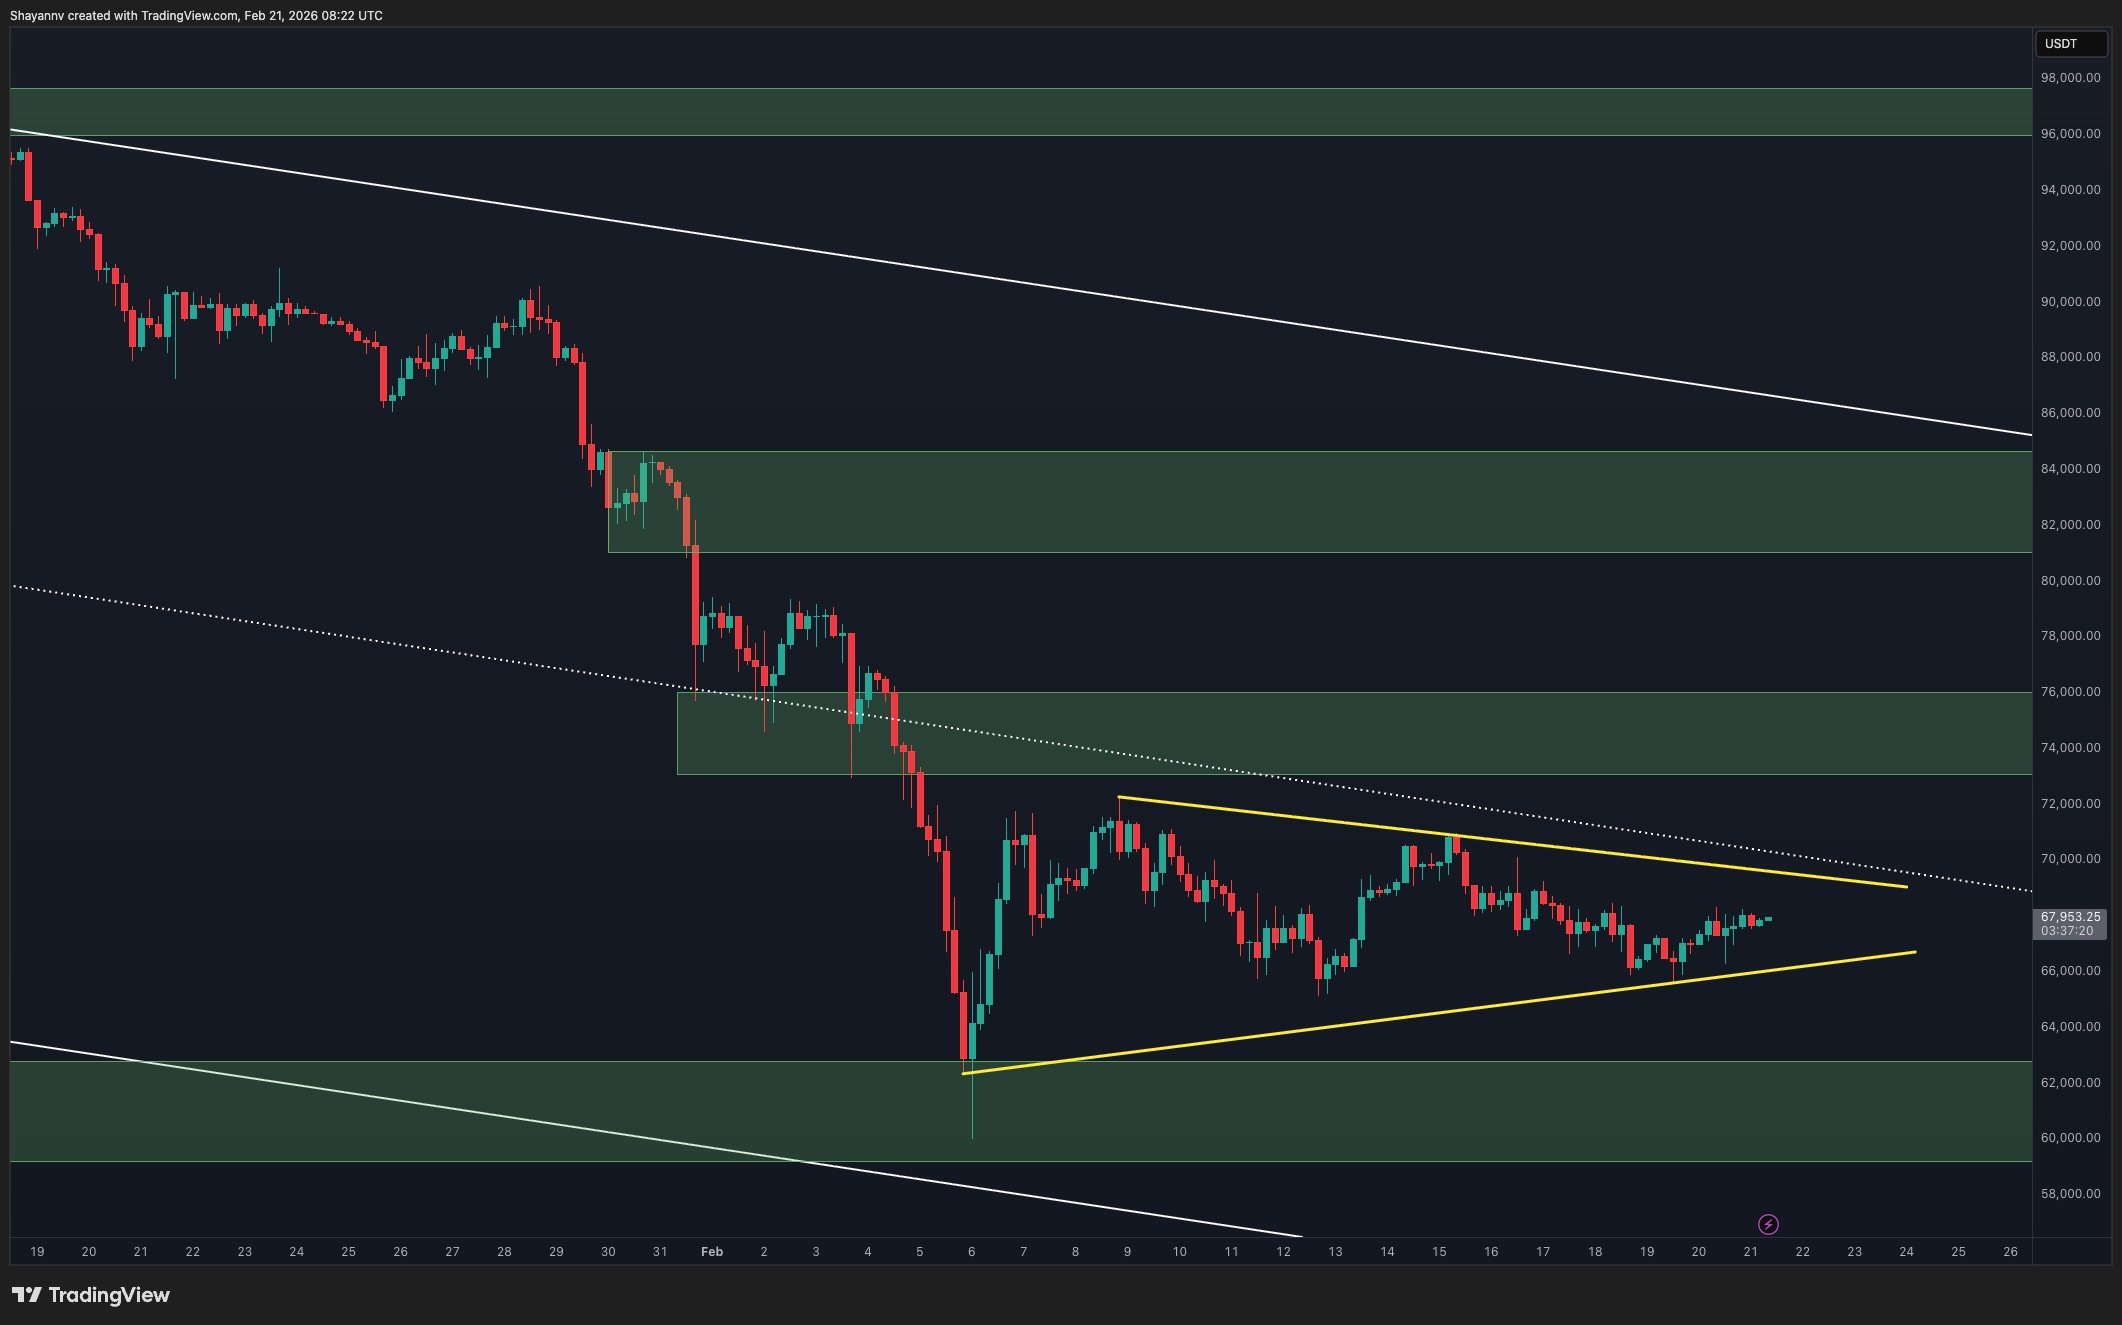
In the 4-hour timeframe, Bitcoin is consolidating within a tightening symmetrical triangle following a bounce from the $60K low. This pattern reflects a short-term balance after extreme market movement, with the upper boundary acting as resistance and the ascending lower trendline offering support.
Currently, Bitcoin is compressing near the triangle’s apex, indicating a breakout may be on the horizon. A bullish breakout above this triangle could lead to a rise towards the $74K–$76K resistance zone, coinciding with previous breakdown areas. Conversely, a bearish breach could revisit the $60K demand zone and possibly trigger a deeper liquidity sweep.
 4-Hour Chart
Market Sentiment Analysis
The Estimated Leverage Ratio on Binance has substantially decreased alongside Bitcoin’s price, signifying that a considerable number of leveraged positions have been wiped out. This deleveraging reduces immediate risks while suggesting that some excess speculative exposure has been cleared from the market.
Currently, leverage levels are stabilizing at lower readings compared to previous highs. While this lowers the risk of a dramatic short squeeze in the immediate future, any resurgence in leverage could magnify the impact of the next breakout from current consolidation.
Overall, Bitcoin is at a notably critical stage technically. The price is holding above a major daily demand area, the short-term structure is compressing, and leverage has reset. The next major price movement is likely to be driven by a decisive breakout from the 4-hour triangle, with $60K as the pivotal downside support and the $75K region as a key upside target.
