

After a substantial sell-off toward the $1,800 mark, the Ethereum market currently reflects indecisive consolidation. Observations indicate that lower timeframes are nearing an essential breakout point as narratives shift. The pressing question concerns whether this compression leads to an upward breakout, or if it will continue within the existing downtrend.
Daily Chart Overview
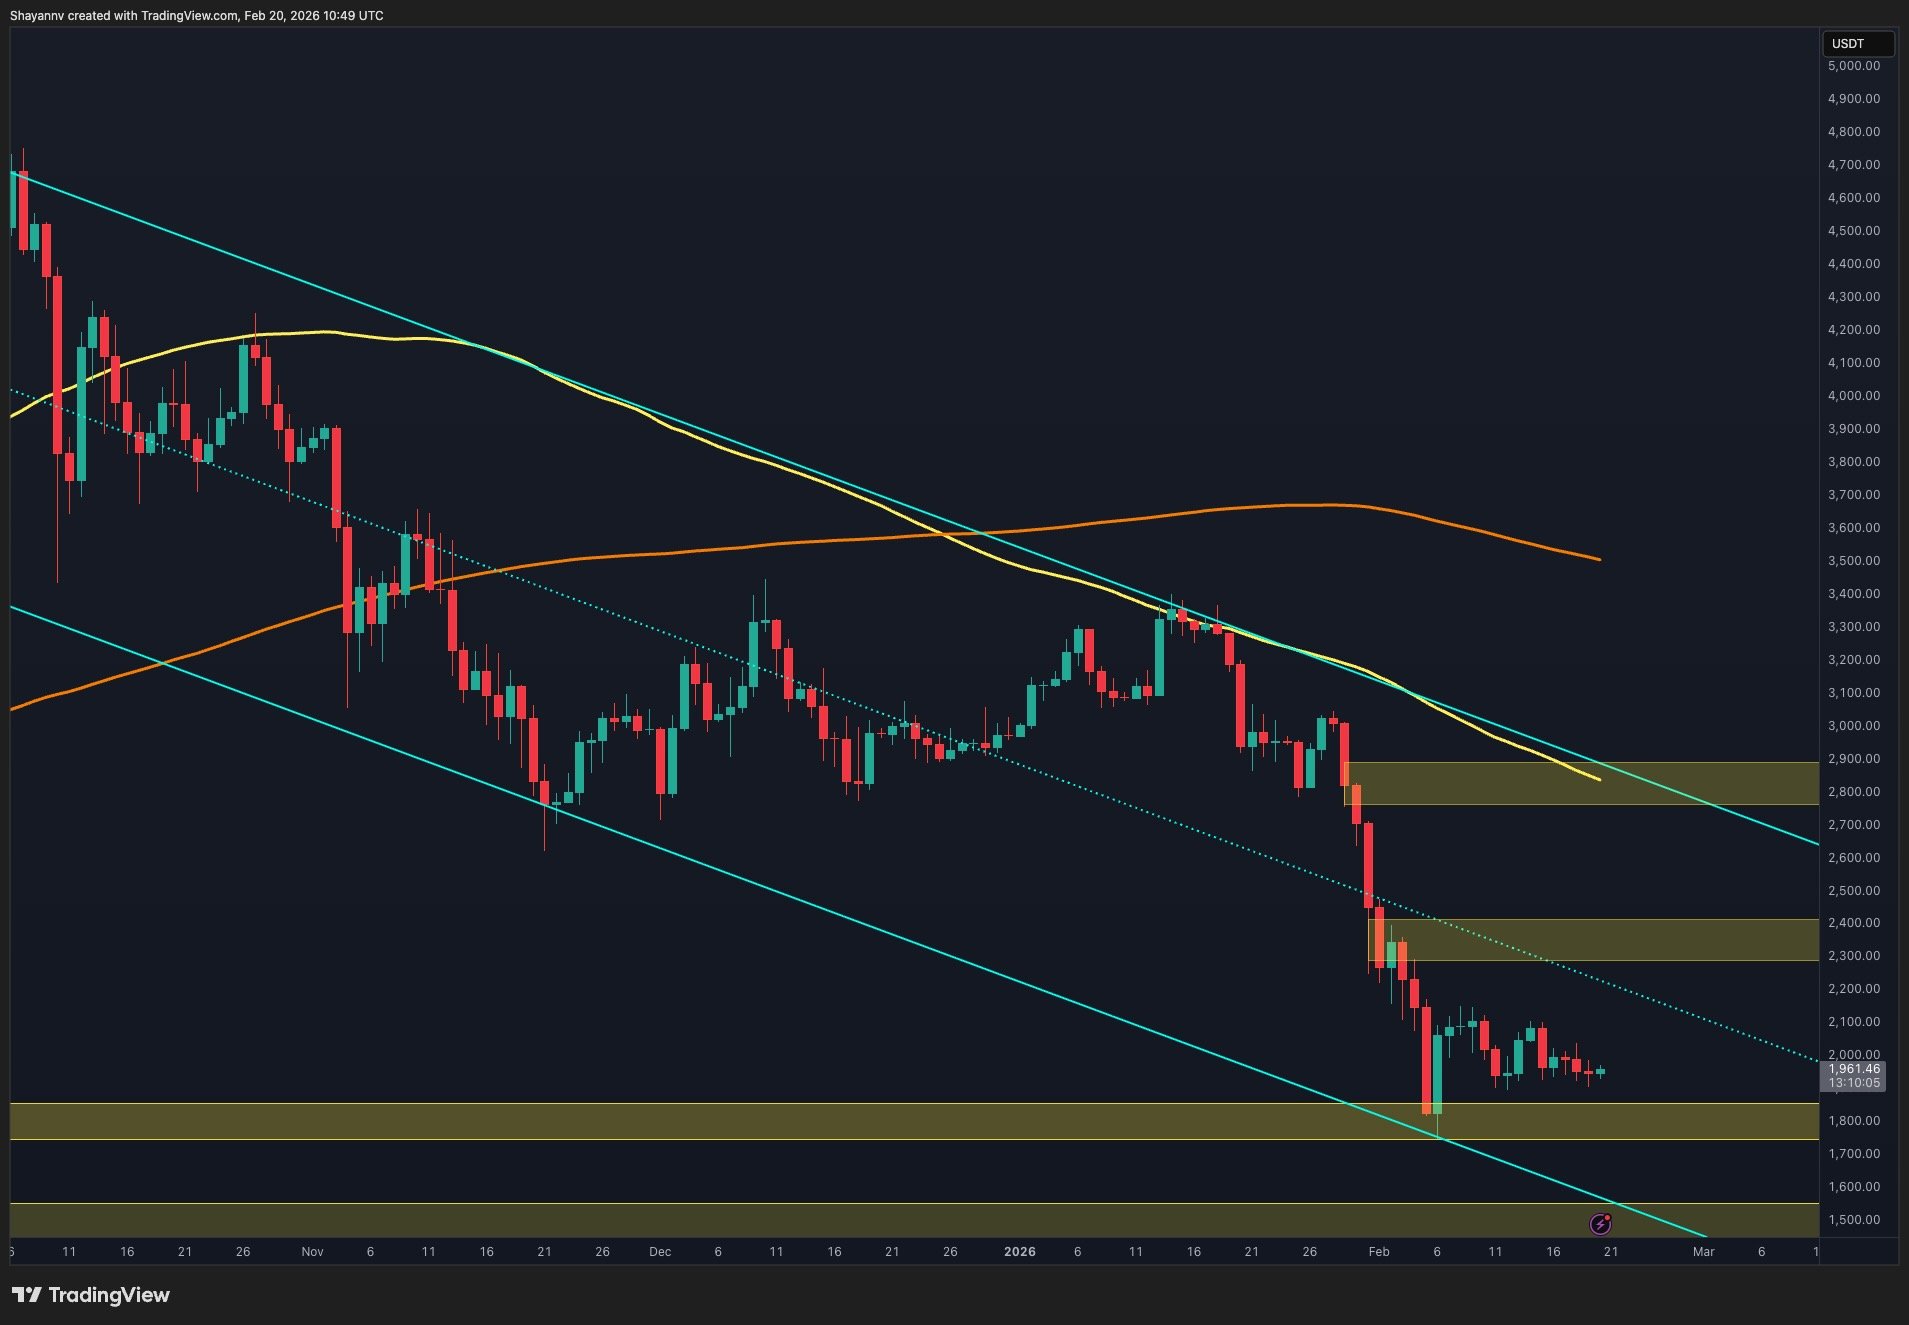
On the daily chart, Ethereum trades within a descending channel, with its midline acting as dynamic resistance and the $1,800 region serving as a robust support base. The market activity has become choppy, characterized by overlapping candles and minor retracements rather than aggressive movements, signaling a state of equilibrium.
This range remains limited between the mid-boundary of the channel above and the demand zone below. Attempts to elevate prices have repeatedly stalled at significant resistance levels, while sellers are yet to provoke a decisive breakdown beneath the support line. Absent a violation of these bounds, the expectation leans towards continued range-bound activity.
A confirmed breakout above the midline could clear the way to the next resistance zone around $2,300 to $2,500, whereas breaching the $1,800 mark would undermine this equilibrium and likely induce fresh bearish momentum.
Daily Chart
4-Hour Chart Analysis
Looking at the 4-hour period, a prominent triangle pattern emerges, defined by descending resistance and ascending support. This structure indicates a contraction in volatility and is nearing its apex, hinting that a breakout may be imminent. Recent trends show higher lows, reflecting a growing demand in the short term, enhancing the likelihood of a positive resolution. However, Ethereum must surpass the 0.5 Fibonacci level at $2,396 to redefine the technical landscape within the broader downtrend. A conclusive breach of the triangle would propel momentum towards the 0.618 Fib level at $2,549.
If upward movements falter, a decisive breach of the ascending support could expose the $1,800 to $1,746 area again, confirming a continuation pattern over any reversal attempts.
Overall, Ethereum is at a critical technical juncture, with Fibonacci resistance levels laying out potential upside targets and the $1,800 base providing downside safety.
