After Monday's Flash Crash: What Lies Ahead for XRP?
An in-depth exploration of Ripple's XRP price dynamics following recent market fluctuations.


Ripple’s XRP has mirrored broader market trends recently, enduring a price drop that underscores persistent weakness in a declining market. The asset’s price trajectory illustrates active trading within a set range as it anticipates a significant breakout.
XRP Price Overview: Daily Analysis
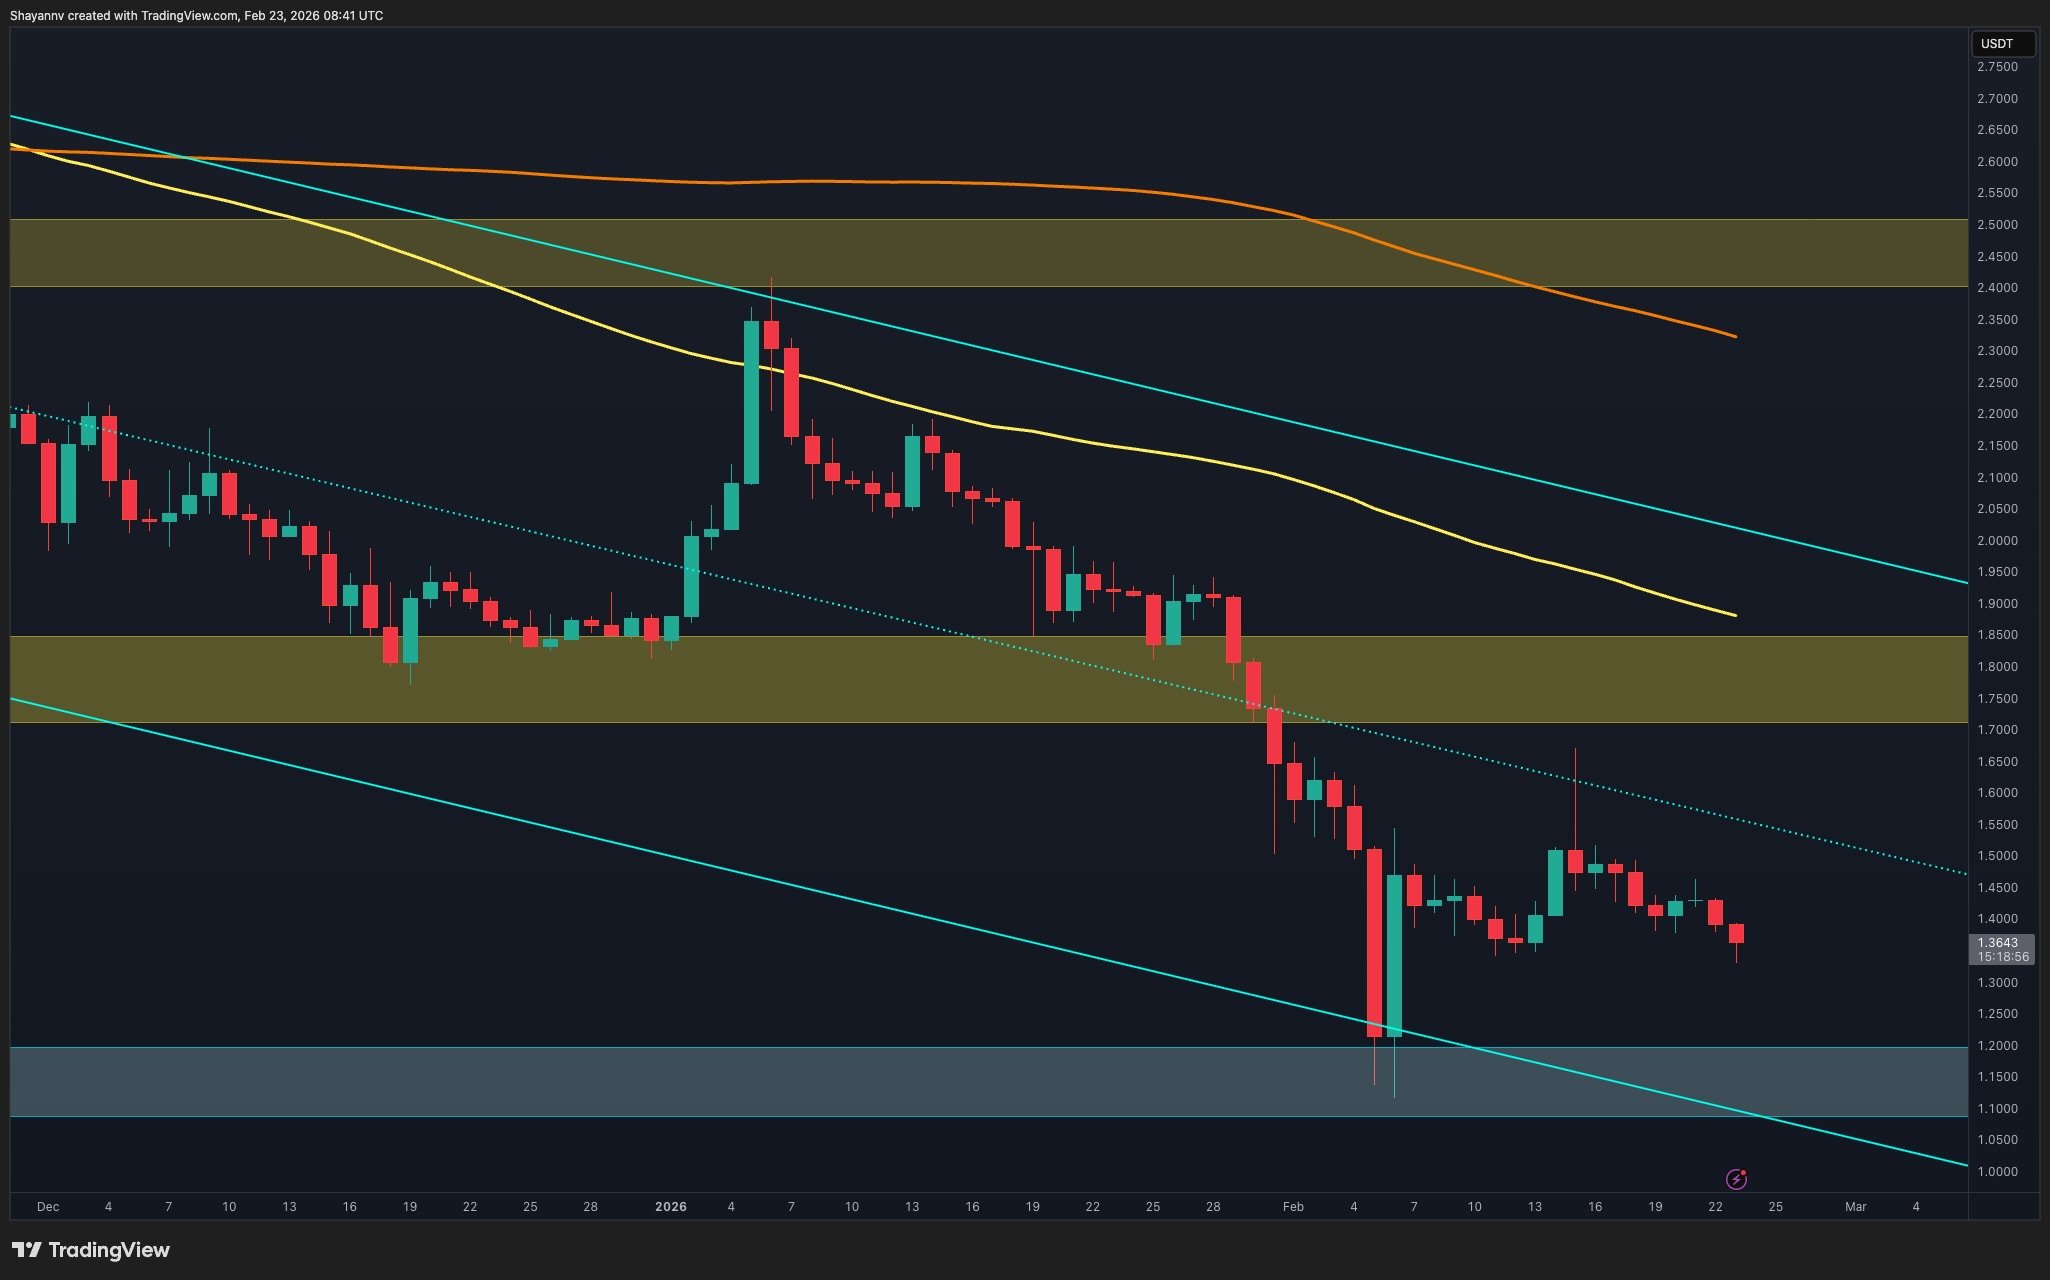
On the daily chart, XRP aimed to penetrate the $1.60 resistance level but failed to maintain momentum beyond it. This brief surge resulted in a liquidity sweep where buying pressure was met with selling, leading to a downtrend.
If XRP cannot reclaim its mid-line resistance, it will likely continue within its established range, with the potential for volatility as liquidity is targeted from both ends.
Ripple Price Chart
XRP/USDT 4-Hour Analysis
On the 4-hour chart, XRP retains a bearish outlook, confined within a declining pattern. After a failed breakout, the price has shifted back into its downward trend, creating lower highs.
The recent bounce from the $1.10–$1.20 zone was sharp but corrective. Currently consolidating around the $1.35–$1.40 mark, XRP faces ongoing resistance while it remains below the mid-structure of $1.50. A significant sell-off is likely if the asset loses current support, heightening the chance of further drop.
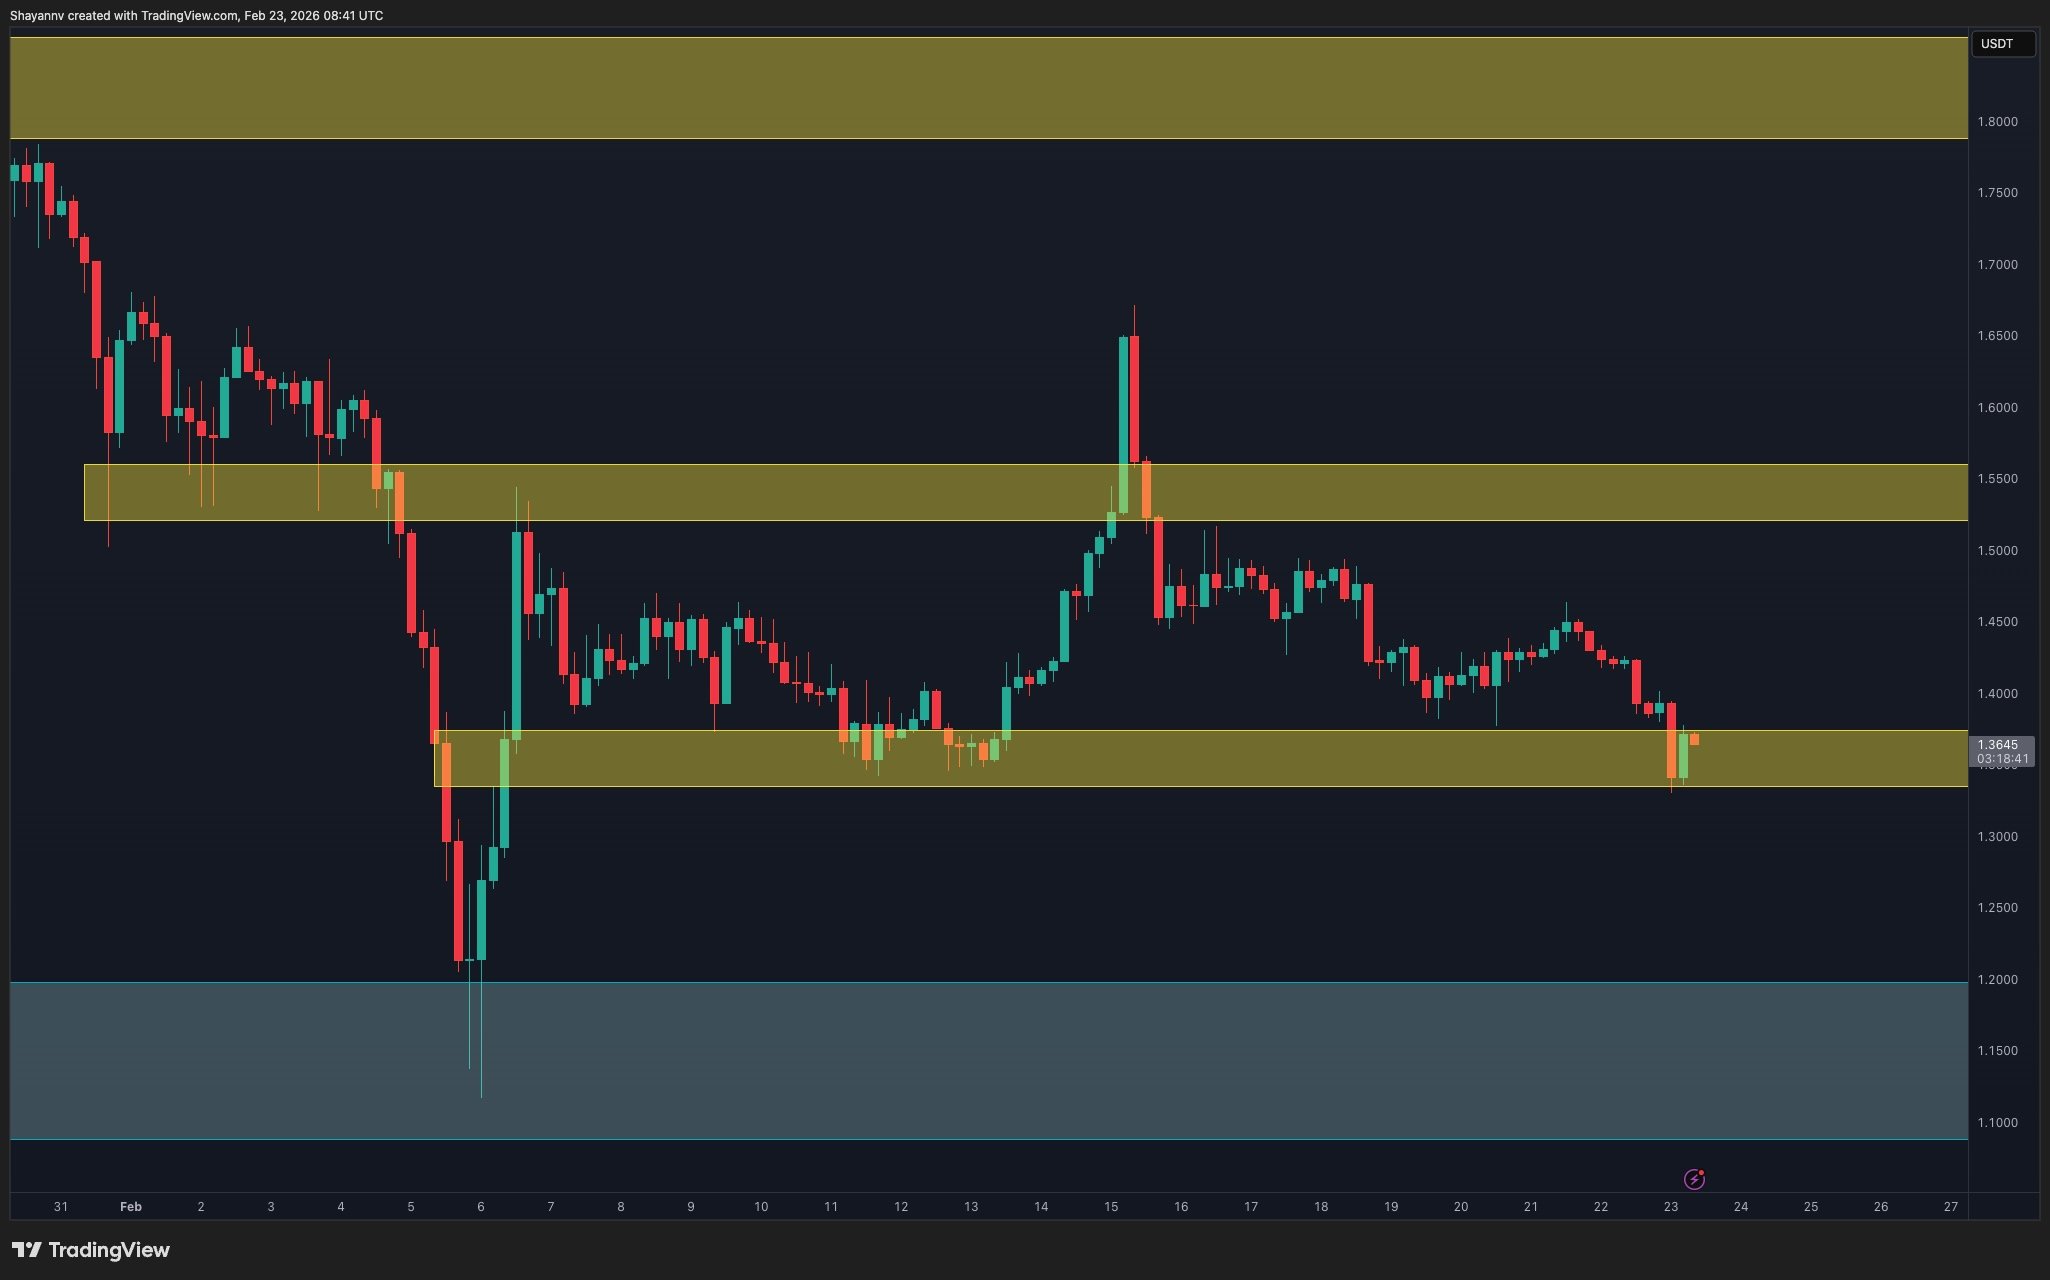 4-Hour Chart
SPECIAL OFFER (Exclusive)
Binance Free $600: Use this link to register a new account and receive a $600 welcome offer on Binance.
This article provides insights gathered from various analysts and is intended for informational purposes only. Always conduct your own research before making any financial decisions.
