Analyzing Ethereum's Price: Crucial Support or a Deceptive Value Trap?
This article dives into the current price trends of Ethereum, discussing significant support levels and potential resistance as it navigates a complex market.


Analyzing Ethereum’s Price: Crucial Support or a Deceptive Value Trap?
Ethereum is presently in a broad corrective phase, trading below essential moving averages within a clearly defined descending structure. There are indications of short-term stabilization near support, yet the overarching trend still leans towards a bearish outlook unless significant resistance levels see strong momentum for recovery.
Ethereum Price Overview: Daily Chart
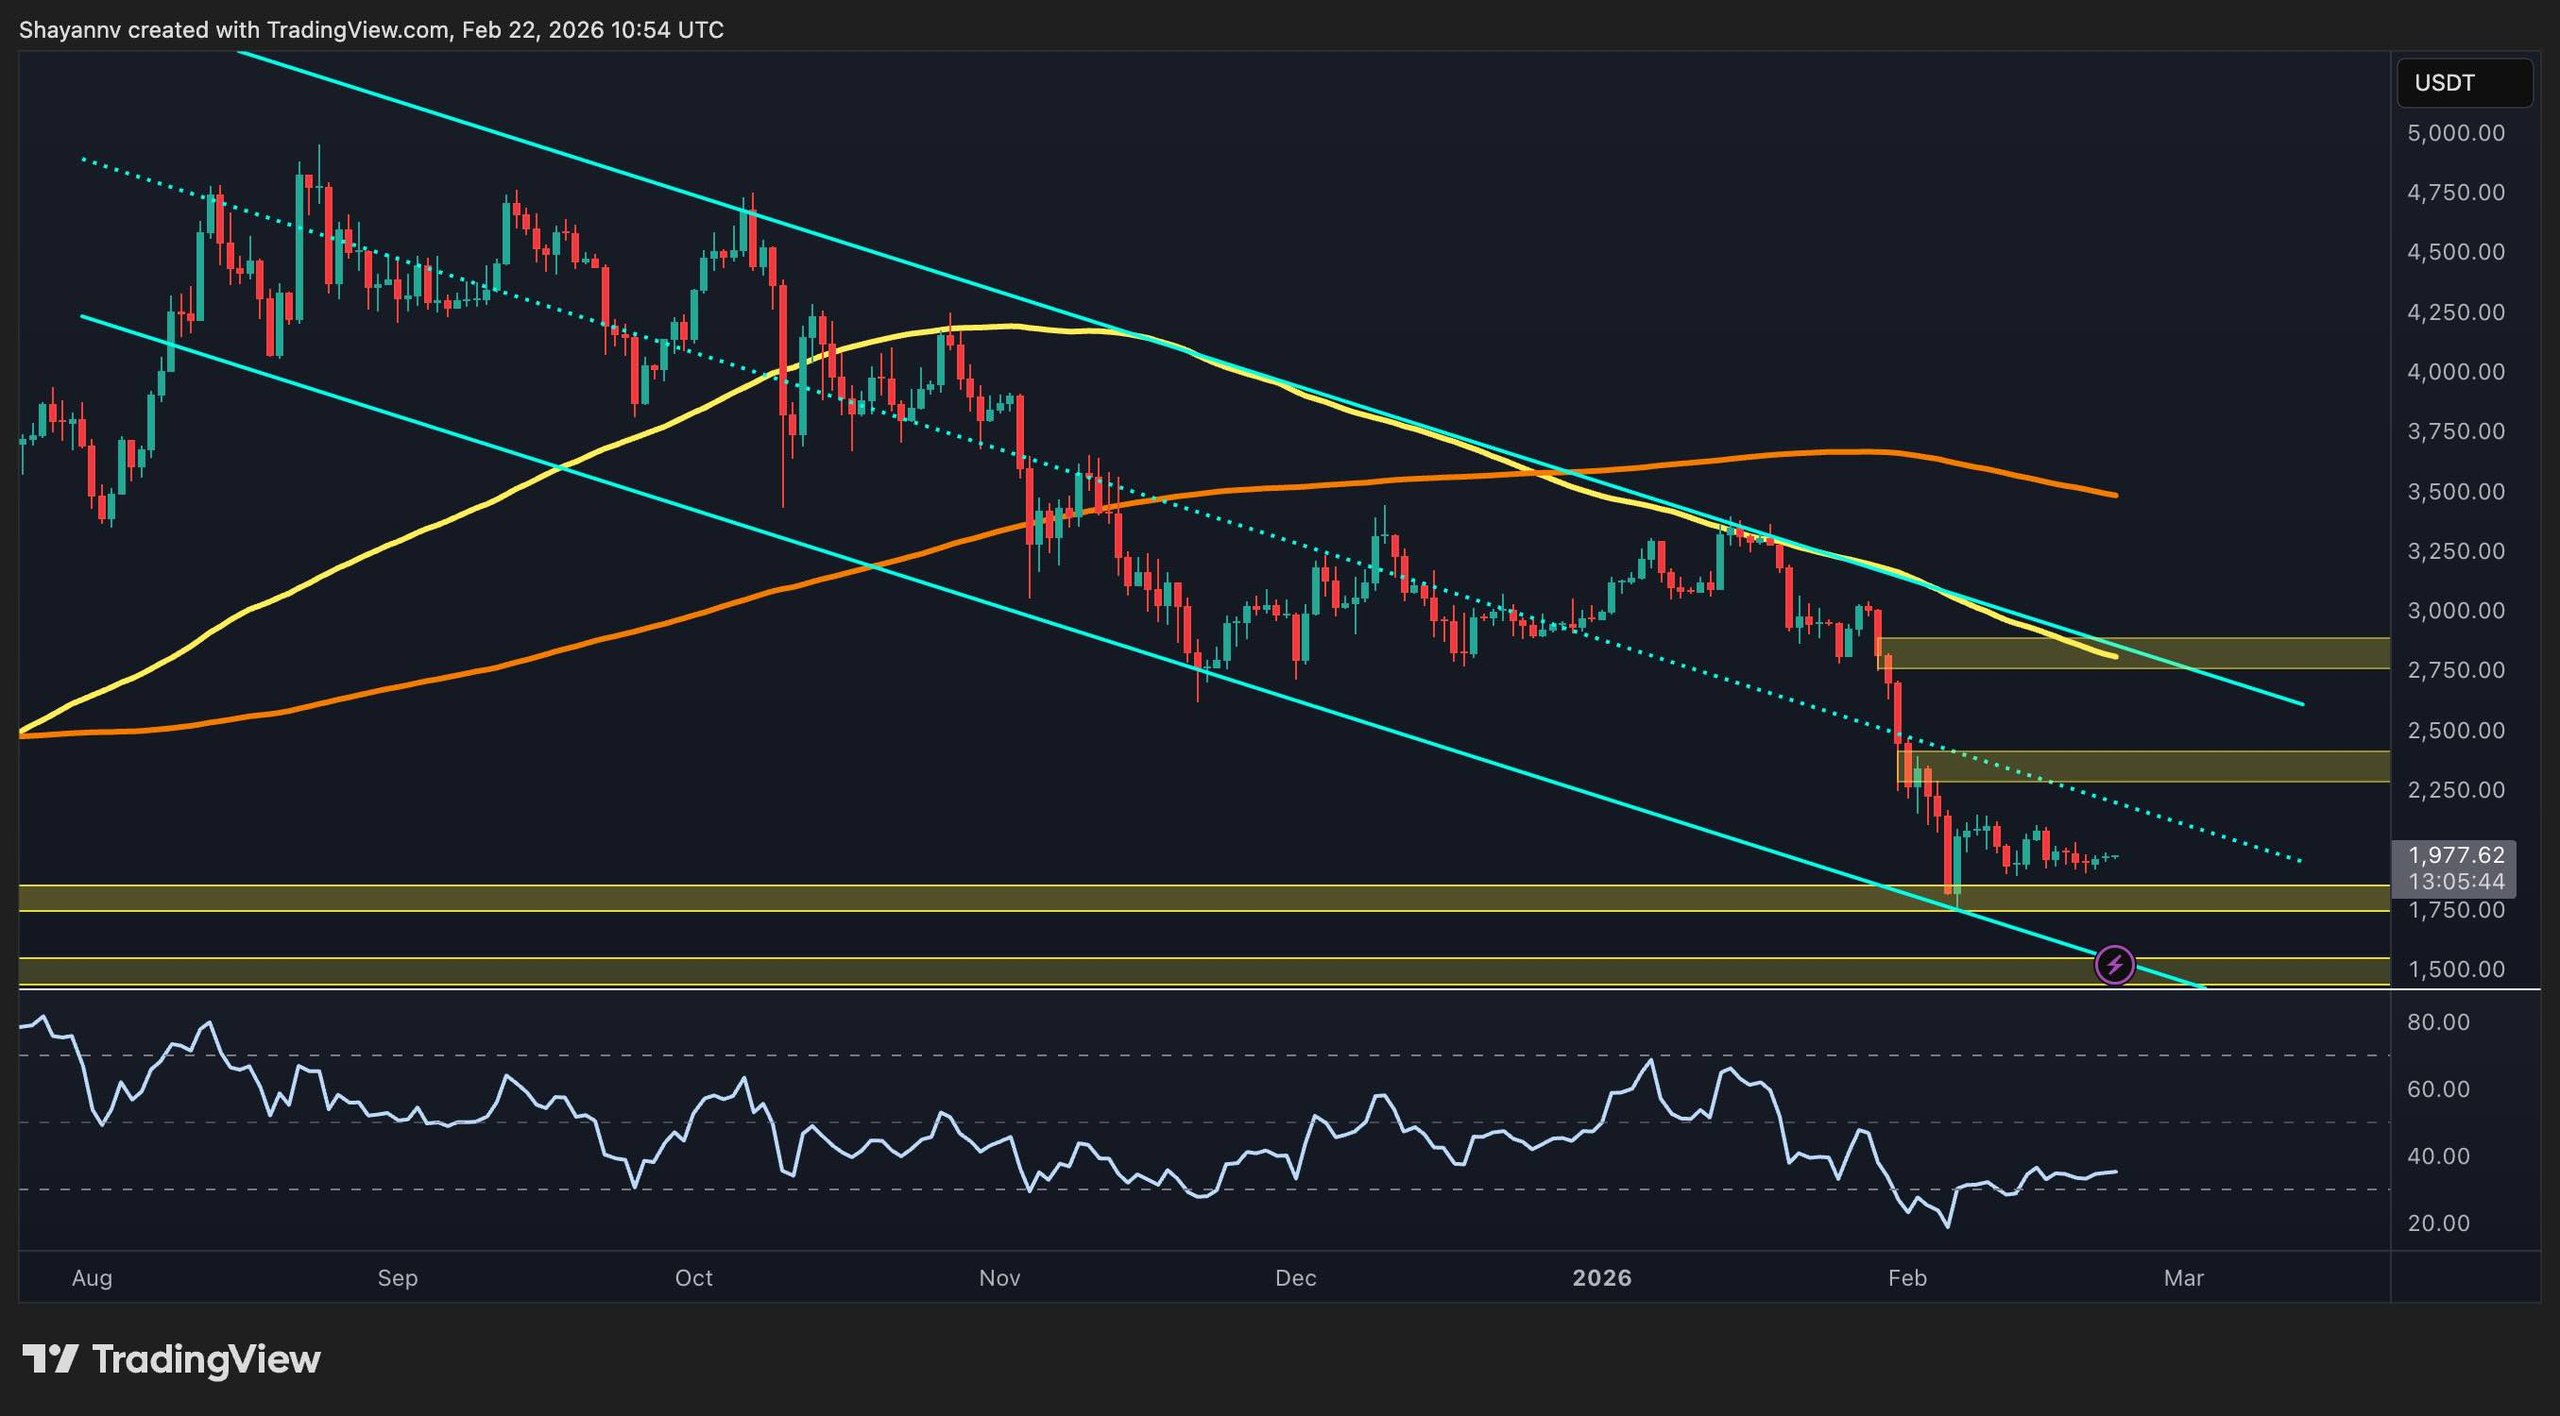
On the daily chart, ETH maintains a bearish position in a descending channel, regularly forming lower highs under the 100-day and 200-day moving averages. A recent breakdown pushed prices into the $1,750–$1,800 demand zone, where buying pressure has appeared, but the trend remains pessimistic overall.
The $2,300–$2,400 area is now identified as a critical resistance zone, coinciding with previous breakdowns and just below the falling 100-day moving average. Without reclaiming this level, upward movements will likely be temporary corrections, leaving the asset prone to further testing lower support levels.
Ethereum Daily Chart
ETH/USDT 4-Hour Chart
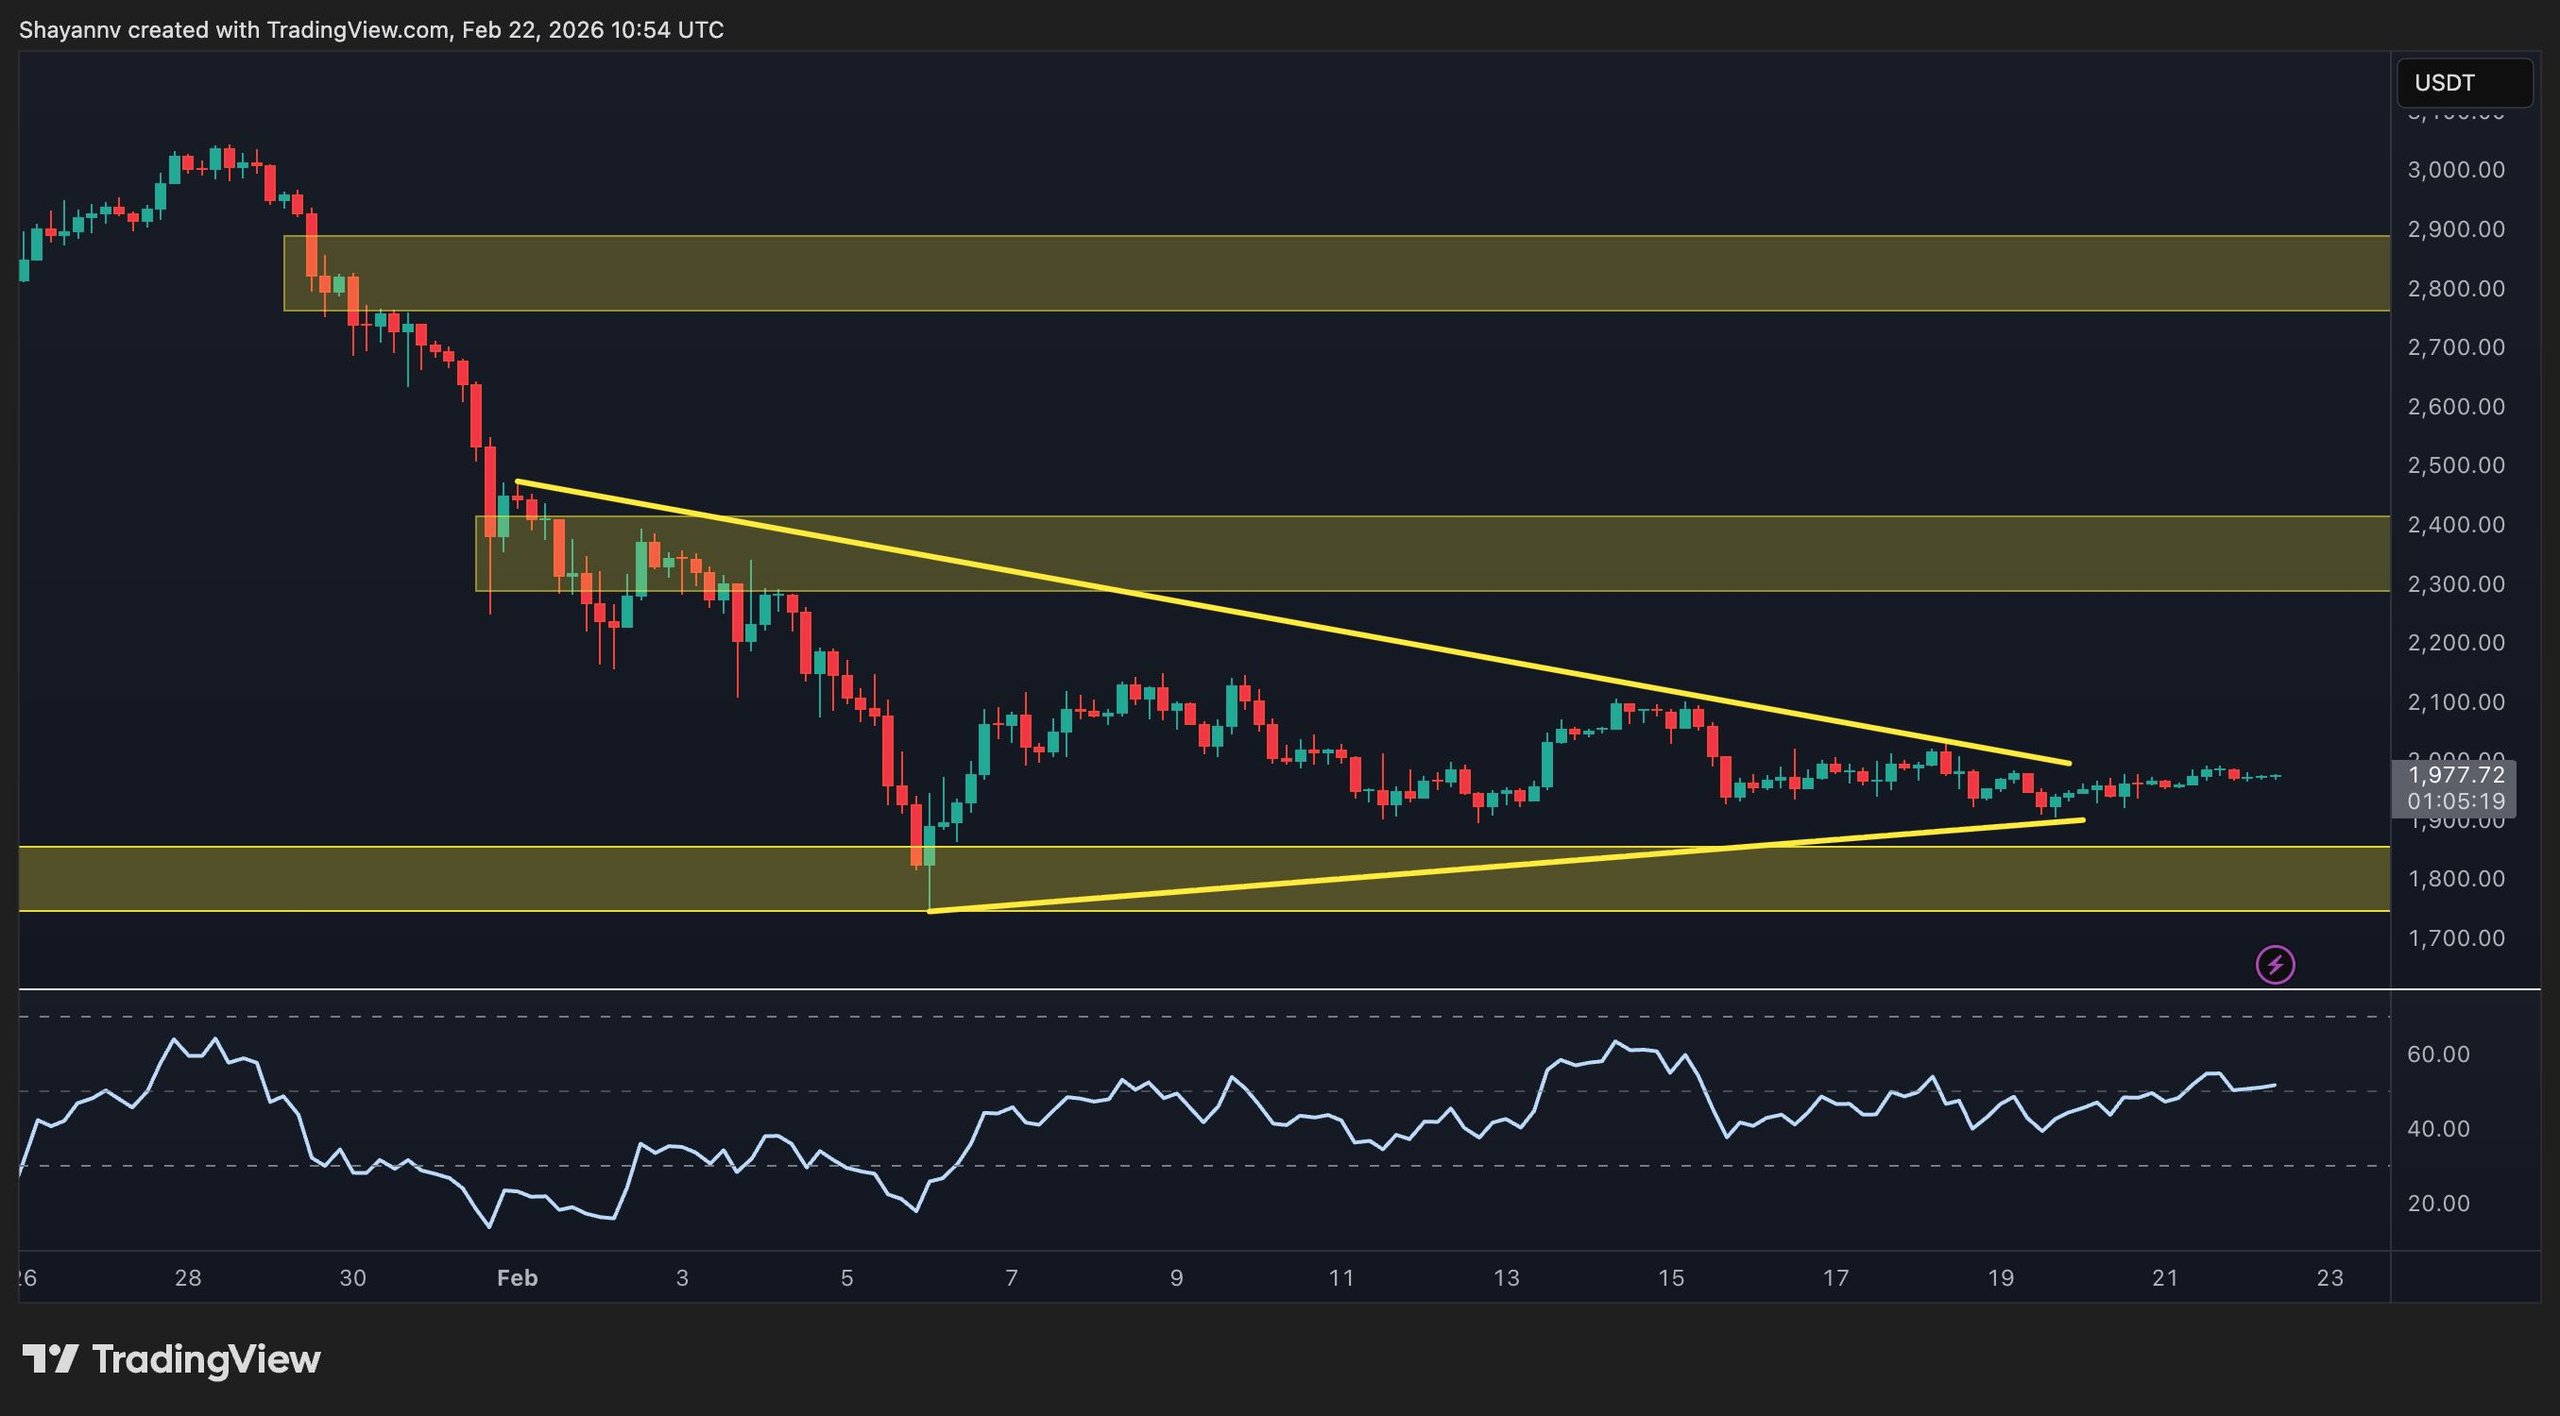
On the 4-hour chart, ETH is trending within a symmetrical triangle characterized by recent lower highs and higher lows, resting above the $1,800 horizontal support. This short-term compression signals market indecision rather than a confirmed reversal since lower highs continue to form. A breakout above the $2,000–$2,100 range would suggest a shift towards upward momentum, potentially paving the way to the $2,300-$2,400 resistance threshold. On the contrary, a loss of the $1,800 support would negate this consolidation view and likely intensify downward pressures.
 ETH 4-Hour Chart
On-Chain Insights
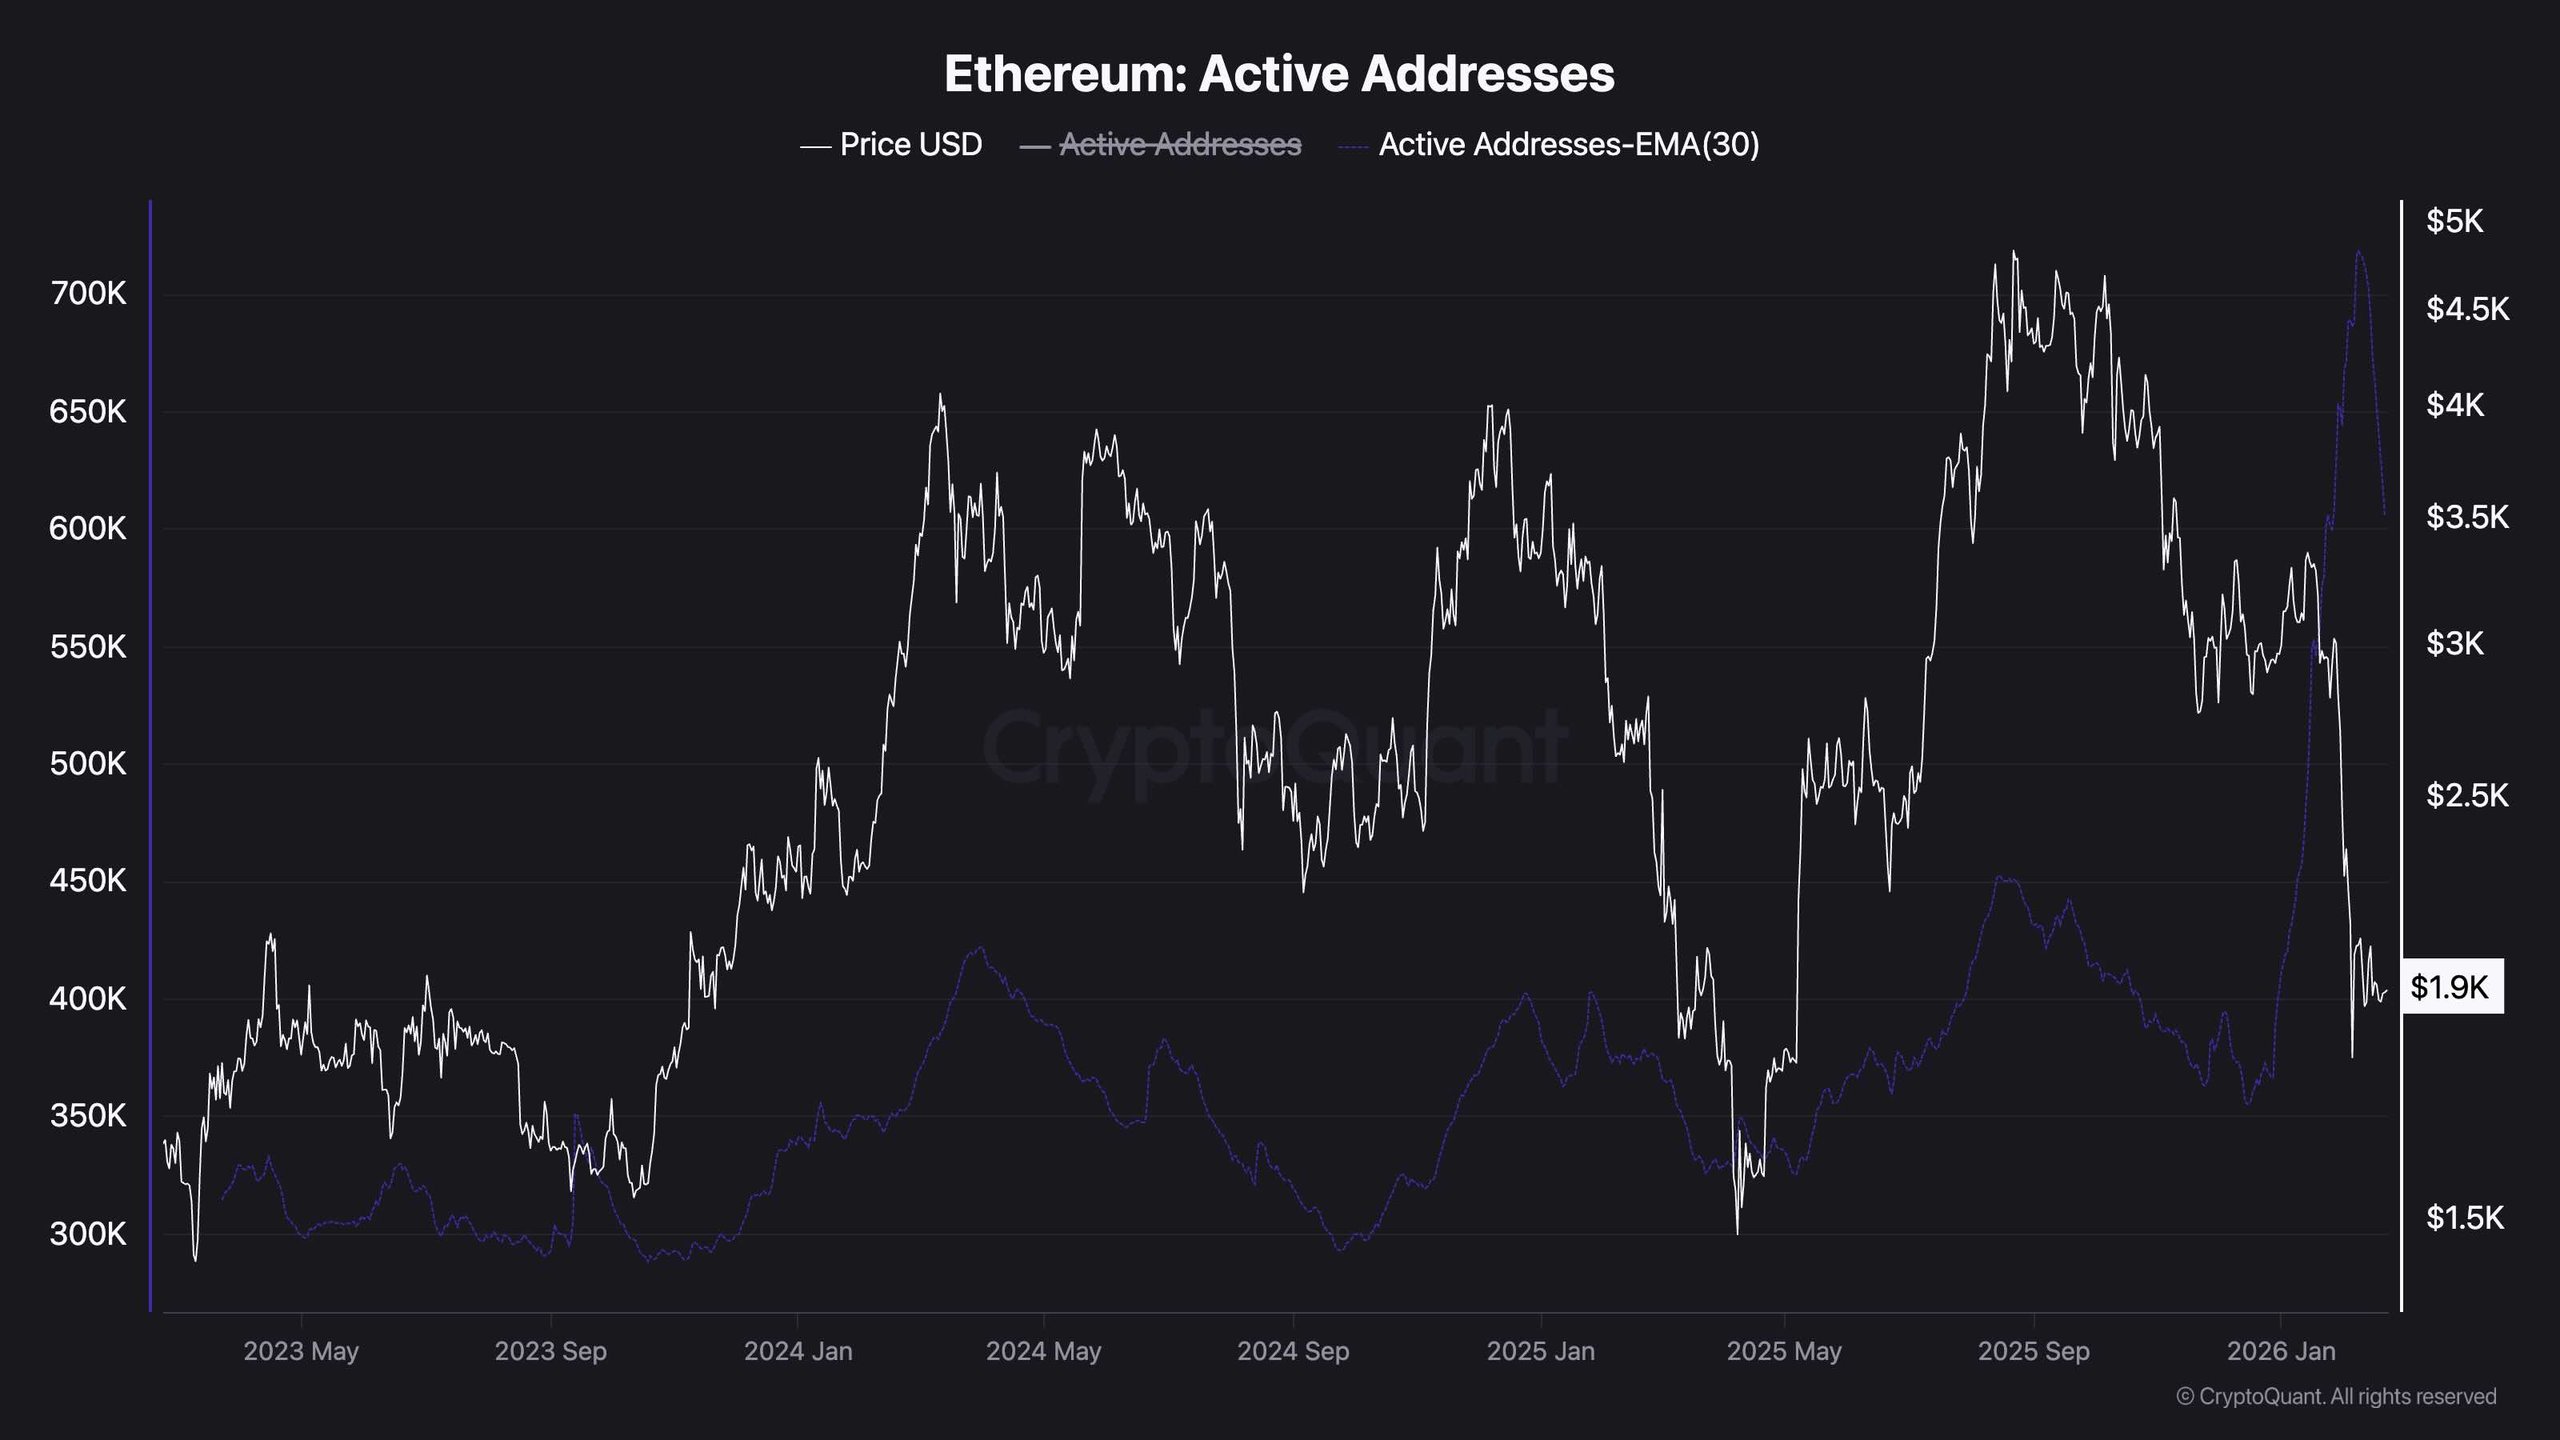
Recent data shows a marked increase in active addresses within the network, with the 30-day EMA of active addresses reaching multi-month peaks. Generally, such increases in engagement correlate with periods of heightened volatility and often precede significant directional moves.
Yet, despite this uptick in engagement, ETH has not yet confirmed any bullish reversals. This contrast implies that while trading activity is surging, capital inflows aren’t compelling enough to elevate prices, possibly reflecting panic selling from weaker holders. Sustained high activity alongside price stabilization could build a solid base; however, a confirmation would require a decisive breakout above key technical barriers.
 Ethereum Active Addresses
Disclaimer: The views expressed in this article are those of the writers cited and do not necessarily reflect those of CryptoPotato. Always perform your own research before making investment decisions.
