
Bitcoin's Negative Funding Rate Could Indicate Upcoming Short-Squeeze Above $70K
Bitcoin's funding rates have shifted negative while open interest remains stagnant, potentially signaling a short-squeeze towards $70,000.


Bitcoin (BTC) fell to a weekly low of $64,111 during the New York trading session on Monday, breaking through the lows set on Sunday evening. Despite this downturn, BTC’s price has remained within a three-week range of $65,000 to $71,000.
Bitcoin Traders May Look Towards Upside Liquidity
The recent decline in price swept away liquidity around $64,000, leading to the liquidation of approximately $240 million in long positions. Yet, Bitcoin continues to oscillate within the established range since February 6. Such sideways movements often create pressure for potential expansions as volatility lowers.
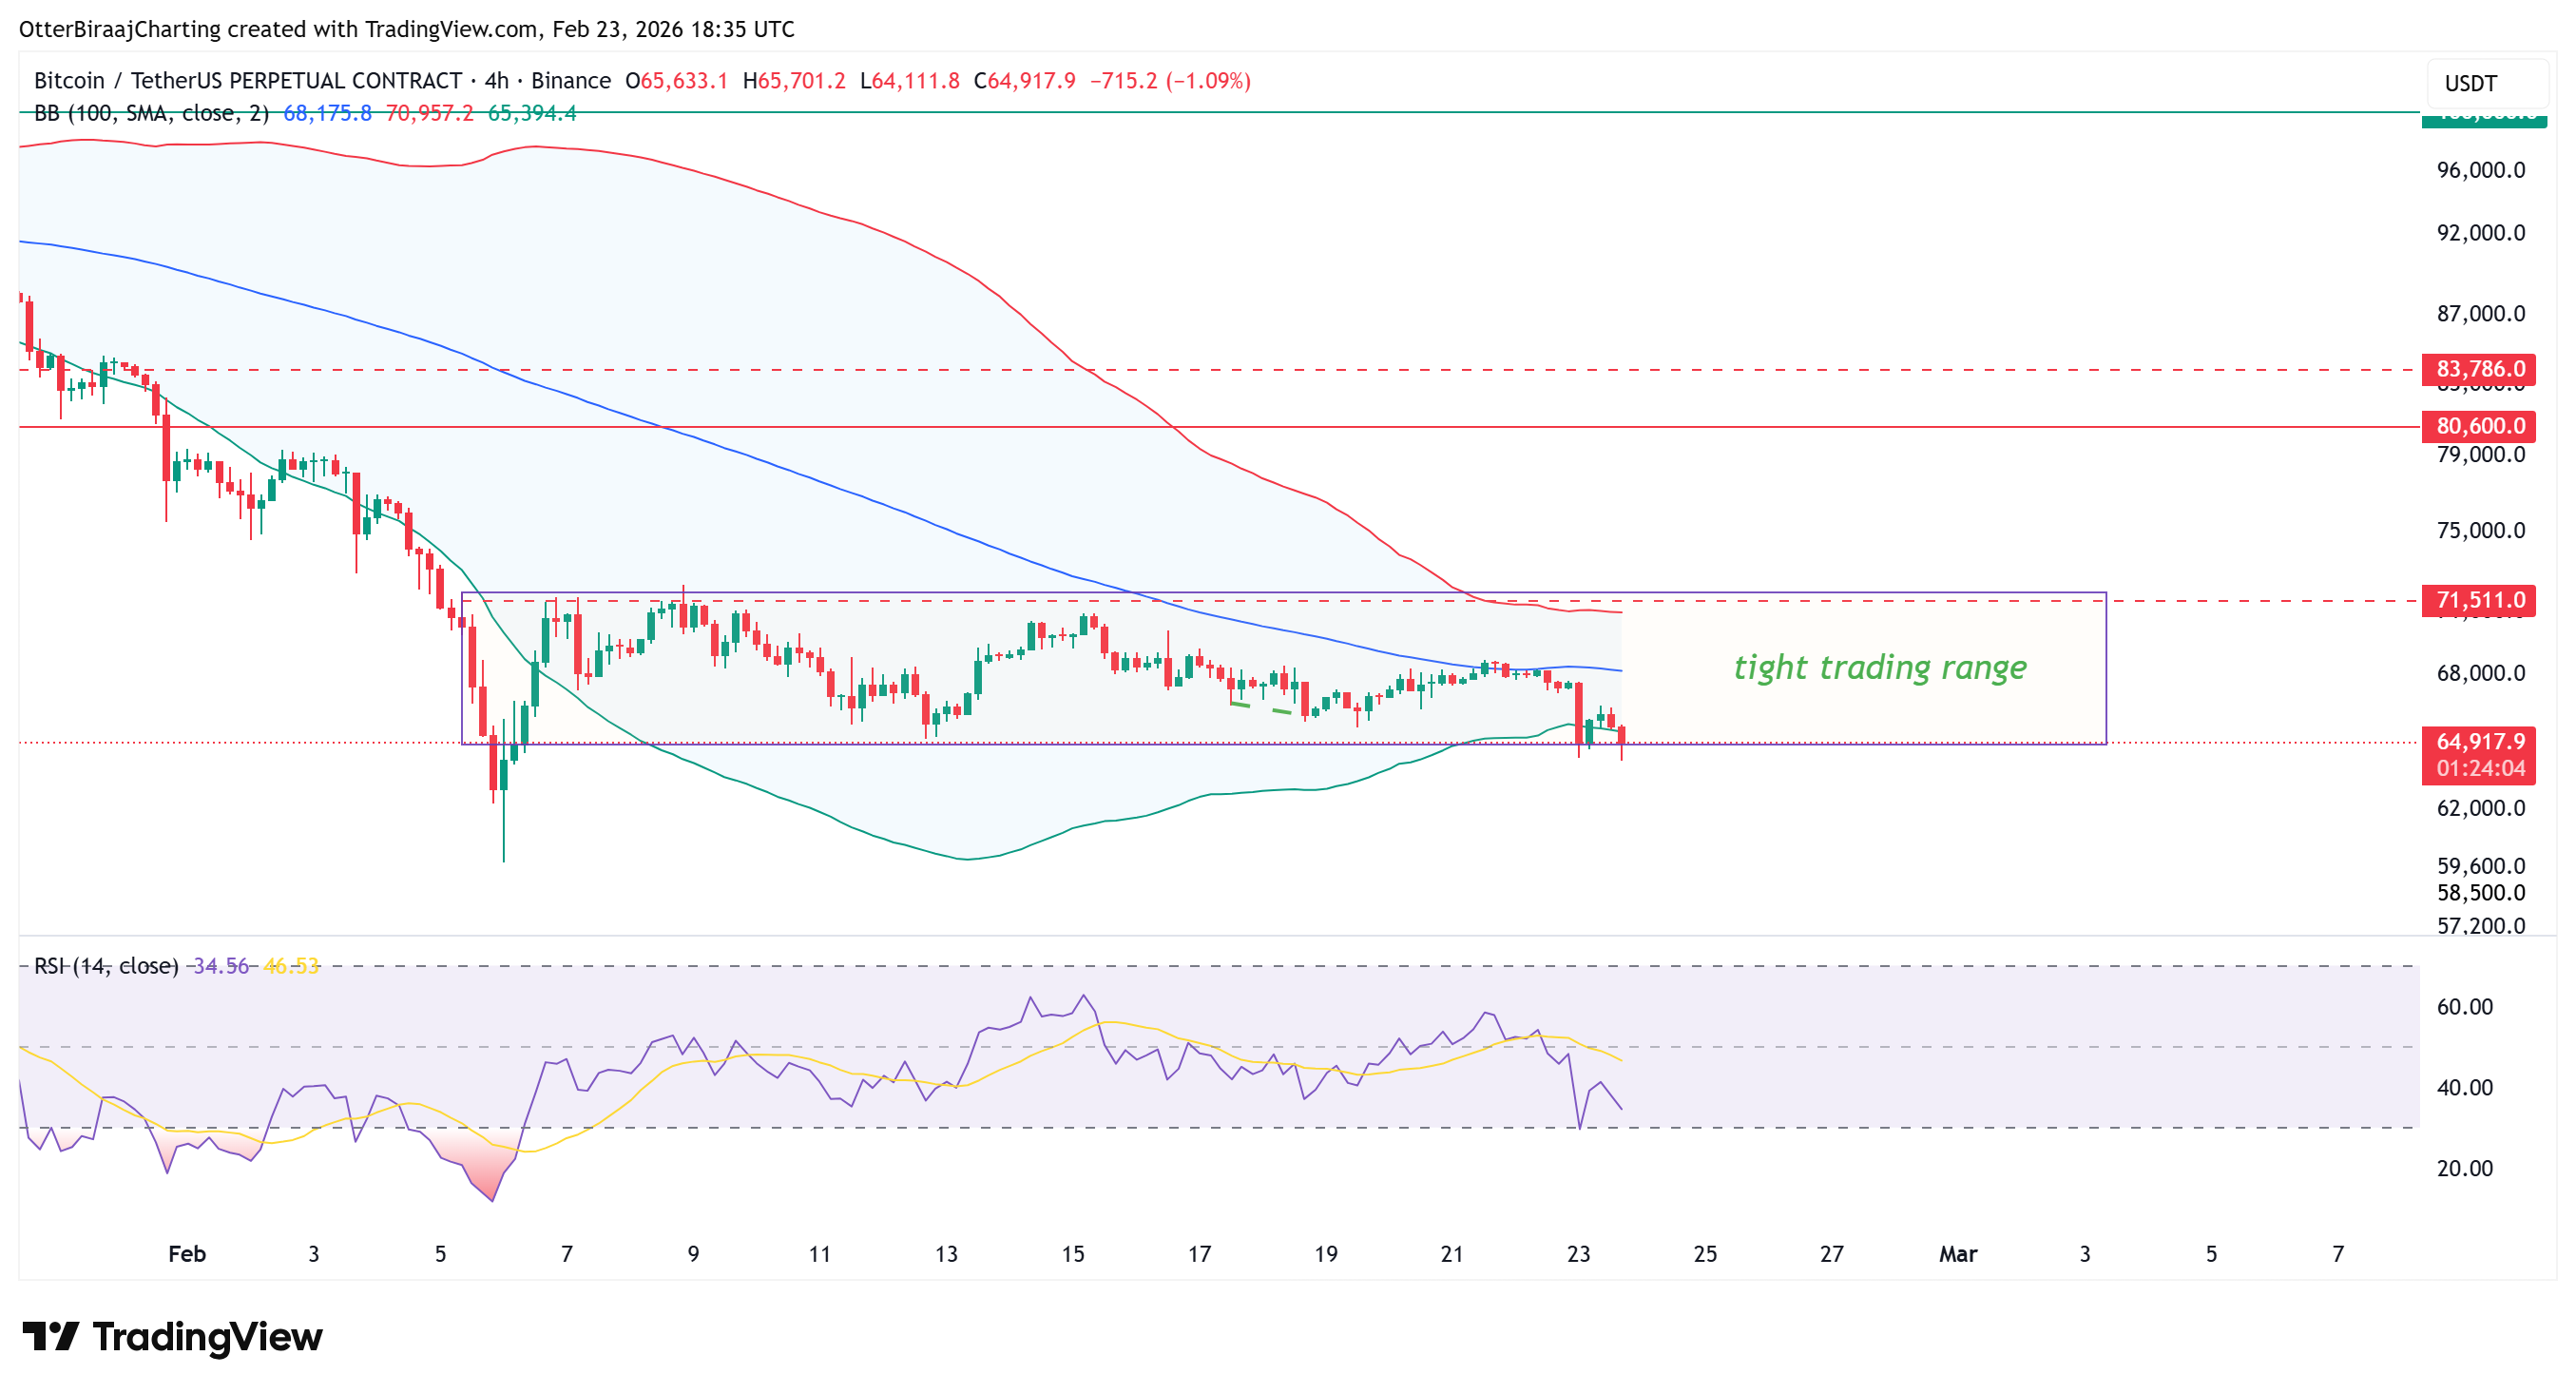 Bitcoin four-hour chart. Source: Cointelegraph/TradingView
The Bollinger Bands have tightened, indicating reduced volatility and a possibility of an expansive shift. Liquidity data reveals over $1 billion in long positions that could face liquidation if the price hits $63,000, while more than $3.5 billion in short positions may be vulnerable above $70,000.
 Bitcoin exchange liquidation map. Source: Coin
BTC’s open interest has plateaued near local lows, indicating traders are not adding new exposure after the downturn. The funding rates have turned negative on the four-hour chart, suggesting that short sellers are compensating long holders. This change indicates a defensive position has formed, with a possible short squeeze if the price targets the upside liquidity.
! Bitcoin’s fluctuations have garnered attention:
- Trader Lennaert Snyder remarked on Twitter that Bitcoin has touched $64,500 in liquidity and that a return to $67,751 could lead towards $76,971, albeit with risks of a brief decline thereafter.
BTC May Approach $63,000 Before Recovery
The one-hour chart reflects an order block around $63,000, an area where buyers previously engaged. A brief dip to this level could clear remaining long liquidity, testing demand. If demand holds, a rebound towards mid-range and potential resistance near $70,000 is possible.
Christopher Inks, founder of TexasWest Capital, highlighted a bullish divergence in the relative strength index (RSI) on the daily chart, coupled with rising volume, which could enhance prospects for another attempt at range highs.
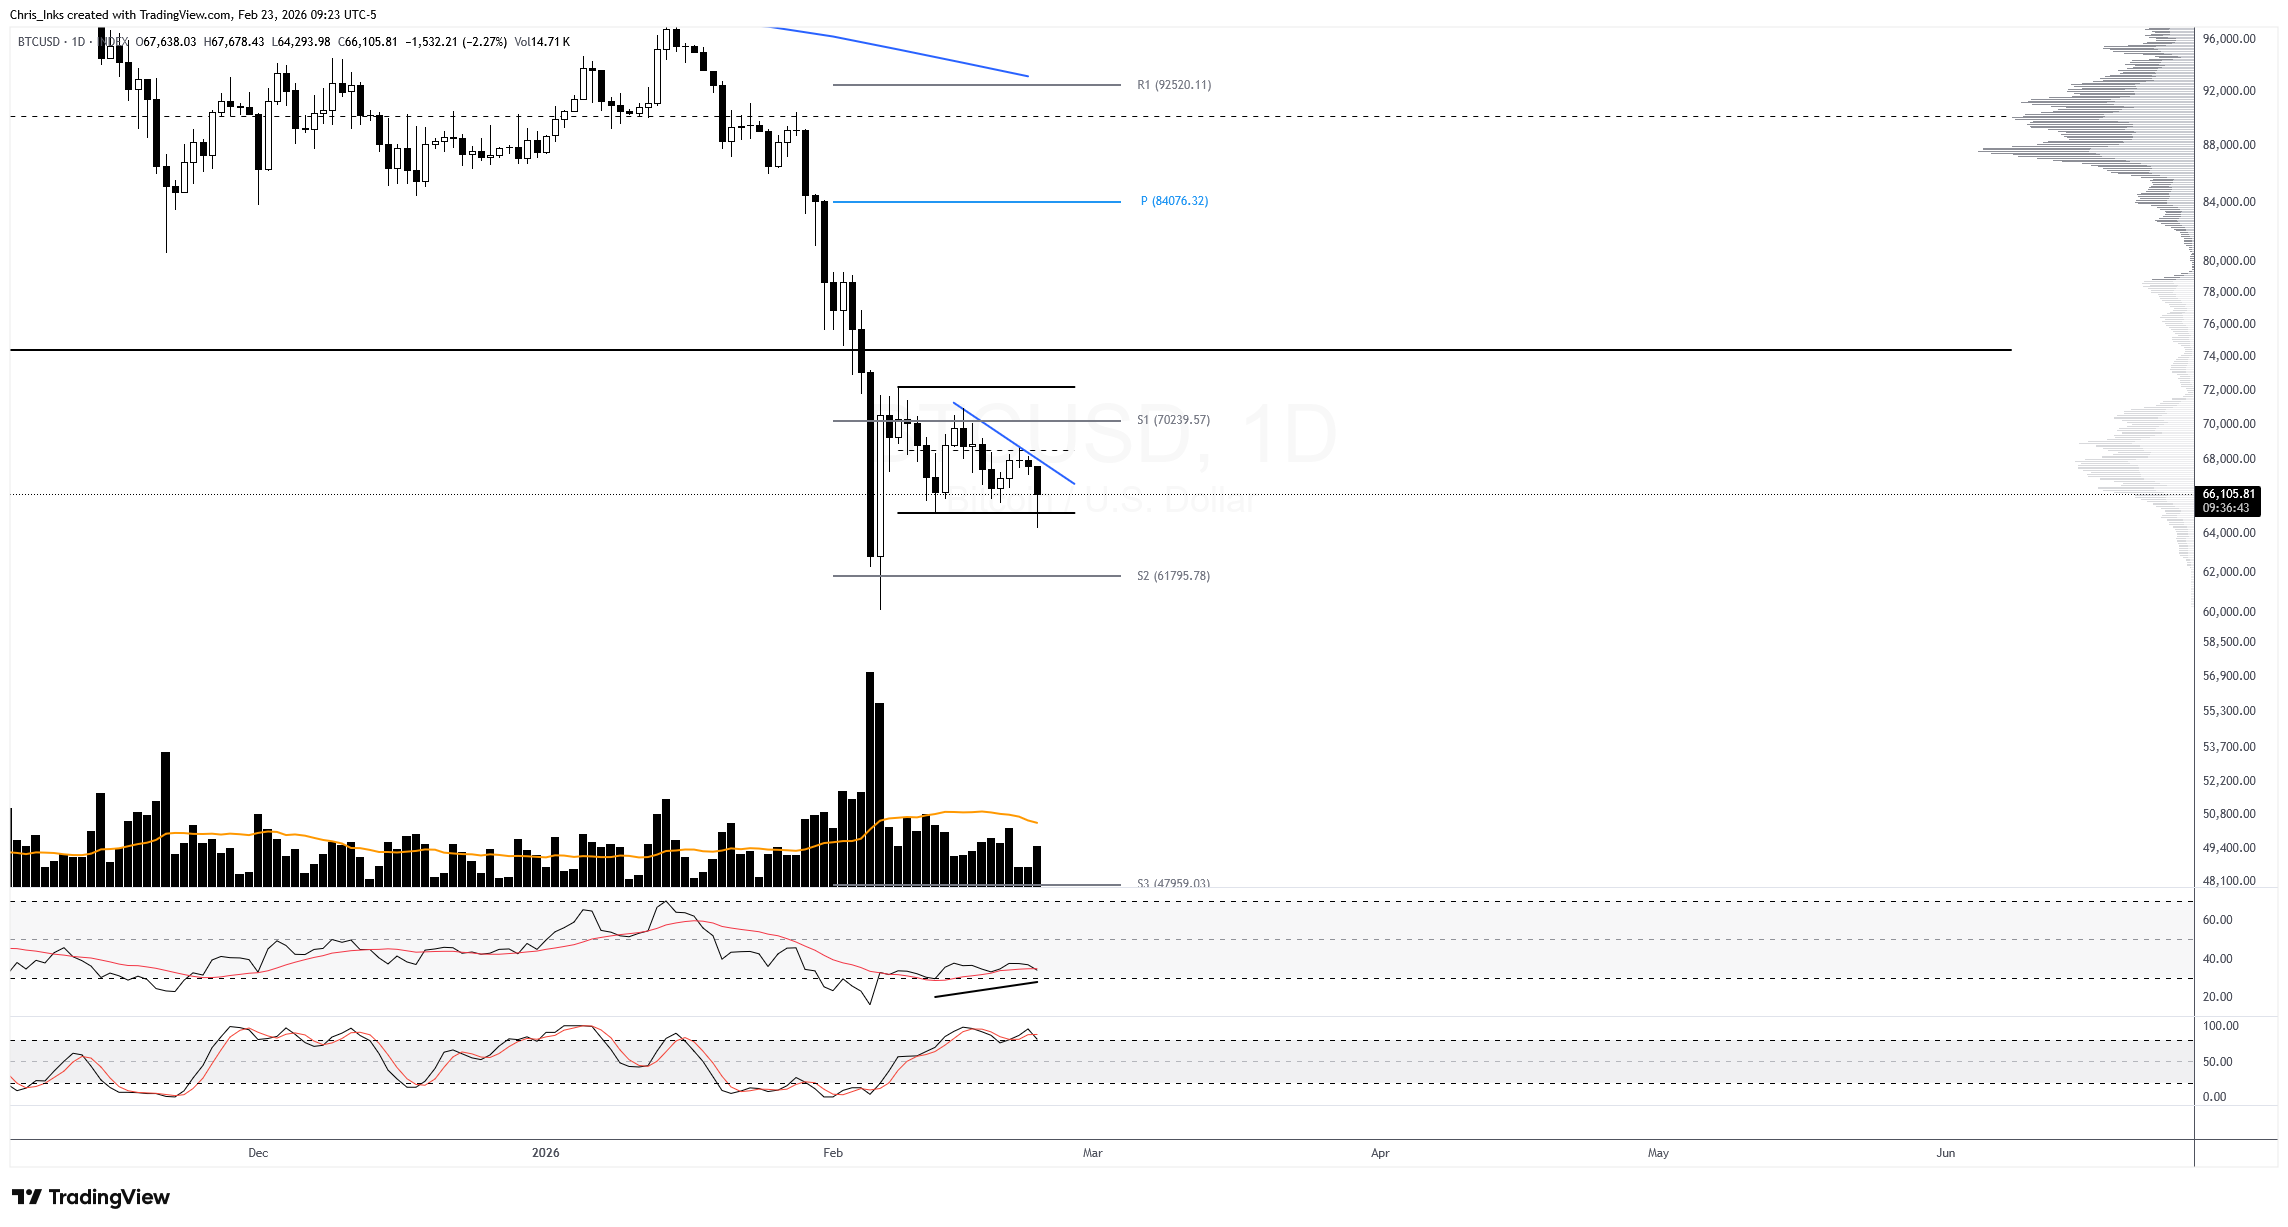 Bitcoin one-day chart RSI divergence analysis. Source: Christoper Inks/X
This article provides no investment advice. All trading carries risk, and research is advised before making decisions.
